The Google Analytics Guide for Ecommerce Merchants Sneak Peek Part 1! Reports Overview

This is the 1st post from our Google Analytics Series featuring the new 35-page Google Analytics Guide for Ecommerce Merchants!
This ebook is the first-ever ebook on Google Analytics created specifically for ecommerce merchants.
Ecommerce merchants can use Google Analytics to track product performance, traffic sources, and content statistics. The most important tool Google Analytics has to offer Ecommerce merchants is the ability to define and track Goals.
The Google Analytics interface is very user friendly. The report format is similar in every tab with options to view different primary metrics as well as options to compare them with secondary metrics.
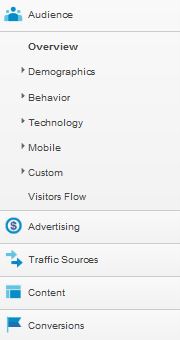
Google Analytics lists the different reports you will use to in the navigation bar on the left side of your screen. You’ll see an Audience, Advertising, Traffic Sources, Content, and Conversions report. Each report features a drop down menu with subsections.
The Audience Report contains the demographics of your website’s visitors. You can see the geographical location of your visitors and which languages they use. The Behavior subsection compares new visitors with returning visitors, number of page views and duration of visits. The rest of the subsections allow you to view how visitors are viewing your site.
This report is useful because it has the basic information needed to start a sophisticated trial and analysis of different personas within your target audience. It also shows how each of those demographics are engaging with your website overall. In essence, this report tells you if you’re reaching your target audience and how well.
 Advertising Report
The Advertising Report is useful for evaluating your Google Adwords strategy and return on investment (ROI). You can keep track of your Adwords campaigns, your bids on keywords, and the matched search queries (the keywords or phrases that visitors typed into a search engine to find your site).
This report is essential to keep track of your advertising campaigns and evaluating your ad investment strategy.
** In order to track marketing campaigns other than Google Adwords, you must create custom URL tags (discussed in the Google Analytics Guide) which you can then find in the Traffic Sources Report **
The Traffic Sources Report tells you where the traffic to your website is coming from. It categorizes the traffic into four different types: Search, Referral, Direct, Campaigns. It also provides search engine optimization (SEO) information.
This report gives you a birds-eye-view on the impacts each traffic source has on your website. You can also use this report to analyze your best performing campaigns’ ROI and evaluate which sources and/or mediums are having the greatest impact on your website.
The Content Report contains information regarding how visitors are looking at your website. It lists which pages are getting the most views and the most common landing pages and exit pages. You can evaluate the impact that site speed has on user interaction and bounce rate, as well as using site search metrics to identify new opportunities to improve your content strategy.
You should use this report because it enables you to gauge how effectively your content is engaging your visitors.
This is the most important report for ecommerce business owners. A conversion takes place when a visitor completes a goal, or an action that is valuable to your business. When you define goals and install ecommerce tracking (discussed in the Google Analytics Guide) you will be able to track conversions and purchases.
This report and its subsections tell you how visitors are completing goals or buying products, how they reached the conversion page, and how long it took them. This information is vital when evaluating the effectiveness of your content and your advertising strategy.
Navigating through reports in Google Analytics is very user friendly. All the reports feature the same navigation tools which makes analyzing the reports simple and easy. All of the reports are located in the left navigation bar. Clicking on a report usually takes you to an Overview page.
The Overview pages gives you a quick look at the information found in all of its subsections. Sometimes an Overview page does not appear so you have to click on a subsection that drops down.
The subsections will give you in-depth insights and/or link you to a more in-depth report in another section.

The Explorer tab is an extremely valuable tool and is often overlooked by ecommerce business owners. The Explorer tab allows you to view a primary dimension and the metrics associated with it in relation to your goals and your ecommerce tracking. In essence, it allows you to view the statistics of all of your visitors or view the statistics of the visitors who converted goals or purchased products.
The Explorer tab defaults to show the Site Usage metrics for all of the reports in Google Analytics. The primary dimensions will vary depending on which report you are looking at.
You can also change your primary dimension to view different metrics or select a secondary dimension to compare metrics (Link to Primary/Secondary Dimension section). Typically, the Site Usage metrics include the number of visits, the number of pages a visitor during their visit, the average visit duration, percentage of new visits, and bounce rate.
You can view the metrics of each report in regards to a specific goal and/or your ecommerce tracking by selecting different options in the Explorer tab. When you’ve defined a goal, you’ll see an option next to the Site Usage link called ‘Goal Set 1,’ ‘Goal Set 2,’ etc. under the Explorer tab.
Clicking on a Goal Set will display the primary dimension and metrics for the visitors that completed the goals you defined.

The ability to shift the focus of your reports from Site Usage to different Goal Sets or your Ecommerce tracking helps you evaluate the behavior of all your visitors versus the visitors who convert a goal or purchase a product. Comparing the behavior of visitors who complete a goal or purchase a product with all visitors allows you to see which aspects of your website or marketing campaigns are working and which aspects are not.
Because the Site Usage is the default view in the Explorer tab does not mean it shows the most valuable information. In fact, if you have only been using the Site Usage view in the Explorer tab and not taking advantage of the other options, you’ve been missing out on a lot of valuable analytics.
The next few sections will provide a better look at reports that give more insightful information to allow you to effectively evaluate new business strategies.
This is the 1st post from our Google Analytics Series featuring the new 35-page Google Analytics Guide for Ecommerce Merchants!
This ebook is the first-ever ebook on Google Analytics created specifically for ecommerce merchants.