Measuring Facebook Ad Performance? Here's Why Last Click Should Be Your Last Resort


Facebook is a behemoth of the advertising world. The company is gaining ground on Google’s market share and drove over $33 billion in ad revenue during 2019.
Unfortunately, the advertising platform can also be tricky for marketers as its conversion data lives in a silo and is not easily integrated with other platforms–making measuring Facebook ad performance and ROI difficult.
Many advertisers capitalize on the Google suite of products where you can track digital advertising efforts with Google Ads or Search Ads 360, and monitor website and app performance with Google Analytics. These are platforms that communicate nicely with each other. However, while these offer glimpses into more nuanced attribution models, at the end of the day these Google platforms are built around a “last click” model.
As we’ve mentioned in previous posts, “last click” attribution tracks the last customer action taken before conversion and is by far the most popular attribution model.
While the last click model offers simplicity in measurement, it does not show the value of upper funnel channels and can make it difficult to properly measure Facebook ad performance.
So what is the flaw with last click attribution, and how can advertisers better measure their Facebook ad performance?
Most advertising and reporting tools utilize last click attribution out of the box, and therefore many brands use this model without necessarily realizing its flaws.
Because last click is an attribution model that gives credit for a conversion to the last touchpoint or click before conversion, it leaves out any consideration for previous touchpoints. Because of this, the last click model creates hurdles in measuring a multi-channel campaign.
Here’s an example of a scenario where last click attribution doesn’t tell the full story:
In a last click scenario, the branded search touchpoint gets full credit for this conversion.
If most of your purchases occur in this stream of events, you’ll look at your last click reporting in Google Analytics and think “branded search is incredibly efficient, but display and non-brand aren’t actually driving any revenue for our brand”.
This “insight” might lead to decreased funding for these supporting channels, or even worse cutting them off completely. However, without those upper funnel display and non-brand touchpoints, Mary wouldn’t know about your brand at all, and removing those channels will be the death knell for your branded search performance.
This is where the disconnect comes into play between Facebook and last click platforms.
Facebook ads can be a major awareness builder, and if prospective customers are seeing your brand on Facebook but actually clicking through and converting via search or another channel, then Facebook will not be receiving its due credit in Google Analytics.
Facebook has a robust tracking pixel, which by default will report a conversion if someone converts 28 days after clicking (although this window could become shorter) or even viewing a Facebook ad. Facebook also can track across devices. So if you first click a Facebook ad on your mobile device, but make the purchase on your desktop 28 days later, chances are Facebook tracked that entire journey, whereas Google Analytics could be tracking those visits as separate users.
Because of Facebook’s 28-day lookback window and cross-device tracking, it’s possible that Facebook ads play a contributing role in many of your conversions, but that it rarely gets the credit.
If your brand is heavily dependent on Facebook ads, you may even see that your conversion totals within Google Analytics and within Facebook ads manager are almost the same, while Google Analytics doesn’t show Facebook actually driving the majority of conversions.
That dropoff from Facebook conversions to Google Analytics conversions will vary depending upon your scale, media mix, and typical customer funnel. It can vary due to seasonality and due to promotions that are occurring among a plethora of other variables.
The first step here is to get an understanding of your typical dropoff level. As long as you are utilizing proper UTM tracking on Facebook, and the pixel is functioning, you should have clean data to assess this difference.
Choose a long period of time that captures all your brand’s seasonality, and pull a report from Facebook with conversion data, and a report from Google Analytics with the Facebook channel conversion data. For a series of ecommerce clients, Tinuiti did this exact pull and found an 81% dropoff from Facebook ads to Google Analytics.
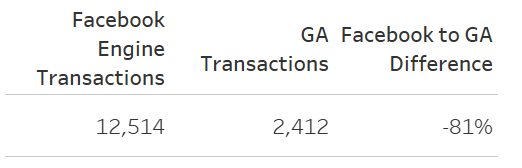
This scenario means that there are 5,385 conversions in Google Analytics that Facebook was a touchpoint in, but that did not receive credit for that conversion. This is your Facebook to Google Analytics dropoff percentage. We will come back to this percentage, but first, let’s look at some more nuanced reports.
One way to get a better gauge of Facebook’s level of assistance to other channels is to look at assisted conversions in Google Analytics.
This report will show you how many conversions a channel ‘assisted’, meaning how many conversions occurred where the channel was a touchpoint in the conversion pathway, but not the final interaction before conversion. You can find this report under Conversions > Multi-Channel Funnels > Assisted Conversions:
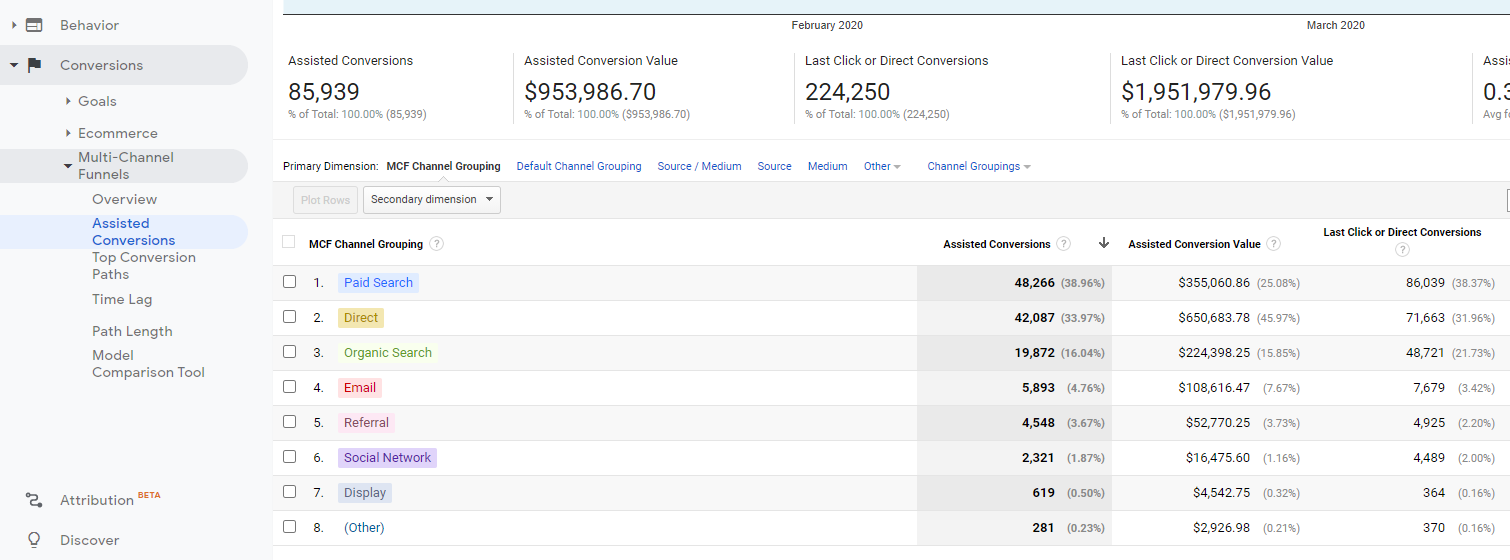
Tinuiti pulled assisted conversion reports for the same selection of ecommerce clients and found the below results:
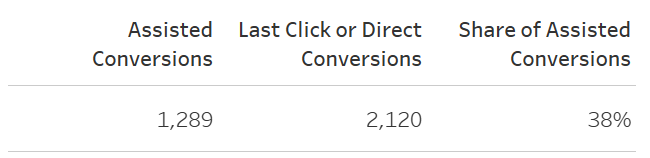
Facebook assisted in 1,289 conversions, meaning it was a touchpoint for the converting user but wasn’t their final channel interaction before they converted. In contrast, Facebook was the last touchpoint for 2,120 conversions.
We can confidently say that Facebook contributed to a total of 3,409 conversions, but only received last click credit for 2,120. So of all conversions that Facebook contributed towards, 38% aren’t attributed to Facebook. Even given that Google Analytics tracking isn’t as robust as Facebook, we still see that it’s capturing a level of assistance that we didn’t realize before.
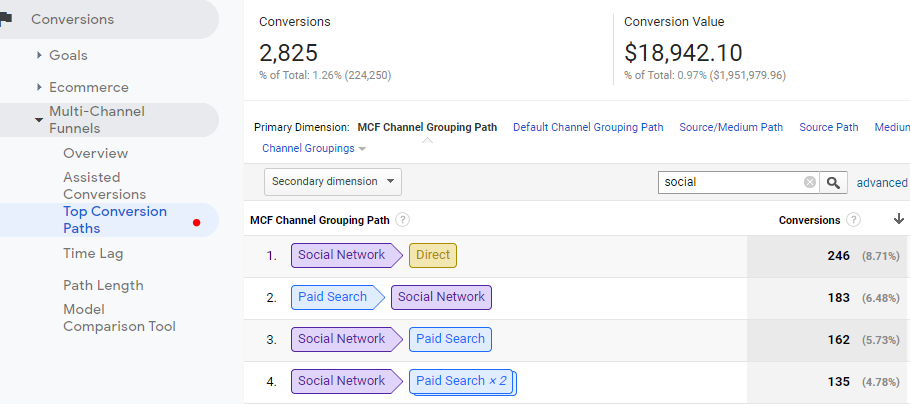
If you’re curious about digging deeper into how channels are working together, the multi-channel funnel reports will actually show how many conversions are attributed to specific channel pathways.
This report can be found under Conversions > Multi-Channel Funnels > Top Conversion Paths.
As you see, Social can be the first touchpoint in many scenarios but other channels are the final interaction:
You will notice that Google Analytics, even accounting for assisted conversions, only attributes Facebook to taking part in a total of 3,409 conversions vs Facebook saying they took part in 12,514.
What gives?
This goes back to the cross-device tracking and Facebook pixel. The default window for attribution within Facebook Ads is 1-Day View and 28-Day Click. The disparity between Facebook and Google Analytics is often in this window.
28 days is a long period of time, and if someone converts 28 days after clicking through via Facebook, chances are they came to your site via another channel, in which case Facebook will collect that conversion data but Google Analytics will attribute it to whatever they saw as the latest touchpoint.
Facebook also tracks view-through conversions which Google Analytics will never collect data on. Simply viewing a Facebook ad and then making a purchase will be captured on Facebook. So if Facebook is being used as an awareness tactic, you may actually capture the first impression for a majority of conversions that are then attributed to other channels in Google Analytics.
Case in point, in the previous example we used Facebook’s default attribution window, which shows us conversions 1 day after viewing and 28 days after clicking. However, if we expand these attribution windows outward we find that in a 28-day lookback window for view-through conversions, there were 13,756 conversions. That’s even more than the total engine conversions we originally accounted for! This is because 13,756 users viewed a Facebook ad without clicking and ended up converting on the site up to 28 days later.
Accounting for click-through and view-through conversions, we find that the overall shift from 1 day to 28-day conversion lookback windows nets out a 129% increase in Facebook conversions. Even within the Facebook Ads platform, we have options for how to monitor conversion lag.
![]()
The most robust and comprehensive solution to these attribution issues would be the implementation of an attribution model that collects data from all of your media sources and assigns credit to them accordingly using data modeling.
However, there are simpler and more immediate solutions you can put into place that will help you get a better gauge of Facebook ad performance if you aren’t ready to take that leap.
In this example, we found that there was an 81% dropoff between Facebook and Google Analytics. You could apply a multiplier to Facebook Google Analytics conversions in order to account for that difference. This would obviously create duplications in conversion data, so this isn’t recommended as a strategy to count total conversions, but as a strategy to calculate ROI or cost per conversion. If this Facebook campaign cost $100K, then the cost per conversion would drop from $41 to $8 given this multiplier. This would grant you a better understanding of the value Facebook is driving while understanding that multiple channels are contributing to these conversions.
Another option that dives further is a Halo Analysis, which Tinuiti offers as a Mobius App. With a Halo Analysis, Tinuiti will look at your social data as well as website data and find correlations you may not have been aware of, which identify the value that Facebook drives for your overall website.
An example of a finding could be a correlation between Facebook spend and organic search transactions, meaning that spending X more in Facebook campaigns will net out in more transactions from organic search. Another correlation could be between Facebook and Branded Search, where we find the two channels have a symbiotic relationship and that spending more on Facebook awareness can drive more Branded search conversions at a lower cost per conversion.
A Halo Analysis can be a key driver to your understanding of Facebook’s value within your media mix.
Overall, having a better context for how Facebook and Google Analytics track differently allows brands to better conceptualize how your marketing funnel works, and to take all last click data with a grain of salt. There are many options to refine your attribution, and Tinuiti can help determine the best option for your analytics needs.