Digital Ads Benchmark Report Q1 2026

Quarterly Trends Across Google, Meta, Amazon, And More
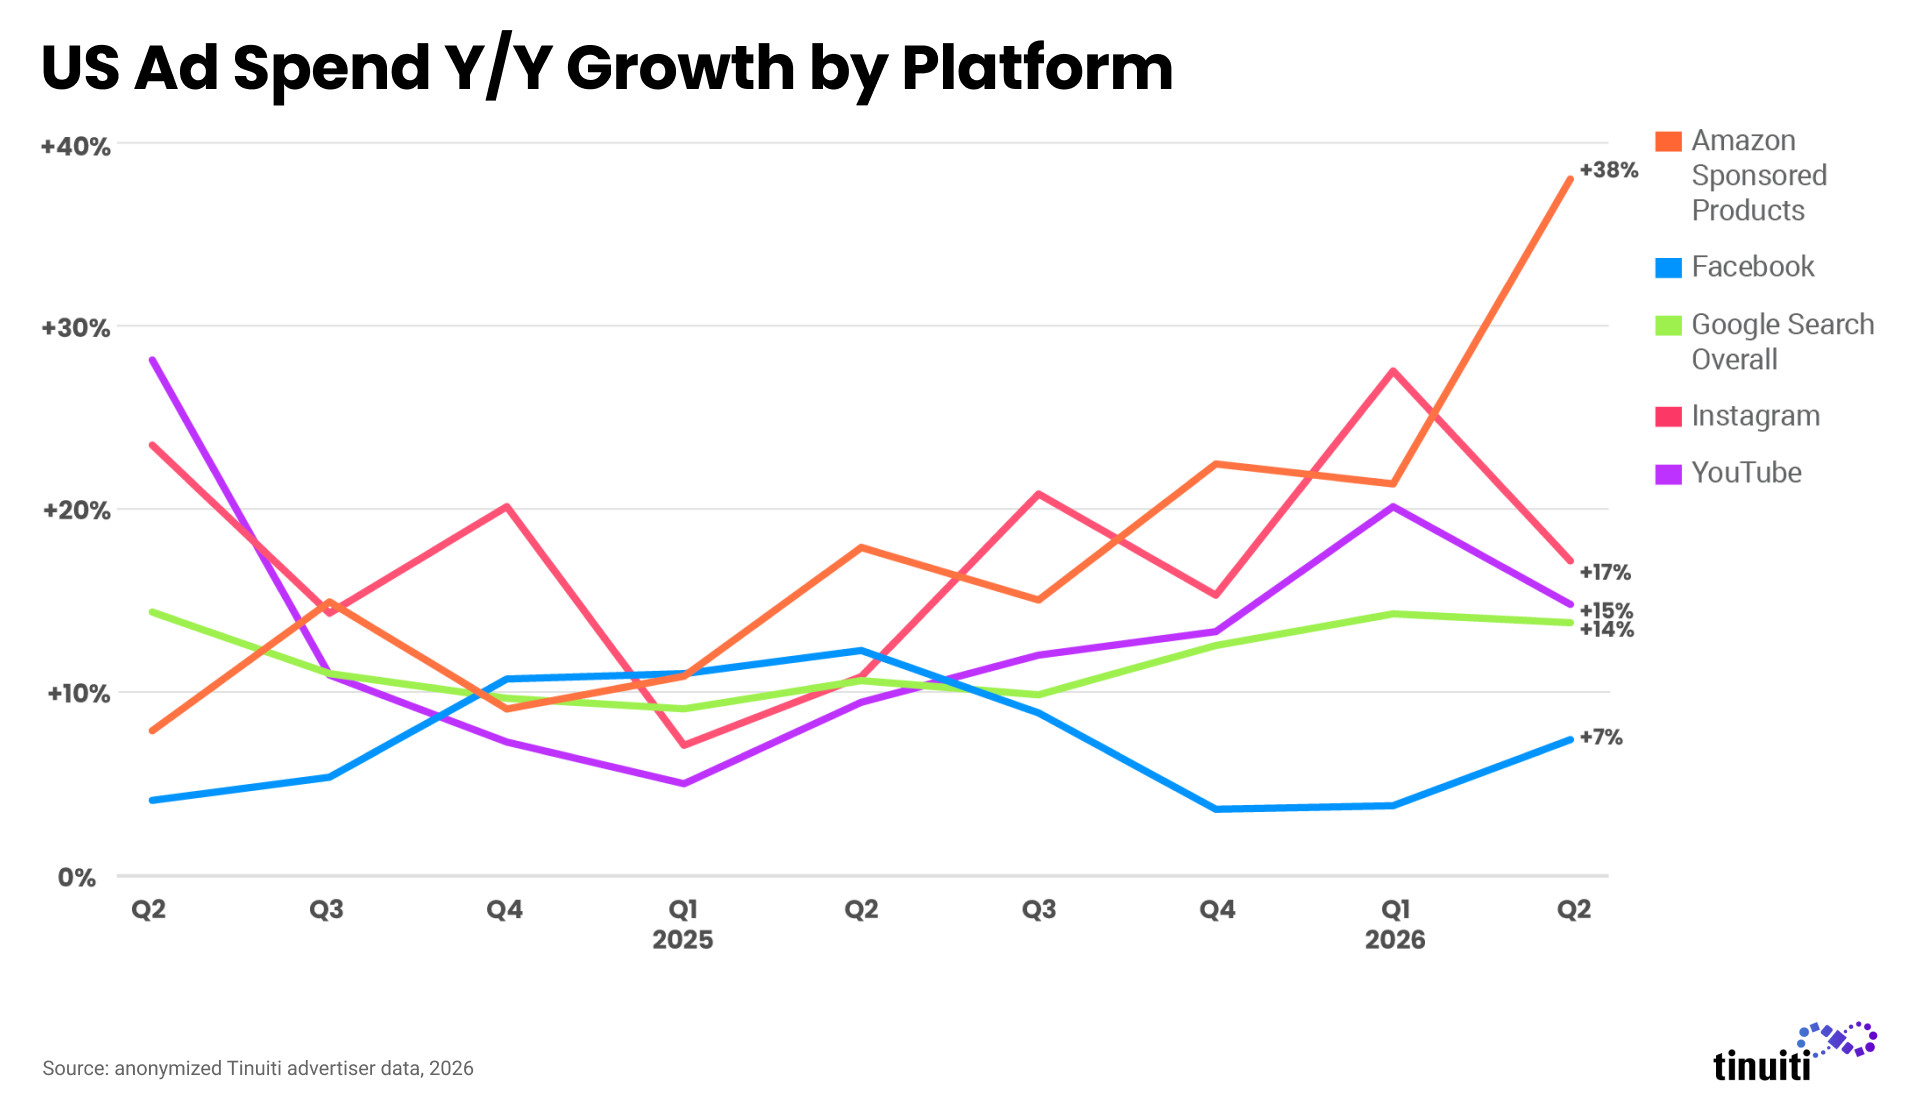
Methodology

The Tinuiti Digital Ads Benchmark Report is based on anonymized performance data from advertising programs under Tinuiti management, with annual digital ad spend under management totaling over $4 billion. Samples are restricted to those programs that have remained active and maintained a consistent strategy over the time periods studied. Unless otherwise noted, all figures are based on same-client growth. The trends and figures included are not meant to represent the official performance of any advertising platform or the experiences of every advertiser.

About Tinuiti

Tinuiti is the largest independent performance marketing firm across Streaming TV and
the Triopoly of Google, Facebook, and Amazon, with $4 billion in digital media under management and over 1,000 employees.

Overall Trends: Spending Growth Mostly Trending Higher Across Major US Digital Ad Platforms Even as Pricing Growth
Remains Muted

Across Amazon Sponsored Products, Google search, Instagram, Facebook, and YouTube ads, four of the five largest digital ad segments in the US saw at least some acceleration in spending growth from Q4 2025 to Q1 2026. The lone exception was Amazon Sponsored Products, which saw a small dip in growth from a particularly strong Q4 result, but still managed to deliver the second highest rate of spending growth in Q1.

Amazon Sponsored Product spending was up 21% year over year in Q1, driven by a 19% increase in clicks. These gains and similar results over recent quarters have come at a time when Amazon has effectively ceased running shopping ad listings in the US on Google. Amazon dropped out of these Google auctions in July 2025 and has remained on the sidelines except for some limited listings for its Amazon Pharmacy arm.

Google seems no worse for wear after Amazon withdrew from its US shopping auctions, with total Google search ad spending up 14% year over year in Q1 for Tinuiti advertisers, the highest rate of growth in nearly two years. No single major retailer has stepped up to fill the void left by Amazon, but the impressions Amazon is forgoing are instead being captured by a wide range of brands.

While Google is seeing strong year-over-year click growth (11%) for its text-based search ads, clicks from its shopping listings grew at a faster pace (18%) in Q1, in part due to strength from Google’s AI-powered Performance Max (PMax) campaigns. PMax campaigns accounted for 67% of spending on Google shopping ad listings in Q1, up from 53% a year earlier, while delivering a slightly higher return on ad spend than standard Google Shopping campaigns in Q1 2026 for brands running both.

Although still a large contributor to total Meta spending among retailers, Meta’s AI-powered Advantage+ sales campaigns have seen their share of spend move in the opposite direction, falling to 20% in Q1 2026, compared to a peak of 38% a year earlier. While this reflects advertisers taking greater control over their Meta spending, most retailers are still running Advantage+ sales campaigns to differing degrees.

Meta’s two largest properties both saw an acceleration in spending growth from Q4 to Q1, but Instagram saw a much bigger lift than Facebook. Against a relatively weak year-ago comp, Instagram spending jumped 28% year over year in Q1, up from 15% a quarter earlier. Facebook spending growth increased just a point over the same period, coming in at 4% in Q1.

After making a significant contribution over the last couple of years, growth in impressions from Reels has stalled on Facebook, even as Reels video ads continue to make impression share gains on Instagram. For the first time in Q1, Reels ad formats now generate a larger share of impressions on Instagram than Facebook.

Although average CPM on YouTube fell 21% year over year in Q1, strong impression growth helped drive YouTube spending up 20% year over year. YouTube spending on TV screen inventory was up 39% year over year in Q1 with TVs accounting for 72% YouTube video campaign spending. TV screens even produced 58% of YouTube video campaign spending from the vertical-focused Shorts ad format.

Outside of YouTube, streaming video ad spending was up 6% year over year, down from 13% growth in Q4. Streaming spending comps strengthened over late 2024 into early 2025 with the rise of impressions from Prime Video ads. Competitive pressure has kept streaming CPM growth in check, however, with CPMs falling 2% year over year in Q1.

Among rising platforms, Reddit saw particularly strong spending growth in Q1, with advertiser investment rising 77% year over year, primarily due to stronger pricing growth. After seeing spending declines during a tumultuous early 2025, TikTok has been on the rebound in recent quarters with spending up 14% in Q1. Growth in spending on Pinterest ads has cooled a bit over the same period but remained solid at 27% in Q1.

Paid Social: Facebook, Instagram, TikTok, Snapchat, and Pinterest

Impressions across all Meta-owned properties rose by 17% year over year for the second straight quarter, a rate of growth not seen in over two years prior to Q4 2025. Spend growth accelerated from 9% in Q4 to 13% in Q1, as CPM rebounded from a 7% decline in Q4 to a 3% decline in Q1. Newer ad formats continue to impact pricing and volume growth metrics over time, particularly in the case of Reels on both Facebook and Instagram.

Facebook spend growth holds roughly steady amid shakeup in impression and CPM growth. Advertisers increased investment in ads on Facebook by 4% in Q1, a slight uptick from the 3%
growth observed in Q4. Impression growth was less than half that of Q4, falling from 19% down to 8%. At the same time, CPM growth went from a 13% decline in the fourth quarter to just a 4% decline in Q1. Growth in Reels impressions has stalled on Facebook after a significant contribution over the last couple of years.

Instagram CPM declines for the first time since 2023. The cost of ad impressions on Instagram fell 3% year over year in the first quarter, the first time that pricing has gone down since way back in Q3 2023. Impressions soared 31%, driving investment in Instagram ads up 28% year over year, the strongest figure since the first quarter of 2024. Instagram Reels ads are now accounting for an all-time high impression share and have grown significantly over
the last year, driving down pricing growth.

Share of retail Meta spending attributed to Advantage+ slides in Q1. Advantage+ sales campaigns, once known as Advantage+ shopping, rose in prominence after launching
widely back in 2022, peaked at 38% of all retail Meta ad spend in Q1 2025. This shared has since declined and fell to 20% in the first quarter of 2026. While spend share is declining, most retail advertisers are still deploying Advantage+ sales to some extent.

One third of all Instagram ad impressions now come from Reels. Reels video ads accounted for just 19% of all Instagram ad impressions back in the first quarter of 2025, but one year later these placements now account for 33%, the highest share ever observed for Tinuiti advertisers. Feed placements, which accounted for the highest impression share of any Instagram ad placement as recently as Q4 2023, now account for just 26% of ad impressions, lagging far behind both Reels and Stories placements.

Reels ads impression share finally stalls on Facebook. Reels video ads and Ads on Reels, which are display ads featured on top of Reels videos, combined to account for 25% of all Facebook ad impressions in Q1, down from 29% in Q4 and 31% back in Q1 2025. The
share of ad impressions attributed to Reels was once much higher on Facebook than on Instagram, largely due to the contribution of Ads on Reels, which aren’t shown on Instagram. Reels ads now have a higher impression share on Instagram than on Facebook.

TikTok ad spending jumps 14% in Q1 on impression and CPM growth. Advertisers pulled back from TikTok through the first three quarters of 2025, as concerns surrounding its future in the US led many to diversify their ad spending to other platforms. Spend growth was positive in the fourth quarter, though, and that momentum carried through to Q1 with spending up 14% year over year. CPM is also now back on the rise, growing 11% year over year in Q1 after four straight quarters of declines.

Advertisers continue to grow Pinterest spend to start the year. Spending on Pinterest ads rose 27% year over year in Q1, slowing from 37% growth in Q4 as advertisers ran up against much tougher year-ago comparisons in the first quarter. Impressions soared 37%, the fourth straight
quarter of double-digits increases, while CPM fell 8%. Q1 marked the first quarter of CPM declines for Pinterest advertisers since Q3 2024. Advertisers continue to see strong results with Pinterest’s Performance+ tools.

Reddit advertising continues to draw more investment from advertisers. Spending on Reddit ads grew 77% year over year, driven by a 3% increase in impressions and 71% increase in CPM. CPM has grown by at least 30% year over year in each of the last three quarters, but the increases haven’t turned advertisers off. Reddit announced AI-powered Max Campaigns in January 2026, mirroring efforts by Meta, Pinterest, TikTok and more to give advertisers AI-powered tools that aid in campaign management and optimization.

Snapchat spending dips for the second straight quarter on weaker CPM. Average CPM on Snapchat rose 27% year over year in Q1 2025 but fell 27% one year later as advertisers
saw negative CPM growth for the second straight quarter. Spending also fell, dropping by 8% in Q1 after a 4% decline in Q4. One newer source of inventory for advertisers has been Sponsored Snaps, which were announced in October 2024 and allow brands to send Snaps that appear in the Chat tab. New placements can influence pricing and volume trends over time.

TikTok continues to account for meaningful social spending for active advertisers. While many TikTok advertisers pulled back in early 2025, that trend is reversing and the platform continues
to account for significant ad investment relative to Meta. Advertisers active on both platforms spent 24% as much on TikTok as on Meta in Q1. Reddit, Snapchat, and Pinterest all accounted for at least 13% as much ad spend as Meta for brands active on each platform, though the number of advertisers on these platforms is much smaller than TikTok.

Paid Search: Google and Microsoft

Google search ad click growth at a five-year high as Amazon remains out of most shopping auctions. Spending on Google search ads grew 14% year over year in Q1 2026, up from 13% growth a quarter earlier. Google paid search click growth remained elevated in Q1 2026, rising to 14% year over year, while average CPC growth was once again flat. Now at a five-year high, Google search ad click growth has been bolstered by Amazon withdrawing from nearly all US Google shopping ad auctions in early Q3 2025. At the same time, Amazon’s lower presence in Google auctions has helped keep CPC growth down.

Microsoft search spending growth slows as advertisers face higher CPCs. Microsoft search ad spending grew 7% year over year in Q1 2026, down from 16% growth a quarter earlier.
Average CPC growth for Microsoft paid search ads shot up from 5% in Q4 2025 to 12% in Q1 2026, while click growth slowed from 10% in Q4 to a 5% decline in Q1. Microsoft advertisers were facing stronger year ago volume comps in Q1 in addition to higher click costs. Importantly, Amazon has remained active in Microsoft shopping listings even as it has exited US Google shopping listings.

Google shopping ad click growth rises to 18% year over year with CPC running flat. Spending on Google shopping ad listings was up 18% year over year in Q1 2026, up from 16% in Q4. Average CPC was flat year over year while click growth accelerated a point to 18%. Click growth for US Google shopping ads jumped in Q2 2025 as Temu and Shein paused their listings in the face of much stricter tariffs, and even though both returned to Google shopping by mid-Q3 2025, click growth has remained elevated after Amazon dropped out of auctions in July 2025.

Largest competitors don’t see dramatic impression share lift after Amazon exit from Google shopping. After Amazon dropped out of nearly all US Google shopping ad auctions in July 2025, its absence was not filled by any single competitor in the market. Target’s share of Google shopping impressions increased the most from early Q3 through the height of the Q4 2025 holiday shopping season, but that share has since returned roughly to where it was prior to Amazon’s withdrawal. Walmart’s impression share has also seen its ups and downs since mid-Q3, but Walmart has also not filled the singular role previously held by Amazon.

Amazon extends absence from Google shopping listing to over eight months. Although Amazon appears to be running some limited US Google shopping listings for its Amazon Pharmacy arm, as of the end of Q1 2026, it has effectively been absent from US Google shopping auctions for over eight months. Amazon’s previous longest absence from Google’s listings was for about three months during the early months of the pandemic in 2020. To the extent that Amazon’s current play is a defensive move over sharing data that may benefit Google’s AI models, it’s notable that Google’s AI Mode and AI overviews are both powered by Google’s main Googlebot crawler and Amazon remains a frequent citation in both.

Performance Max share of Google shopping spending and sales ticks up to start 2026. For advertisers running both Performance Max (PMax) and standard Google Shopping campaigns in Q1 2026, PMax campaigns accounted for 67% of total spending on Google shopping ad inventory while producing 68% of the sales those listings generated. Prior to this past quarter, advertisers have tended to generate a slightly lower return on ad spend (ROAS) for PMax campaigns, but that gap narrowed over 2025 with PMax taking a slight advantage to start 2026.

Video and non-shopping search and display generate 41% of PMax spending in Q1. Video inventory accounted for 6% of Google Performance Max spending in Q1 2026. That was down a point from Q4 2025, but still up three points from Q1 2025. Non-shopping search and display inventory saw stronger movement both quarter to quarter and year over year, with a combined spend share hitting an average of 35% in Q1 2026, compared to 30% in Q4 and 26% in Q1 2025.

Relative drop in CPC for PMax leads to favorable ROAS comp to standard Google Shopping ads. Relative to standard Google Shopping campaigns, PMax sales per click has trended lower since early 2025 as a larger share of PMax spending has been generated by non-shopping inventory. That decline has been softened, however, by a larger relative drop in average CPC for PMax, ultimately leading to an improved ROAS for PMax compared to standard Google Shopping ads over time.

Including YouTube, Google O&O properties producing larger share of PMax placements over time. Across the segment of Google Performance Max impressions generated outside of Google search, YouTube video accounted for 12% of total impressions in Q1 2026. While that was down a point from Q4, it marked an eight-point increase from a year earlier. Over time, a smaller share of PMax placement impressions have been produced outside of Google owned and operated properties, whether on non-Google webpages or on mobile apps.

Strong click growth continues to drive Google text ad spending. While Amazon has remained active in Google text ad auctions, its absence from US Google shopping listings since Q3 2025 is likely providing some benefit to text ad click growth as well given that text and shopping listings frequently serve on the same results pages. Google text ad click growth shot up from a 3% decline in Q2 2025 to a 6% increase in Q3 2025 and that acceleration has continued into 2026 with clicks up 11% year over year in Q1. With CPC rising 1% in Q1, text ad spending growth was 13%.

Advertiser brand keyword CPCs decline 9% year over year on Google. After brand keyword CPCs jumped nearly 20% year over year on average in Q1 2025, Google advertisers have been able to rein in their click costs with brand CPC growth decelerating each of the last four quarters. Against the strong Q1 2025 comp, brand CPCs fell 9% year over year in Q1 2026. CPC trends for non-brand text ads have been steadier over the past year, with some oscillation in the low single-digits.

Stronger impression growth is outweighing click-through rate declines for Google text ads.
Although the average click-through rate for Google text ads is running down considerably since early 2024 across multiple segments, text ad click growth and spending is firmly in positive territory due to significant increases in impressions. For its part, Google has stated that its AI Mode and Overviews have driven query growth, including for commercial queries.

Commerce Media: Amazon and Walmart

Amazon Sponsored Products spending stays above 20% on elevated click growth. Clicks on Amazon’s flagship search ad format Sponsored Products rose by at least 19% for the fourth straight quarter. Average CPC for the format rose 2%, the first increase since Q1 2025, as advertisers ultimately spent 21% more in Q1 2026 compared to Q1 2025. Growth in the sales attributed to Sponsored Products was close behind at 18%, as return on ad spend held roughly stable year over year.

Amazon Sponsored Brands spending ticks up slightly in the first quarter. Advertisers increased Sponsored Brands spending by 3% year over year in Q1 2026, a slight acceleration from 2% growth in Q4 and the third straight quarter of low single-digit growth. Clicks declined 10% year over year, while cost per click rose 14%. Some Amazon advertisers are actively diverting ad investment away from Sponsored Brands in favor of Sponsored Products due to performance.

Amazon Sponsored Display spend once again declines year over year. While vendors and sellers continue to lean into the Amazon demand-side platform (DSP), interest and investment in Amazon’s other display offering, Sponsored Display, continues to wane. Sponsored Display spending declined 34% year over year, the fourth straight quarter of double-digit declines, as clicks rose 29% and CPC fell 49%.

Participating advertisers are spending nearly as much on the Amazon DSP as the Ad Console.
Advertisers investing in both Amazon Ad Console ads and the Amazon DSP spent 43% of total Amazon budgets on the DSP in Q1 2026, up from 40% in Q4 2025 and 39% in the quarter prior to that. With strong targeting and measurement capabilities, the Amazon DSP is becoming increasingly popular for advertisers, including both those that sell products on Amazon and non-endemic advertisers that do not.

Amazon DSP spending grows at the fastest rate since Q3 2021. With brands increasingly turning to the Amazon DSP for its targeting and measurement capabilities as well as access to premium inventory that isn’t available elsewhere, spending on the platform rose 41% year over year in Q1 2026, the fastest growth in nearly half a decade for Tinuiti advertisers. Impressions
jumped 14%, while pricing rose 24% as brands lapped a weak year-ago comparison. CPM fell 31% year over year back in Q1 2025.

Walmart Sponsored Products spending jumps 62% year over year on massive click growth.
Clicks on Walmart Sponsored Products rose 57% year over year in the first quarter, the strongest growth since Q1 2023 for Tinuiti advertisers, as spend rose 62%. CPC increased just 3%, and pricing has remained roughly stable over the last two quarters after nine straight quarters of double-digit year-over-year growth. At 19%, sales per click growth far exceeded CPC growth as many advertisers saw stronger return on ad spend than last year.

Advertisers continue to wield all of Walmart’s search campaign types to reach shoppers. While the lion’s share of Walmart spend is attributed to Sponsored Products, 6% goes to Sponsored Videos and 5% goes to Sponsored Brands for brands targeting all three campaign types. These splits are roughly equivalent to what was observed in Q4, and most Walmart advertisers are now spending on all three campaign types to some extent.

Walmart display campaigns continue to grow in importance for advertisers. Display advertising grew to 39% of all Walmart advertising spending in Q1 2026 for advertisers targeting both display and search placements, up from 35% in Q4 and 34% back in Q3 of last year. Display’s 39% share isn’t far behind the 43% of all Amazon spend that goes to the Amazon DSP for participating advertisers, as marketers are increasingly investing in display advertising through commerce platforms.

Walmart display advertisers are leaning into both onsite and offsite inventory. Fully 61% of all Walmart display spending was targeted to onsite inventory in the first quarter, compared to 39% attributed to offsite inventory. This is a reversal of the shares these inventory sources accounted for in Q4 2025, when offsite inventory accounted for 60% of spend. Onsite inventory comes at a much higher CPM, as the 61% of spend these placements accounted for came on just 37% of all Walmart display impressions.

Video and Display: YouTube, Prime Video, Netflix, GDN, and More

YouTube ad spending is up 20% despite a large decline in average CPM. Spending on YouTube ad inventory was up 20% year over year in Q1 2026, up from 13% growth a quarter earlier. YouTube impression growth accelerated from 38% in Q4 to 52% in Q1. Average CPM remained in decline, falling 21% year over year in Q1 compared to an 18% decline a quarter earlier. Official YouTube growth was relatively weak in Q4 2025 due to comping against strong US election spending a year earlier.

YouTube video ad campaigns see TV screens produce 72% of advertiser investment. Across all campaign types, including a significant contribution from direct-response focused Demand Gen campaigns, TV screens accounted 41% of spending on YouTube inventory in Q1 2026, with phones accounting for just under half of spending. For video campaigns alone, however, TV screens dominate YouTube ad spending, accounting for 72% of total investment, compared to just 14% for phones.

Shorts ads are second largest ad format for YouTube video ad campaigns. Shorts ads accounted for 18% of spending on YouTube video ad campaigns in Q1 2026, while skippable in-stream ads continued to generate the largest share of YouTube video spending at 63%. Shorts ads produced a slightly smaller share, 14%, of YouTube ad spending purchased through Demand Gen campaigns. TV screens produced 58% of Shorts ad spending through YouTube video campaigns, compared to 72% across all ad formats.

Video share of Google Demand Gen spending plateaus around 65%. Video ad inventory accounted for an average of 65% of spending on Google Demand Gen campaigns in Q1 2026, which was roughly on par with the previous quarter. While video share of Demand Gen spending has plateaued in recent months, it shot up sharply over the first half of 2025. In April 2025, Google removed the ability to create new Video Action Campaigns, while in July 2025, it began transitioning Video Action Campaigns to the Demand Gen model automatically.

Google Demand Gen campaign adoption rates hit new high to close out Q1 2026. Google’s transition of Video Action Campaigns to Demand Gen campaigns has helped spur increased adoption of the Demand Gen model, which itself absorbed Google Discovery campaigns beginning in late 2023. Demand Gen adoption rates jumped in Q4 2024 ahead of the Video Action Campaign transition, peaked again in Q4 2025, and hit a new all-time high to close out Q1 2026.

Same-site spending growth for Google Demand Gen campaigns remains robust at 22%. For advertisers that were active on Google Demand Gen campaigns in both Q1 2025 and Q1 2026, Demand Gen delivered a 59% increase in impressions year over year, an acceleration from 40% growth in Q4 2025. Average CPM fell 23% in Q1, however, with spending coming in 22% higher, a slight deceleration from Q4. While brands didn’t see much movement in the spend share of different Demand Gen formats between Q4 and Q1 on average, some advertisers did see an uptick in impression share for image ads.

Advertiser spending on Google Display Network inventory rises 10% year over year. Spending on Google Display Network (GDN) inventory across multiple campaign types, but primarily display, Demand Gen, and App campaigns, was up 10% year over year in Q1 2026, an acceleration from 6% growth a quarter earlier. GDN impressions fell 22% year over year, though, while average CPM was up sharply at 41% growth year over year.

With CPM down 2%, streaming video ad spending slows to 6% year over year. Spending on streaming video ads outside of YouTube was up 6% year over year in Q1 2026, down from 13%
growth a quarter earlier. The launch of Prime Video ads in early 2024 provided a shot in the arm to streaming spending growth rates over 2024 into early 2025, but growth rates have cooled off in comparison over recent quarters. In Q1 2026, streaming video ad impressions were up 8% year over year, but pricing pressure has continued to keep CPM growth in low single-digit decline.

Amazon Prime Video ad spending dips slightly from quarter to quarter. Spending on Amazon Prime Video ads, across both new and existing advertisers, was down a little under 3% from Q4 2025 to Q1 2026. In year over year terms, Prime Video ad spending was up an impressive 71% in Q1 2026, but that was down from 127% growth a quarter earlier. In Q1 2025, Prime Video spending was 968% higher year over year, making it a significant contributor to overall streaming ad spending growth.

After relative CPM decline for Prime Video, Netflix enjoys pricing lead across top streamers.
After spiking during the Q4 holiday shopping season, average CPM for Prime Video ads relative to other traditional streamers dipped roughly 18% from quarter to quarter in Q1, putting it closer in line to its level throughout the first three quarters of 2025. Netflix maintained a 141% advantage over the streaming CPM average in Q1, while both HBO Max and Disney+ saw relative drops closer in scale to Prime Video.

TV screens see small ad spend share gains across streaming video services. Across streaming video ad services excluding YouTube, TV screens accounted for 67% of advertiser spending in Q1 2026, up from 64% a year earlier. Those share gains came at the expense of phones and tablets, which saw their share of spend fall from 27% to 24% over the same period. While streaming video ad spending was up 6% year over year across all devices in Q1, it was 11% higher on TVs.

Want more stats?

Check out our most recent Digital Ads Benchmark Report for more exclusive insights.

The Complete Digital Ads Benchmark Vault

*By submitting your Email Address, you are agreeing to all conditions of our Privacy Policy.

digital ads benchmark report cover