Digital Ads Benchmark Report Q4 2025
Quarterly Trends Across Google, Meta, Amazon, And More
Quarterly Trends Across Google, Meta, Amazon, And More
The Tinuiti Digital Ads Benchmark Report is based on anonymized performance data from advertising programs under Tinuiti management, with annual digital ad spend under management totaling over $4 billion. Samples are restricted to those programs that have remained active and maintained a consistent strategy over the time periods studied. Unless otherwise noted, all figures are based on same-client growth. The trends and figures included are not meant to represent the official performance of any advertising platform or the experiences of every advertiser.
Note: The data below is from Q4 2025. Head here to see our most recent report.
Tinuiti is the largest independent performance marketing firm across Streaming TV and the Triopoly of Google, Facebook, and Amazon, with $4 billion in digital media under management and over 1,000 employees.
The major digital ad platforms in the US saw mixed spending growth trends in Q4 2025 with Google search, YouTube, and Amazon Sponsored Products seeing an acceleration in ad spending growth while Facebook and Instagram saw positive, but weaker growth than in Q3. Both Facebook and Instagram faced stronger year-ago spending growth comparisons in Q4, while the other three platforms faced weakening comps to varying degrees.
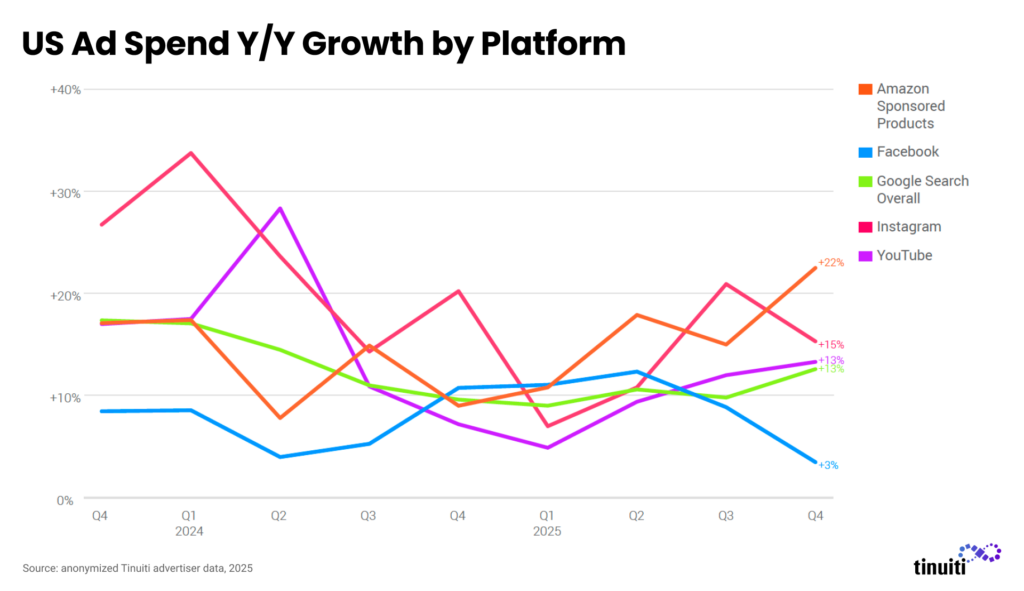
The relatively strong performance of Google search ads and Amazon Sponsored Products came during the first full quarter since Amazon stopped running nearly all US paid shopping listings with Google in July. With paid clicks on Amazon Sponsored Products running 22% higher year over year, it raises the question of whether more users are simply searching on Amazon directly rather than navigating to Amazon through Google shopping links.
At the same time, with Amazon out of the US Google shopping ad picture, Google’s remaining advertisers have seen some of the strongest click growth rates from Google search ads in years, on both shopping and traditional text ads. While Target was more prominent in Google shopping auctions during the holiday shopping season, no single advertiser has come close to filling Amazon’s former position in Google’s paid shopping listings.
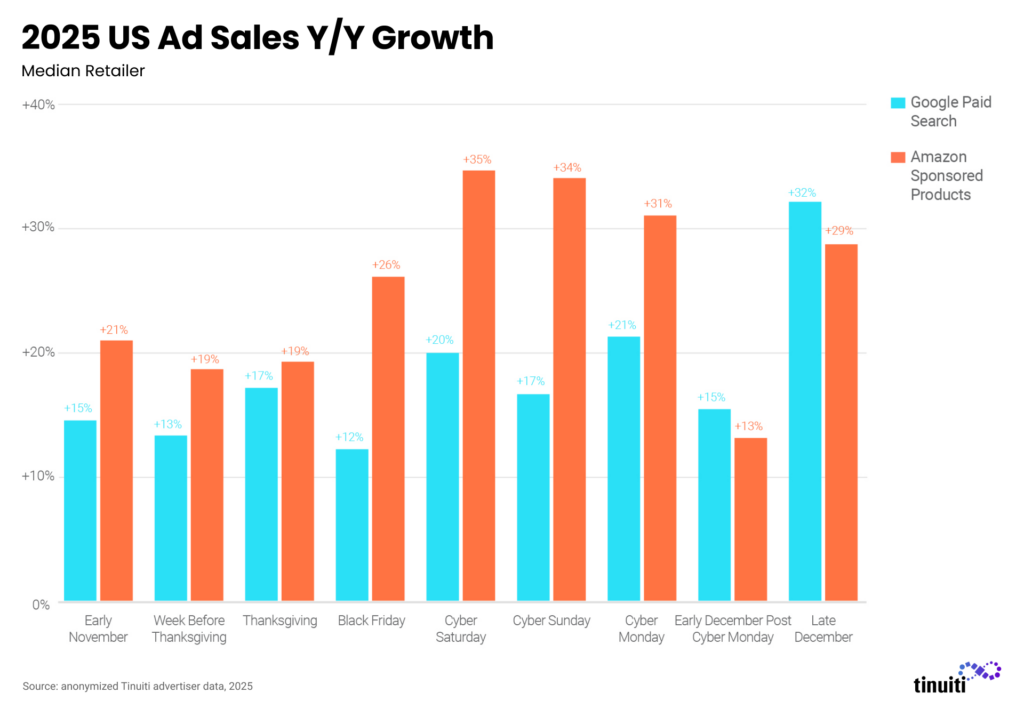
Comparing retailer sales generated by digital ads during the holiday shopping season, Amazon Sponsored Products did see stronger growth than Google paid search for most of the key time periods during Q4, but the median retailer saw strong results from both over the back half of the quarter.
In 2024, the typical brand saw stronger sales growth from Google paid search ads than Amazon Sponsored Products during most key periods, so the 2025 results were a bit of a rebound for Amazon.
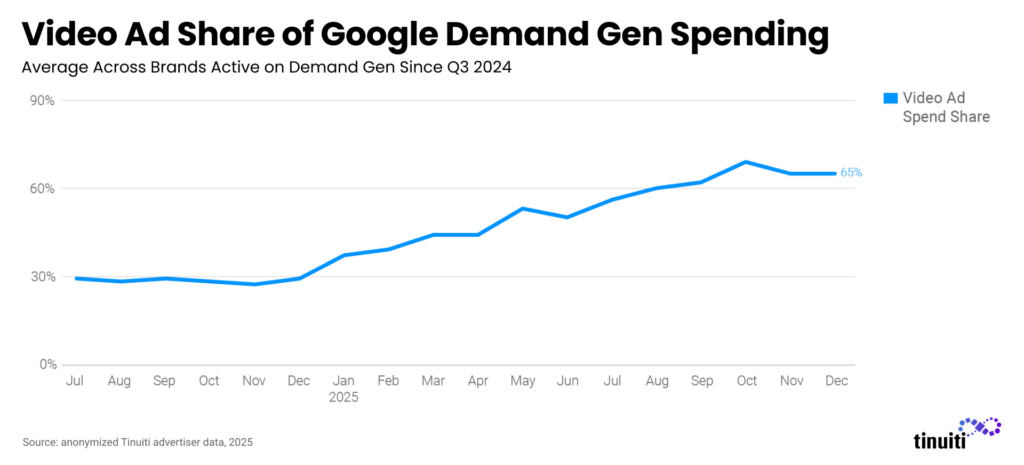
YouTube was also a critical promotional channel during Q4 with many retailers now spending a majority of their YouTube ad dollars through Google Demand Gen campaigns following Google’s July transition of Video Action Campaigns to the Demand Gen model. Video accounted for 66% of Demand Gen spending in Q4 2025, up from just 28% a year earlier.
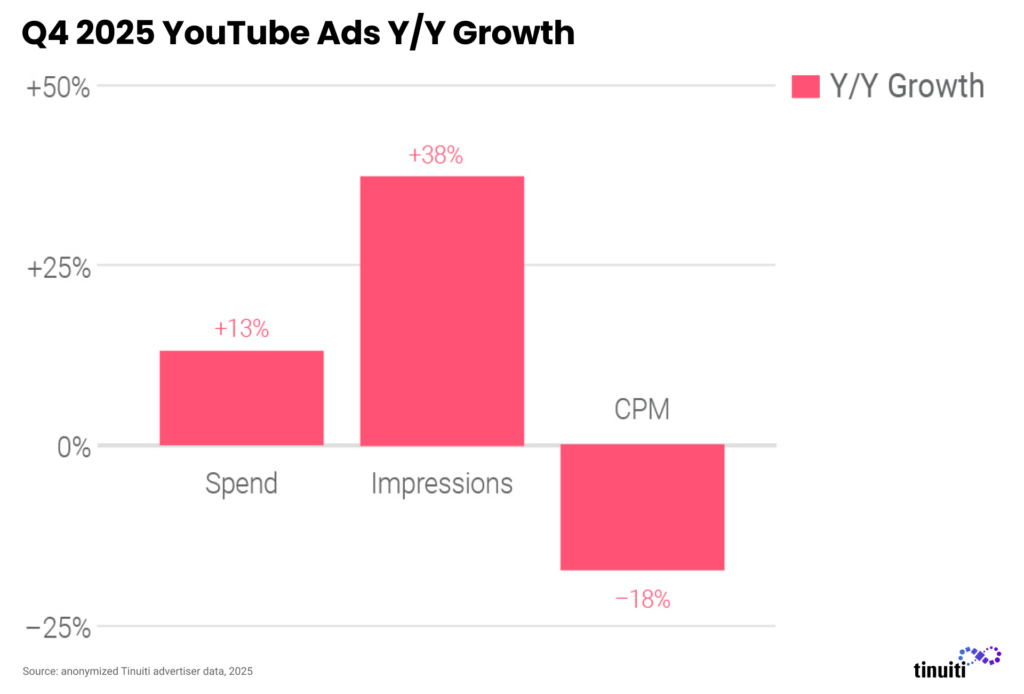
Across verticals, YouTube spending was up 13% year over year in Q4, which was the same rate of growth for streaming video ad spending outside of YouTube. Within this sphere, Amazon’s Prime Video remained a large contributor to spending growth rates, having seen total spending grow 31% from Q3 to Q4 2025. While YouTube CPMs fell 18% year over year, other streaming video ads saw a smaller decline in CPMs of 1%.
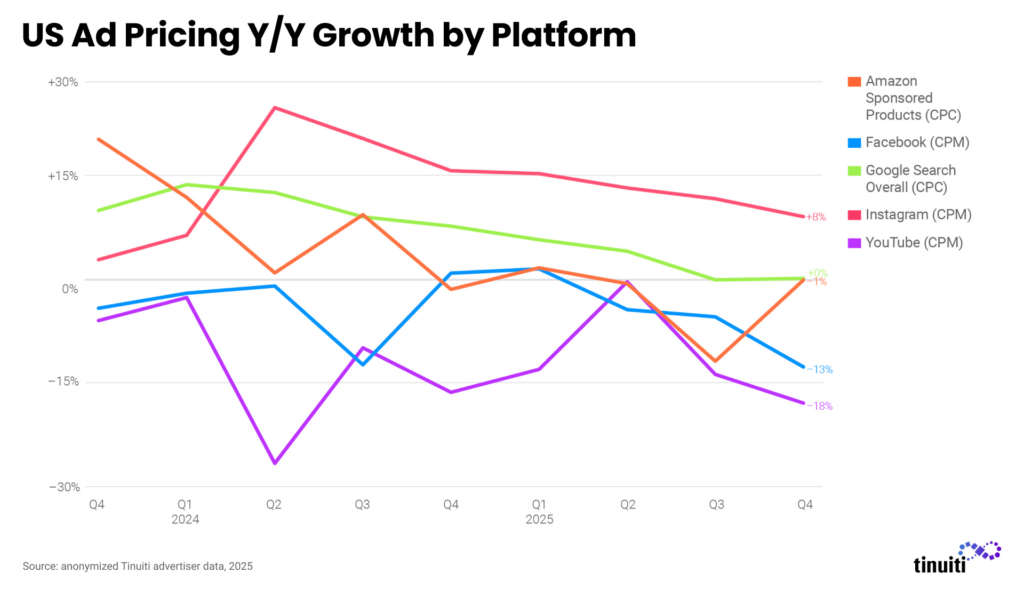
Meta also saw CPMs fall in Q4 with an overall decline of 7% year over year, and a 13% decline for Facebook specifically. Although Instagram CPMs rose 8% year over year in Q4, that marked the slowest CPM growth rate for Instagram since Q1 2024. Both Facebook and Instagram have faced downward pressure on overall CPMs as new inventory sources with lower CPMs such as Reels have risen in importance.
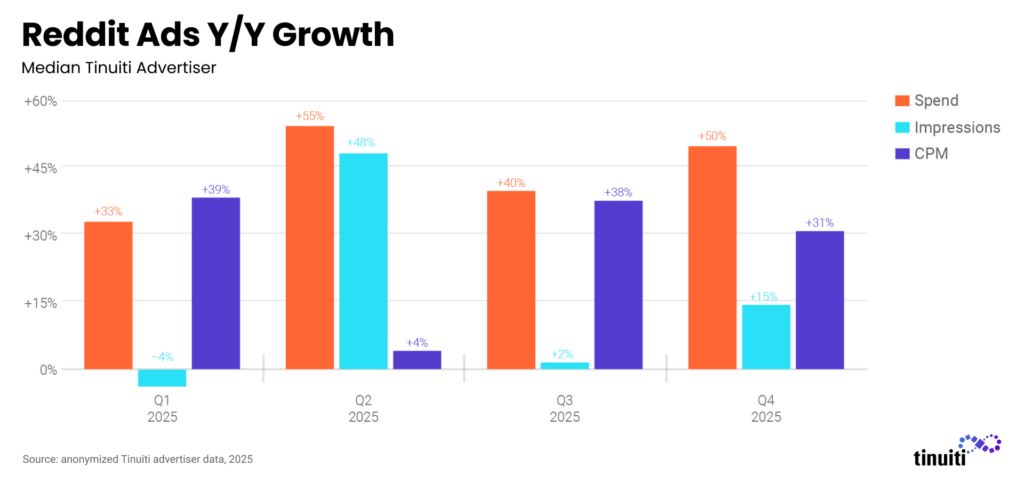
Among the next tier of platforms, Reddit has seen some of the strongest same-site spending growth rates in recent quarters with advertiser investment up 50% year over year in Q4. Pinterest was close behind at 37% spending growth, while TikTok returned to positive growth after uncertainty around its future led to a turbulent start to the year.
Reddit, Pinterest, and TikTok all have AI-powered tools or campaign types live or in the works, following the lead of Google and Meta, which have seen their AI-powered campaigns play a critical role in recent years. Google’s Performance Max campaigns accounted for 62% of retailer spending on Google shopping ad listings in Q4, while Meta’s Advantage+ sales campaigns drove 27% of retail spend on Meta in the quarter.
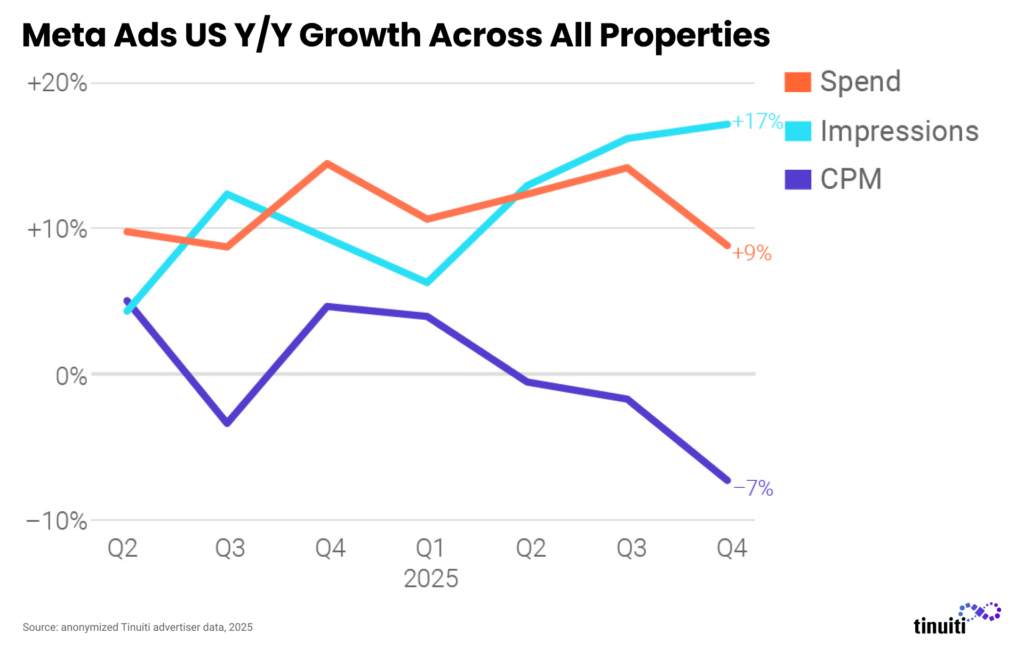
Ad impressions on Meta properties rose 17% year over year in the fourth quarter, an acceleration from 16% growth in Q3 2025 and the fastest growth in the last nine quarters. CPM fell 7% year over year, the second straight quarter of decline, as new inventory sources with lower CPM such as Reels continue to grow in importance. Spend growth slowed from 14% to 9% on tougher year-ago comparisons as two-year growth held roughly steady.
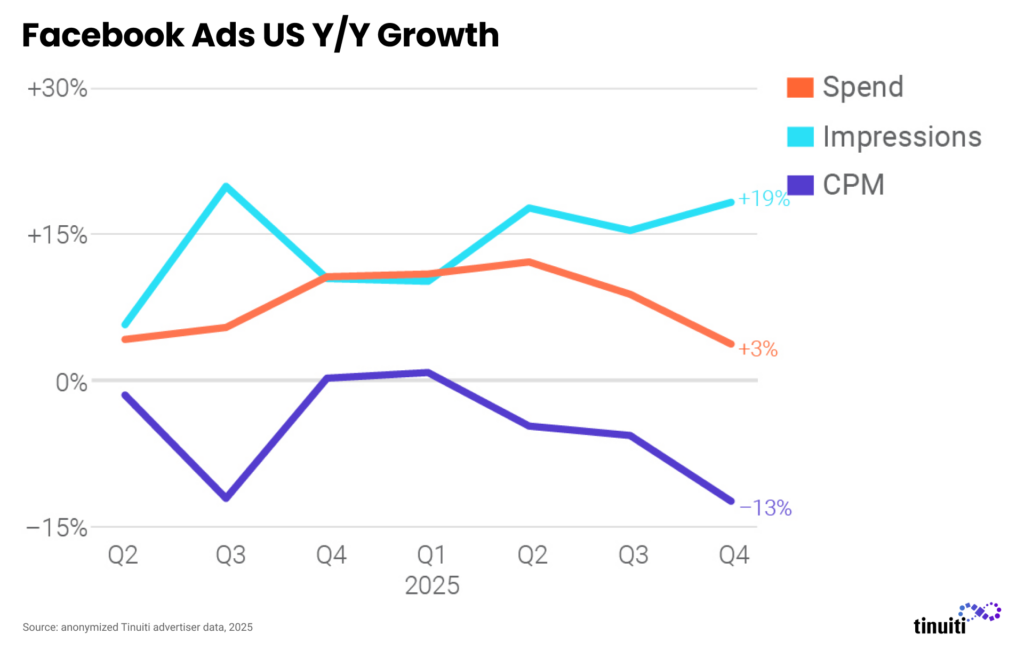
Spend on Facebook ads rose 3% year over year in Q4 2025, down from 9% growth in Q3. This was largely due to tougher year-ago comparisons, as spend growth accelerated from 5% in Q3 2024 to 11% in Q4 2024. Impression growth remained strong on Meta’s flagship app and rose 19% year over year, the biggest increase since Q3 2024. CPM declined 13% in aggregate, but 44% of advertisers studied saw CPM rise year over year as pricing growth varies significantly by brand.
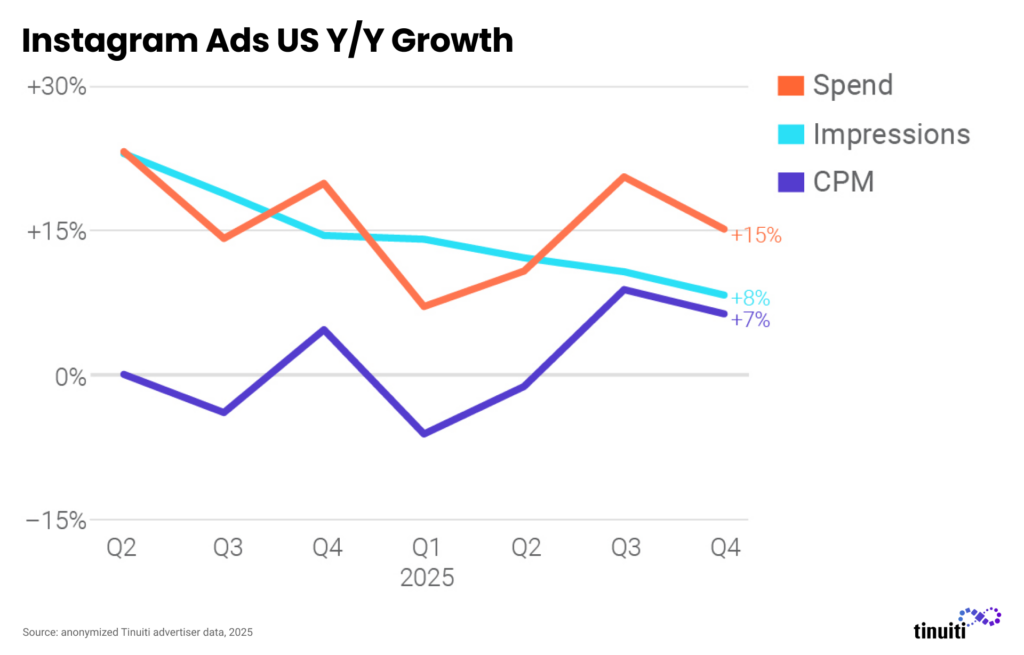
While Facebook CPM has regularly been flat to down over the last couple of years, CPM on Instagram has risen sharply over the same time frame. CPM growth finally fell below 10% in the fourth quarter for the first time since Q1 2024, in part due to the continued growth of Reels inventory on Instagram. Impression growth rebounded from a 6% decline in the first quarter of the year to 7% growth in Q4.
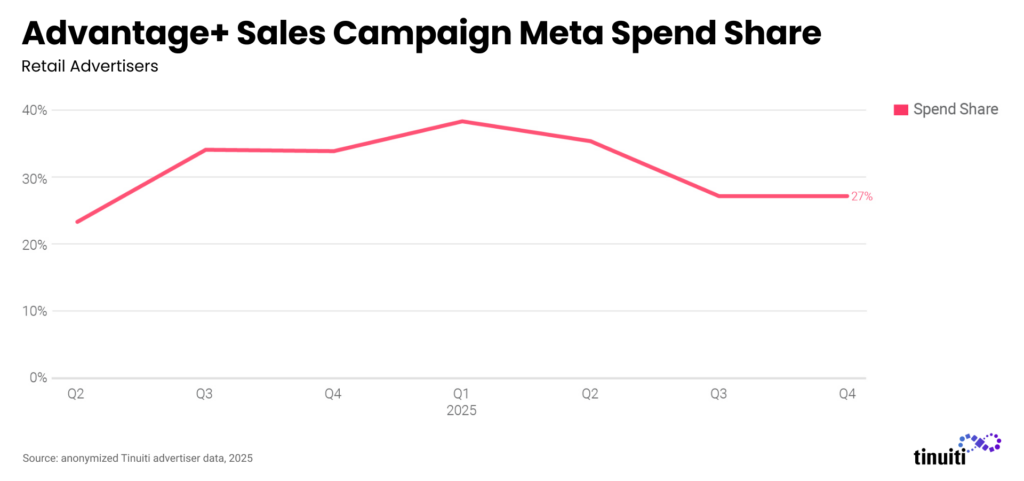
While the share of retail Meta spend attributed to Advantage+ sales campaigns, formerly known as Advantage+ shopping campaigns, is down from the 38% share observed in Q1 2025, these AI-powered campaigns are still playing a crucial role for most retail advertisers. Fully 27% of retail spend on Meta went to ASC in the fourth quarter, matching the share observed in Q3.
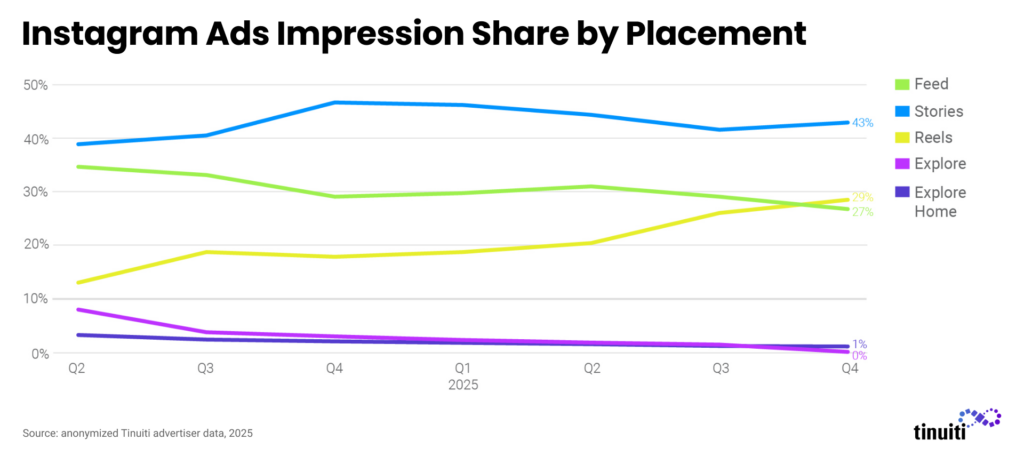
The share of Instagram ad impressions coming from Reels video ads hit 29% in the fourth quarter, up from 26% in Q3 and 18% back in Q4 2024. Stories ad impression share rose from 41% in Q3 to 43% in Q4, as the share of Instagram ad impressions from Feed placements declined to an all-time low of 27% in the fourth quarter and dipped below Reels impression share for the first time ever.
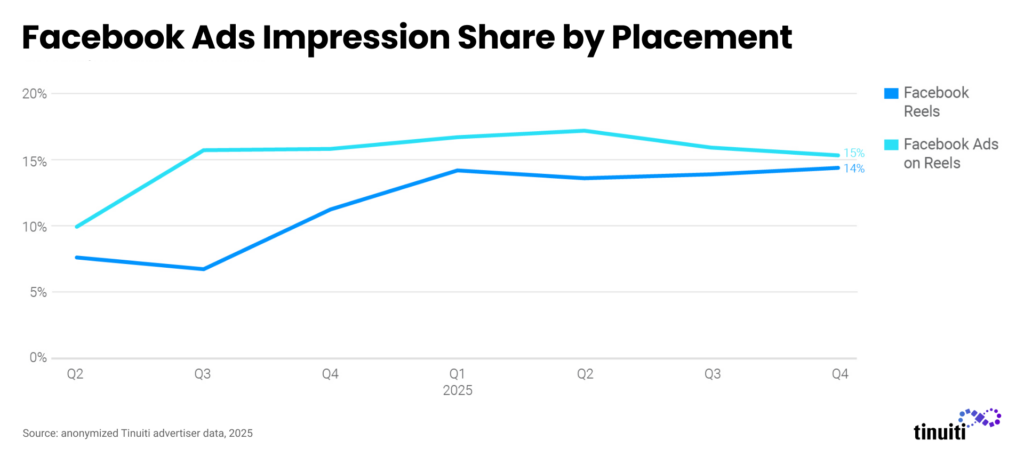
The share of Facebook ad impressions attributed to Reels video ads rose from 7% in Q3 2024 to 14% in Q3 2025. Ads on Reels, formerly known as Reels Overlay ads, accounted for 16% of impressions in Q4 2025, the same share observed a year earlier. Given the significance of Ads on Reels on Facebook, it remains unclear why these banner ads featured on top of Reels videos have not been similarly rolled out on Instagram.
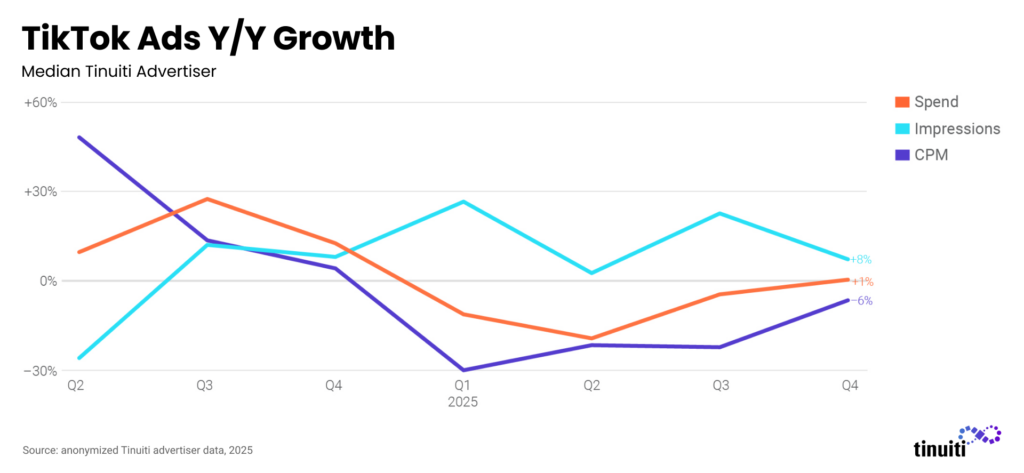
TikTok advertisers were nervous about the future of the platform in the US in the early months of 2025, forcing many to diversify social investment in case it ultimately went dark. Advertisers were more confident in TikTok’s US future by the fourth quarter, and spend on the platform rose 1% year over year for the median advertiser, up from a 4% decline in Q3. CPM growth is starting to recover as advertisers grow ad spend, with pricing down only 6% in Q4 compared to a 22% decline in Q3.
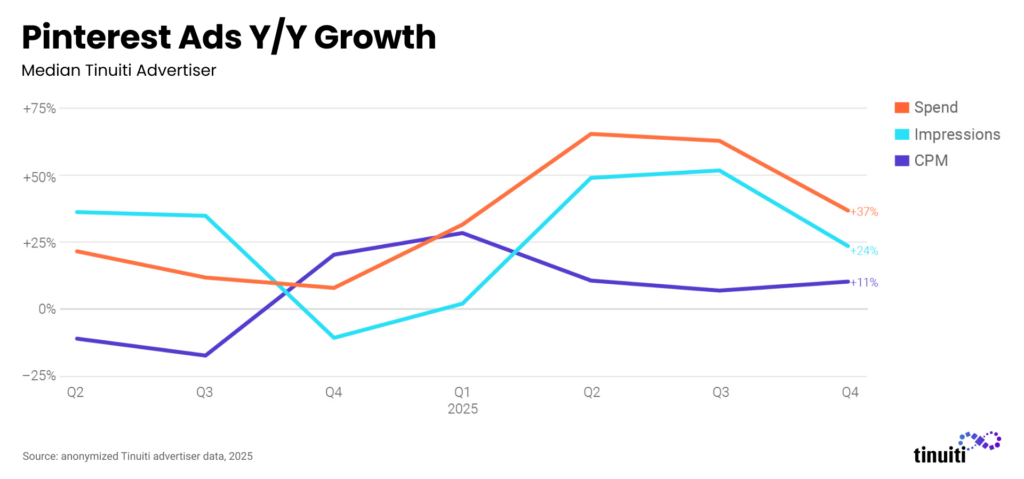
Pinterest spend jumped 37% year over year in the fourth quarter, driven by a 24% increase in impressions and an 11% increase in CPM. Both pricing and impressions grew year over year in every quarter of 2025, as quarterly spend rose by at least 32% year over year throughout the year. Pinterest’s AI-powered Performance+ tools continue to help advertisers grow investment in the platform over time.
Same-store advertisers increased Reddit spend 50% year over year in the fourth quarter, an acceleration from 40% growth in Q3. Reddit has become increasingly important to brands for both its incremental reach with audiences that may not be active on other social platforms as well as its frequent inclusion in AI citations. Reddit announced AI-powered Max Campaigns in January 2025, which will likely help advertisers continue to grow investment moving forward.
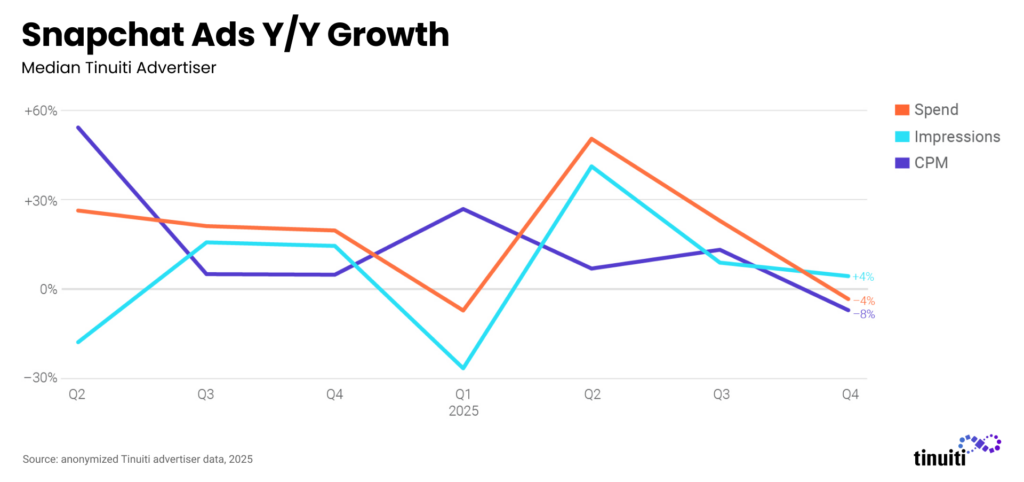
CPM declined year over year for the first time in seven quarters for the median Snapchat advertiser active on the platform since last Q4, pulling ad spend growth down from a 23% increase in Q3 to a 4% decline in Q4. Impressions rose year over year for the third straight quarter with a 4% increase. One newer source of inventory for advertisers has been Sponsored Snaps, which were announced in October 2024 and allow brands to send Snaps that appear in the Chat tab.
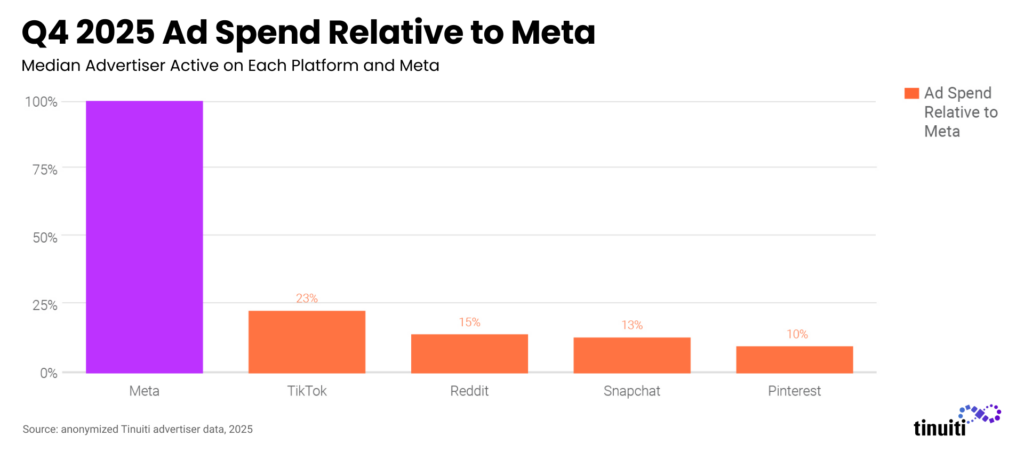
Meta is still the largest recipient of social media ad dollars, though the definition of what makes a platform social media is up for debate. Advertisers are still leaning heavily into other platforms, however, with TikTok leading that pack with 23% as much ad spend as Meta for advertisers active on both. Reddit is quickly growing in importance, surging to 15% as much spend as Meta for advertisers active on both, though the number of advertisers active on Reddit is currently much lower than TikTok.
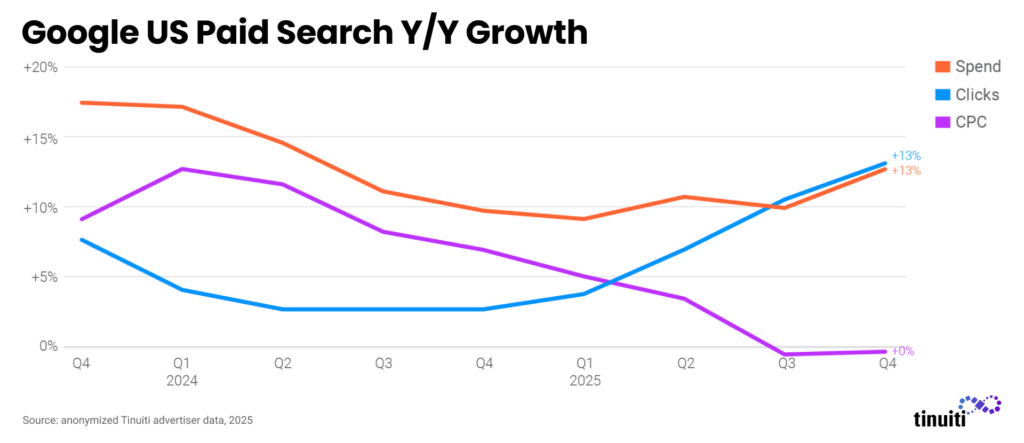
Spending on Google search ads was up 13% year over year in Q4 2025, up from 10% growth a quarter earlier. With Amazon remaining out of nearly all US Google shopping auctions —after having dropped out in July — Google click growth hit 13% year over year for Tinuiti advertisers in Q4, the strongest rate of growth since early 2021. Google search pricing growth remained weak, however, with average CPC falling slightly year over year for the second quarter in a row. Google has also noted that its AI results have driven growth in overall query volume, including commercial queries.
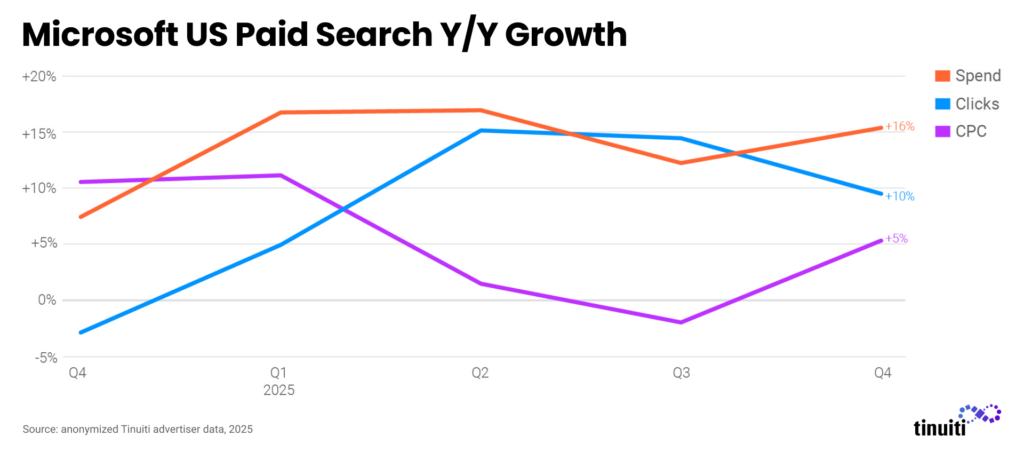
Advertiser investment in Microsoft paid search ads was up 16% year over year in Q4 2025, outpacing Google search spending growth and up from 12% growth a quarter earlier. Microsoft search ad clicks were up 10% in Q4 , down from 15% in Q3, while average CPC was up 5% in Q4, compared to a 2% decline in Q3. Amazon maintained its presence in Microsoft’s shopping ad listings over the back half of 2025 after having dropped out of Google’s.
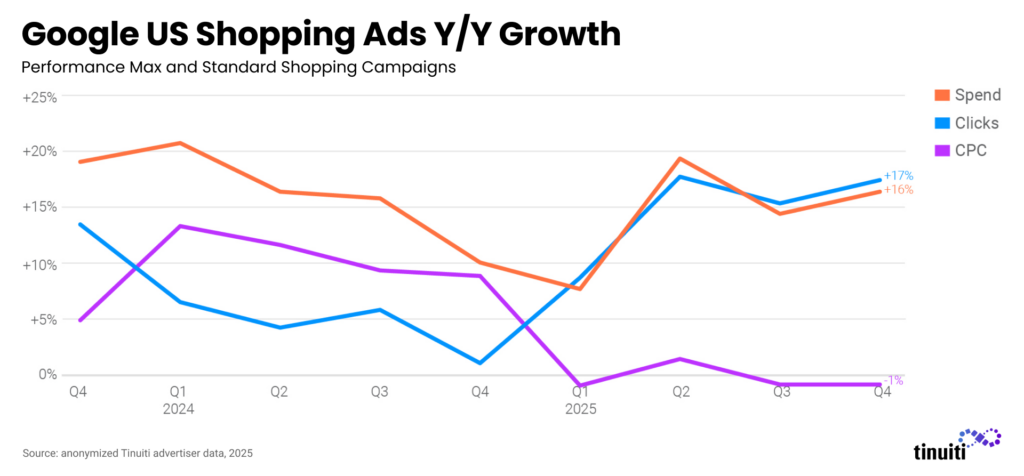
Google shopping ad spending was up 16% year over year in Q4 2025 as click growth for Tinuiti advertisers remained in the upper teens for the third straight quarter. Prior to Amazon exiting US shopping auctions in Q3 2025, Temu and Shein had both paused their listings in Q2 ahead of the expiration of the de minimis tariff exception on Chinese goods. Although Temu and Shein both ultimately returned to shopping auctions, neither was as prominent during Q4 as in years past. Shopping pricing trending remained weak in Q4, with CPC falling 1% year over year.
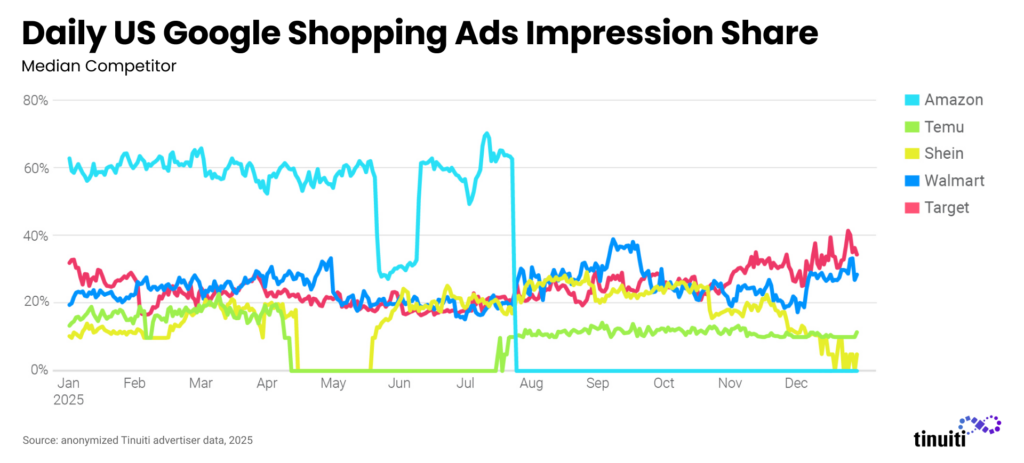
The void left by Amazon in US Google shopping ad auctions has not been filled by any single large retailer, but Target was particularly prominent during the height of Q4 holiday shopping. Walmart’s share of Google shopping impressions was also strong during December, but only after having declined earlier in Q4. Temu’s auction presence was consistent, but minimal during Q4, while Shein appeared to pull back just as holiday purchases were ramping up the most.
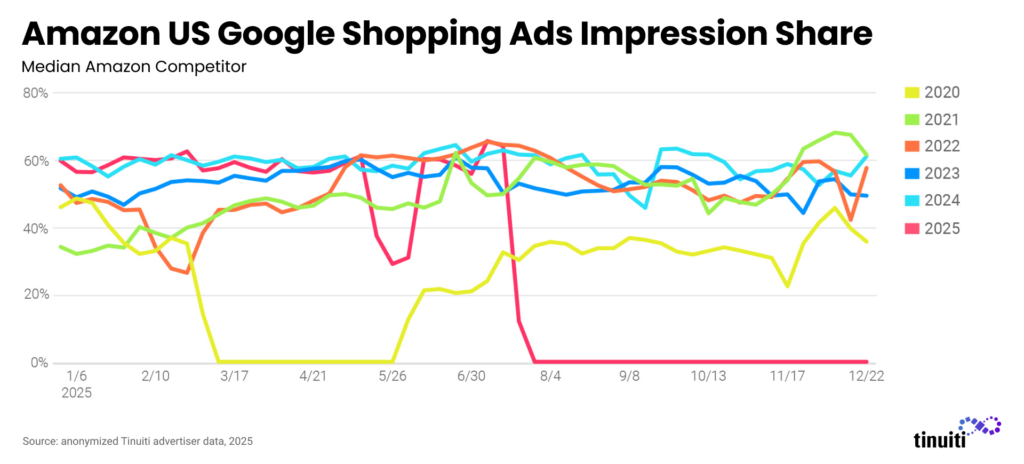
Since it first entered paid Google shopping listings in late 2016, Amazon has stopped running ads only a handful of times. Prior to 2025, Amazon’s longest and most notable break was during the early days of the pandemic in 2020 when it paused its Google shopping ads for 12 weeks. At the end of 2025, Amazon has effectively been out of US shopping listings for nearly twice that long. While Amazon may have multiple motivations for staying out of Google auctions, if anything, revenue growth from its own advertising products has been particularly strong in recent quarters. Also, Amazon has been active in international Google shopping auctions and it has been running limited US Google shopping listings for its Amazon Pharmacy arm.
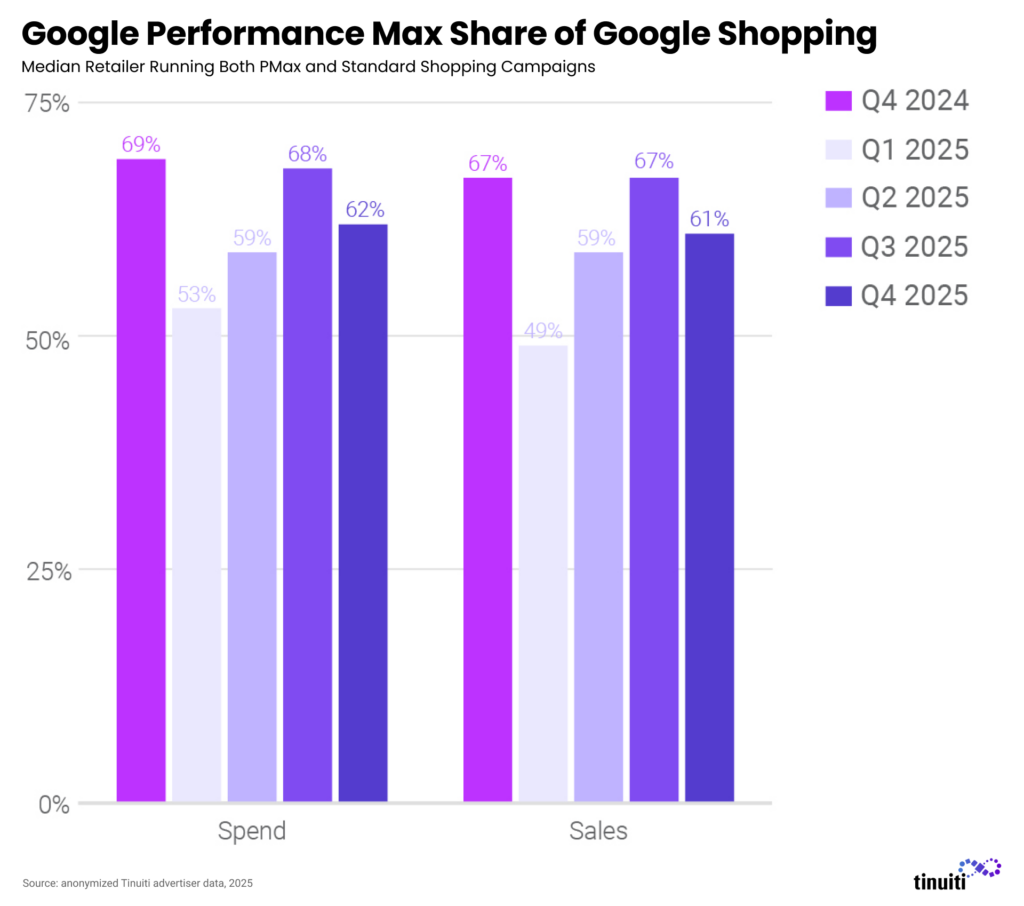
For brands running both Performance Max (PMax) and standard Google Shopping ad campaigns, PMax accounted for 62% of total investment in Google shopping ads in Q4 2025. That rate was down from 69% a year earlier, but up from a low of 53% in Q1 2025. Advertisers have historically tended to accept a slightly lower return on ad spend from PMax than standard Shopping campaigns and that held true in Q4 2025 as PMax generated 61% of Google shopping ad sales.
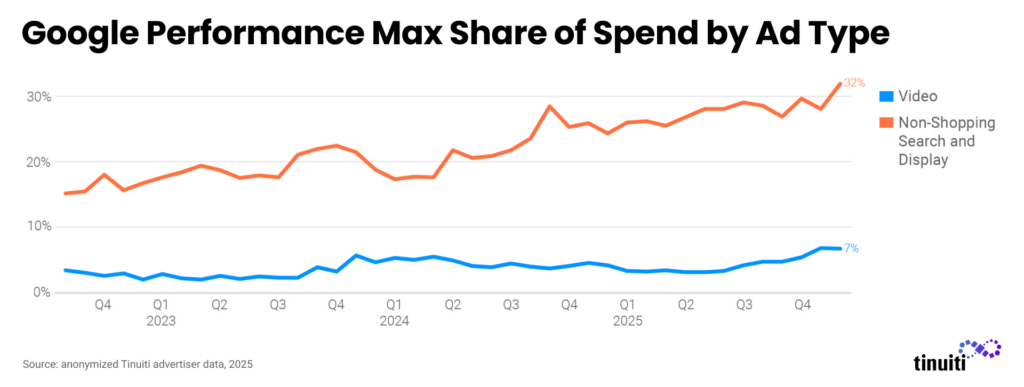
Video and non-shopping search and display inventory combined for 39% of Google Performance Max spending in December 2025, which was up from 29% a year earlier. After running flat to down slightly over 2024 and the first half of 2025, video share of PMax spend saw a four-point increase in the back half of 2025. Text and display ads still account for the lion’s share of non-shopping PMax inventory, though, generating 32% of total PMax spending to close out 2025.
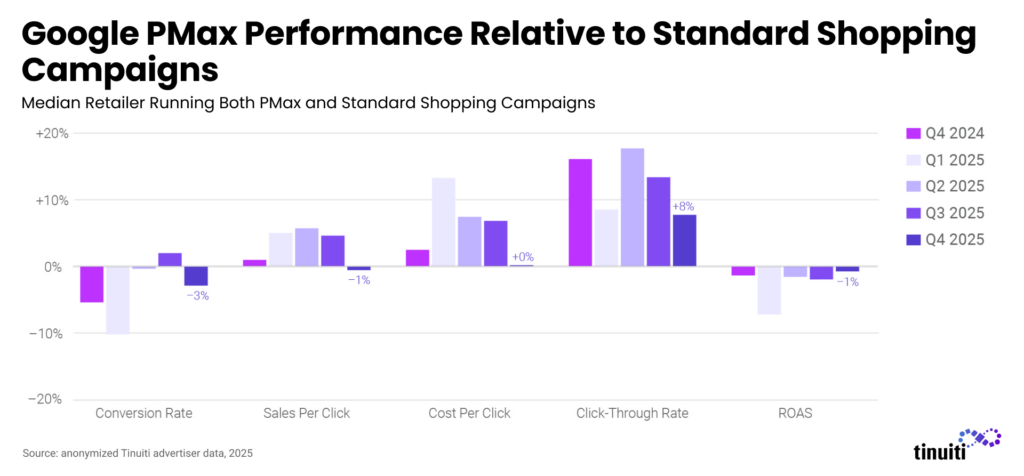
As the inventory mix of Performance Max evolves, advertisers continue to see shifts in key PMax metrics relative to standard Google Shopping campaigns. For brands running both campaign types, PMax conversion rates were 3% lower than standard Shopping conversion rates in Q4, down from a relatively strong showing of a 2% advantage for PMax in Q3. The sales per click advantage for PMax also faltered in Q4, but brands were able to compensate on the cost per click side leading to just a 1% deficit in ROAS for PMax in Q4.
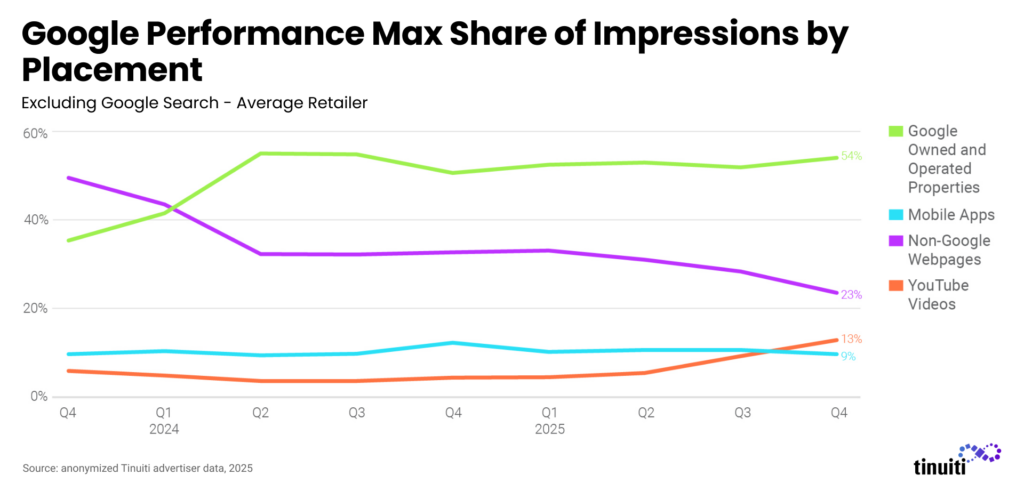
With video generating a larger share of total Performance Max spending in late 2025, it’s not surprising to see YouTube’s share of non-search PMax placement impressions rising quickly as well. YouTube video accounted for 13% of PMax placement impressions in Q4 2025, up from 4% to start the year. Placement impression share for other Google owned and operated properties largely held steady in the low 50s over 2025, while non-Google webpages have seen substantial share declines.
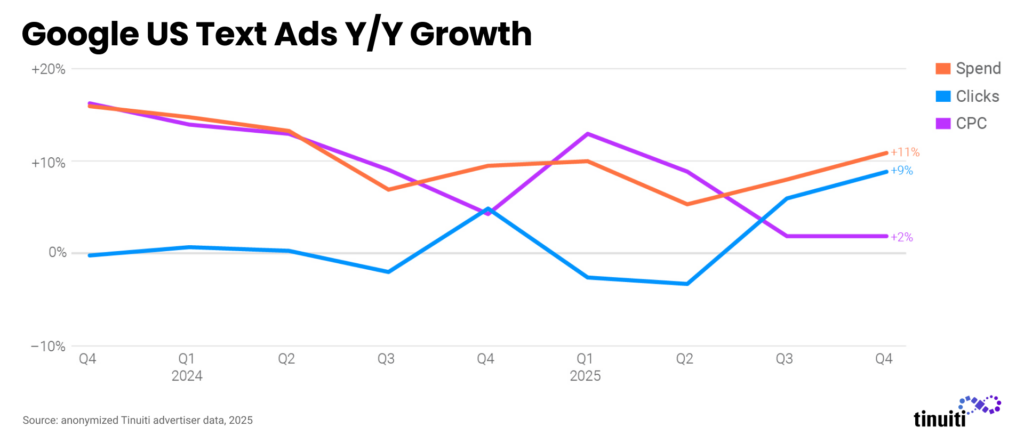
Click growth for Google text search ads hit a 19-quarter high of 9% year over year, up from 6% growth a quarter earlier. While Amazon remains in Google’s US text ad auctions, its absence from Google’s US shopping listings may still be benefitting text ad trends for other retailers, particularly for queries where Google serves both text and shopping ad listings. Spend growth for Google text ads rose to 11% in Q4, while CPC growth remained at 2%.
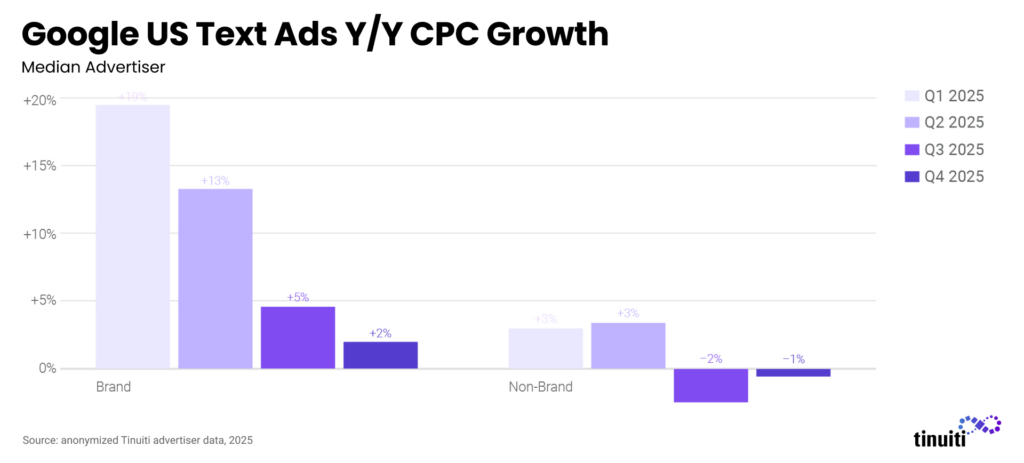
The average CPC for advertiser brand keywords spiked by 19% year over year in Q1 2025. In the quarters since, advertisers have been able to rein in these costs with brand CPC growth decelerating down to just 2% year over year in Q4 2025. Average CPCs for non-brand keywords have been much steadier, with 2025 growth ranging from 3% year over year in Q1 and Q2 to a 2% decline in Q3. Non-brand CPCs fell 1% in Q4.
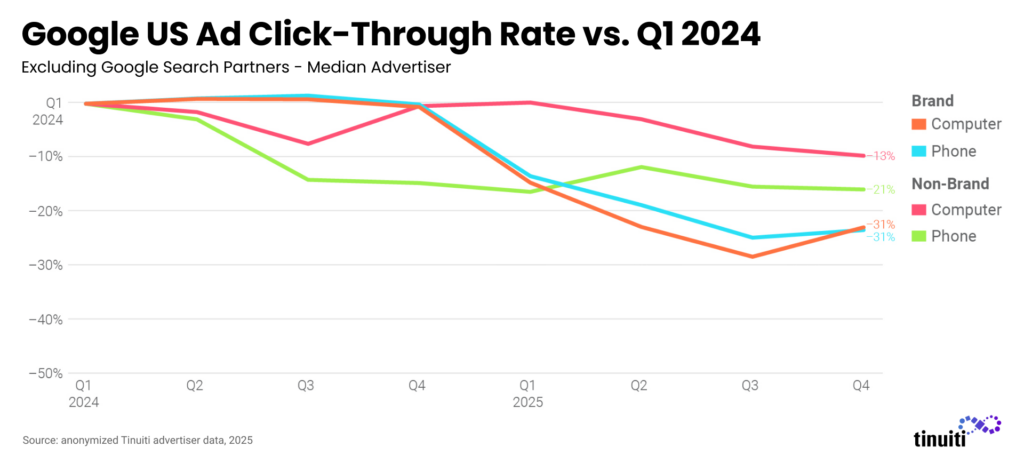
Widely launched in the US in Q2 2024, the rise of AI overviews in Google search results has held the potential to draw clicks from both paid and organic text links, or maybe more likely, to lead to fewer clicks at all. Compared to Q1 2024, brands have seen pretty significant declines in text ad click-through rates across devices and query types. But with text ad clicks seeing the strongest growth rates in years, these CTR declines have been more than offset by impression growth. Only Google knows how much these trends are AI-driven versus any number of ad serving, behavioral, or other mix shifts, and even they may not be able to quantify each factor precisely.
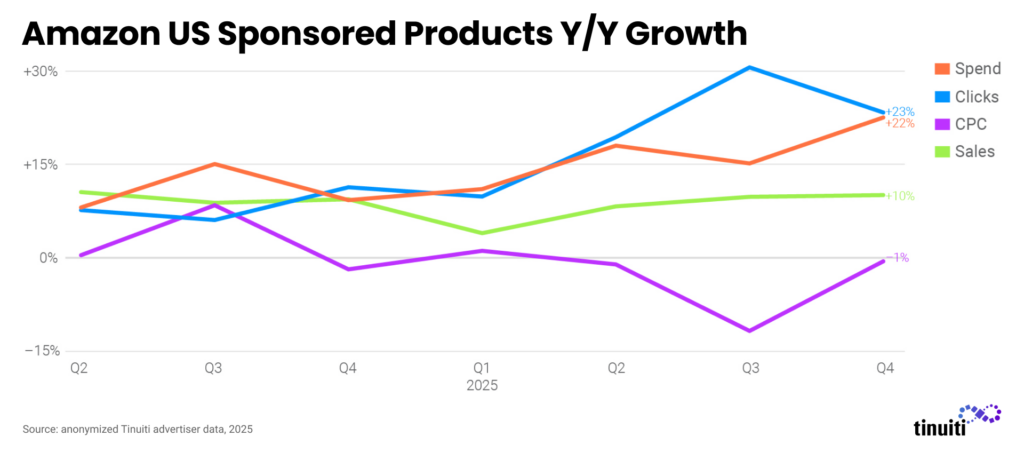
Clicks on Amazon Sponsored Products rose 23% year over year in the fourth quarter, the fifth straight quarter of double-digit growth. With average CPC declining 1% year over year, pricing has fallen in four out of the last five quarters. Amazon paused US Google Shopping ads in July and has remained nearly entirely absent since then, but the move hasn’t made a dent in Sponsored Products click growth. It’s possible even more users are searching directly on Amazon now that the ecommerce giant is missing from Google Shopping listings.
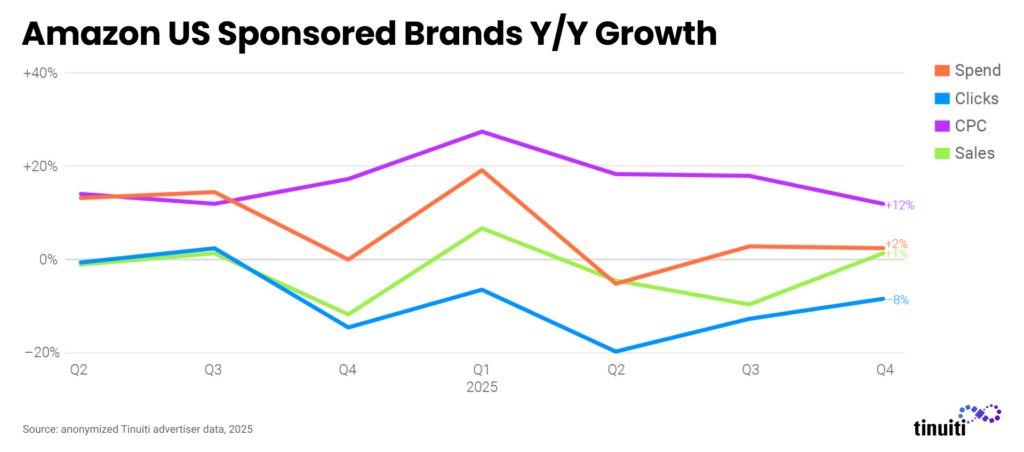
Advertisers increased investment in Amazon Sponsored Brands, including Sponsored Brands video ads, by 2% year over year, with an 8% decline in clicks offset by a 12% increase in the cost of clicks. While Sponsored Products clicks have soared year over year for the last five quarters, Sponsored Brands units have seen the opposite trend with year-over-year click declines throughout the same time frame.
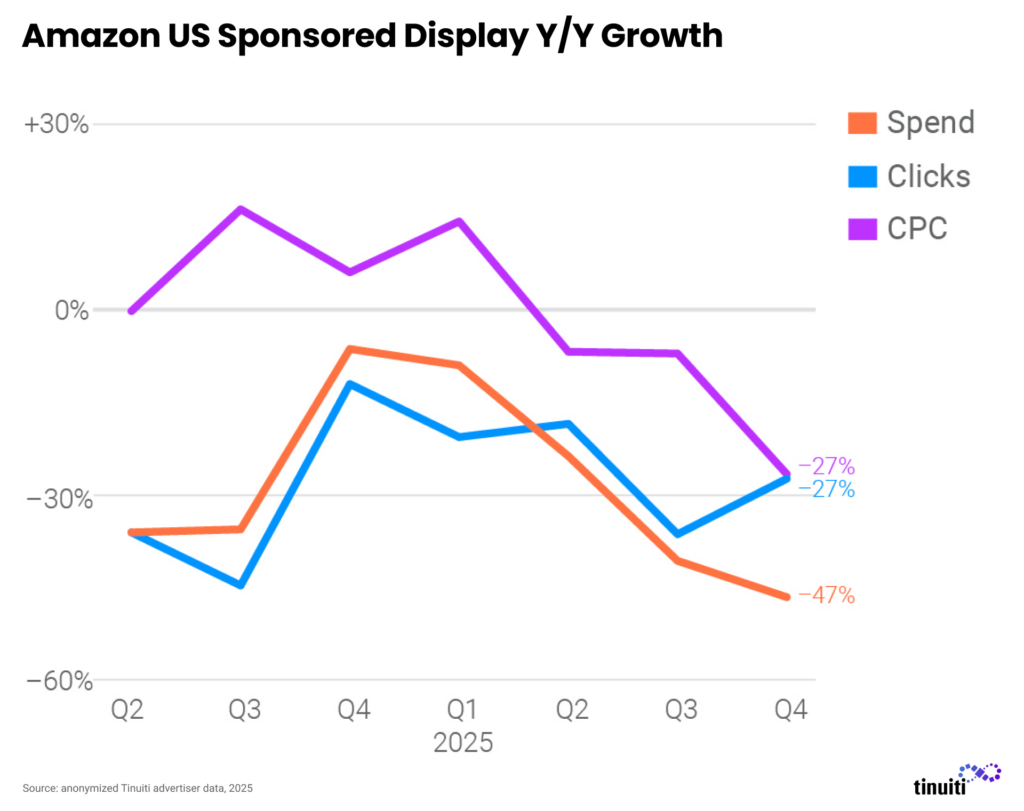
Investment in Amazon Sponsored Display campaigns has declined significantly over the last couple of years, and in Q4 2025 spend was down 47% compared to the same quarter the year prior. Both clicks and CPC fell 27% year over year in the fourth quarter. While Sponsored Display campaigns are becoming less important over time, display advertising as a whole is growing on Amazon as advertisers flock to the Amazon demand-side platform (DSP) for premium audience targeting and inventory.
Advertisers investing in both Amazon Ad Console ads and the Amazon DSP spent 40% of total Amazon budgets on the DSP in Q4 2025, up from 39% in the third quarter, as the DSP continues to grow in importance for Amazon advertisers over time. Brands are drawn to the Amazon DSP for its strong audience targeting both on and off Amazon properties, as well as for premiere inventory, such as for Amazon Prime Video ads, that isn’t available elsewhere.

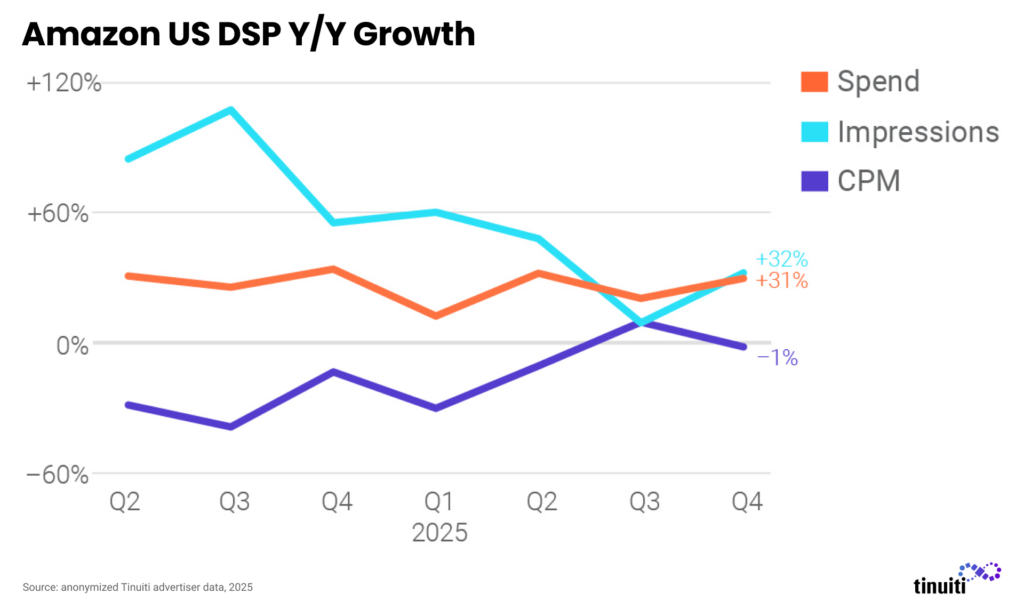
Advertisers active on the Amazon DSP since at least Q4 2024 ramped up spend on the platform 31% year over year in Q4 2025, an acceleration from 21% growth in Q3, as impressions rose 32% and CPM fell 1%. Non-endemic advertisers, meaning those that don’t sell products directly on Amazon, are increasingly tapping into the Amazon DSP in order to target premium inventory like Prime Video ads.
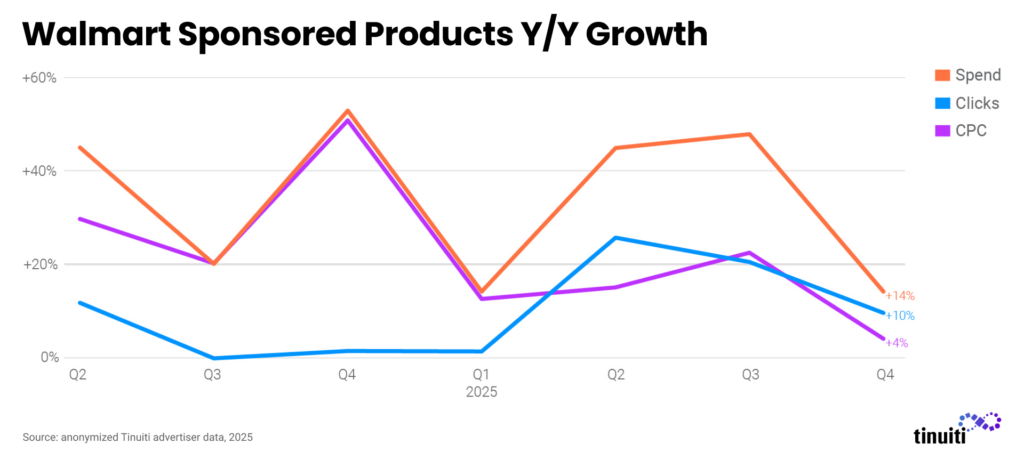
Spend on Walmart Sponsored Products rose 14% year over year, decelerating from 48% in the third quarter as advertisers ran into much tougher year-ago comps in the final quarter of the year. Spend exploded 53% back in Q4 2024, and two-year average growth held steady from Q3 2025 to Q4 2025 despite the quarter-to-quarter deceleration in year-over-year growth. Clicks rose 10% in Q4, while CPC increased just 4%, the first quarter that pricing grew by less than 10% since Q2 2023.
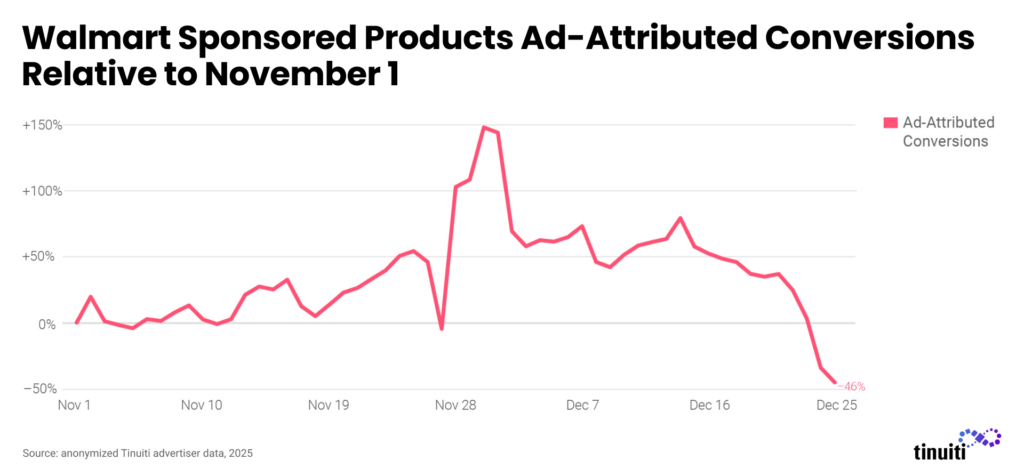
Conversions attributed to Walmart Sponsored Products ads started ramping up in mid-November, peaking on the Sunday and Monday after Thanksgiving. While volume dropped after that, daily conversions averaged more than 50% higher than the beginning of November all the way through December 22 before declining as the deadline to order products in time for Christmas delivery slowed demand down.
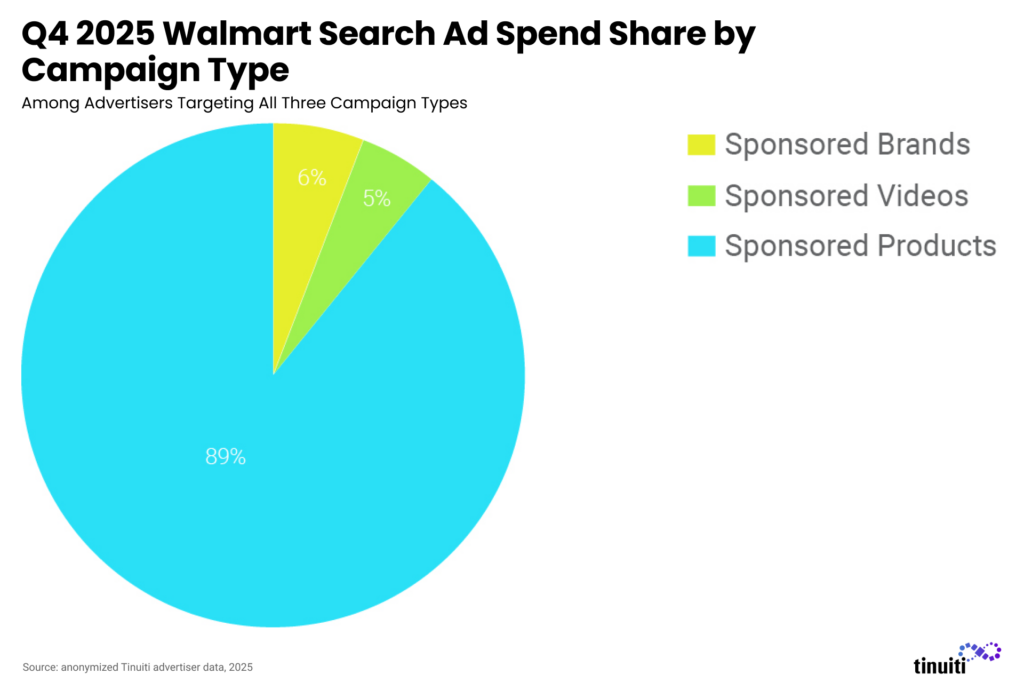
Fully 89% of all Walmart search ad spend went to Sponsored Products in the fourth quarter, with the remaining 11% split nearly evenly between Sponsored Brands and Sponsored Videos ads. While Sponsored Brands and Sponsored Videos ads are an important part of maximizing the Walmart advertising opportunity, it’s likely that Sponsored Products will continue to account for the vast majority of investment, much like they do on Amazon.
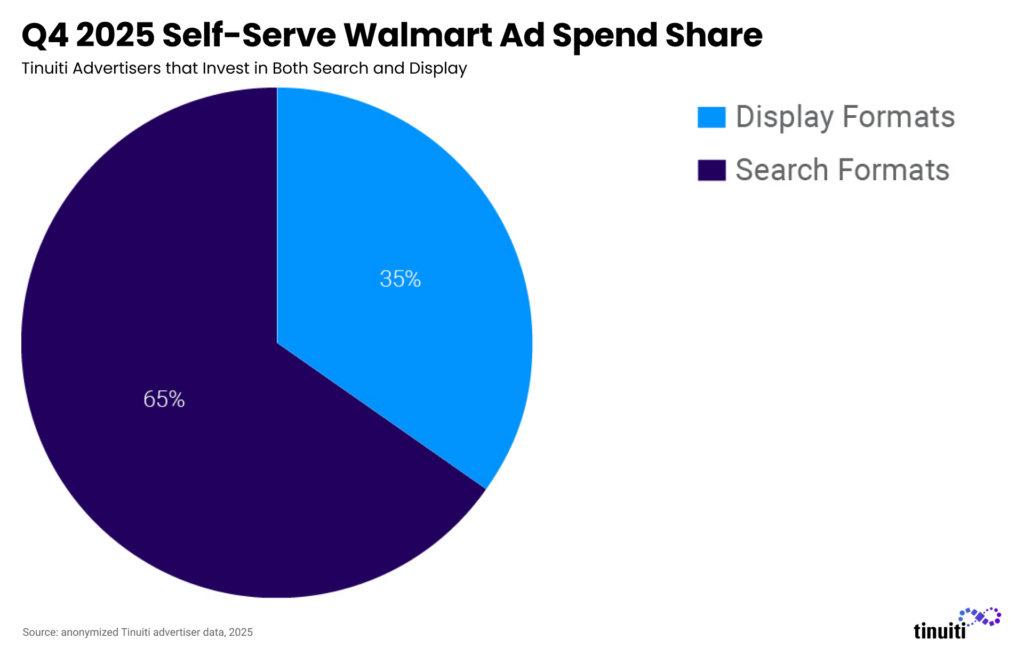
Among advertisers actively investing in both search and display self-serve Walmart advertising, 35% of spend went to display ads in Q4, up from 34% in the third quarter. While nearly two-thirds of spend still went to search ad formats, display advertising options targeting inventory on both Walmart’s own app/website and across the web are quickly gaining steam among advertisers.
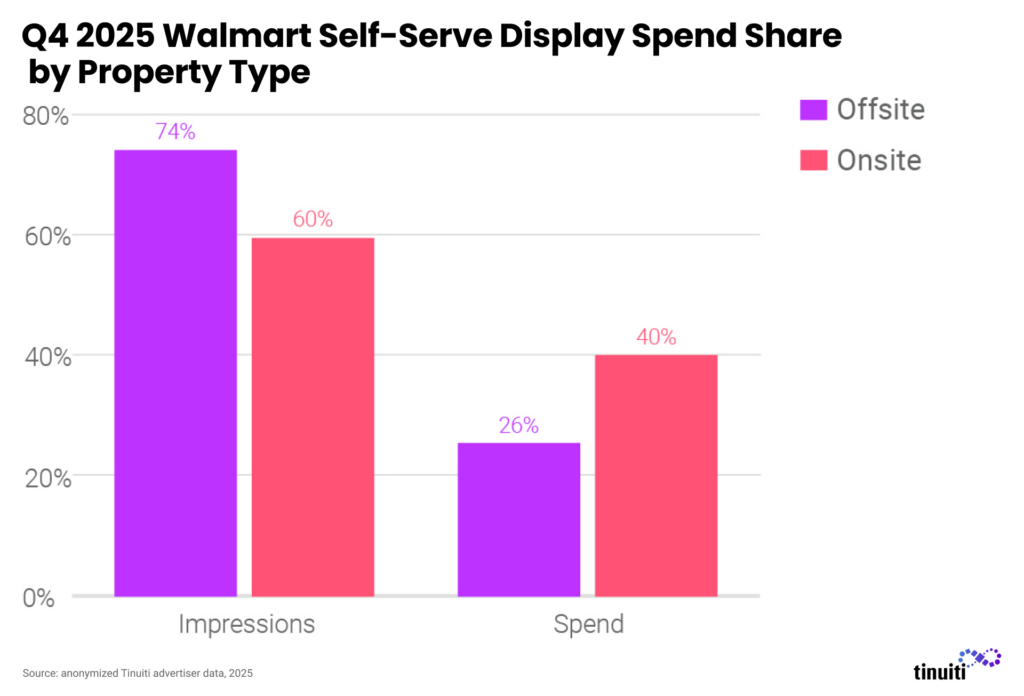
While ad inventory on Walmart’s app and website is highly valued by advertisers, many brands are using Walmart’s self-serve display advertising suite to target inventory across the web. In the fourth quarter, 60% of all Walmart self-serve display spend went to offsite inventory. Onsite inventory accounted for just 26% of impressions but 40% of spend, as these placements come at a higher CPM than offsite inventory.
Advertiser spending on YouTube inventory was up 13% year over year in Q4 2025, with impressions growing 38%, but average CPM falling 18%. While traditional video campaigns remain a fundamental component of YouTube spending, many brands, particularly in retail, are now investing a majority of their YouTube ad spend through Google’s Demand Gen campaigns. This shift was precipitated by Google automatically transitioning Video Action Campaigns to Demand Gen campaigns in July 2025.
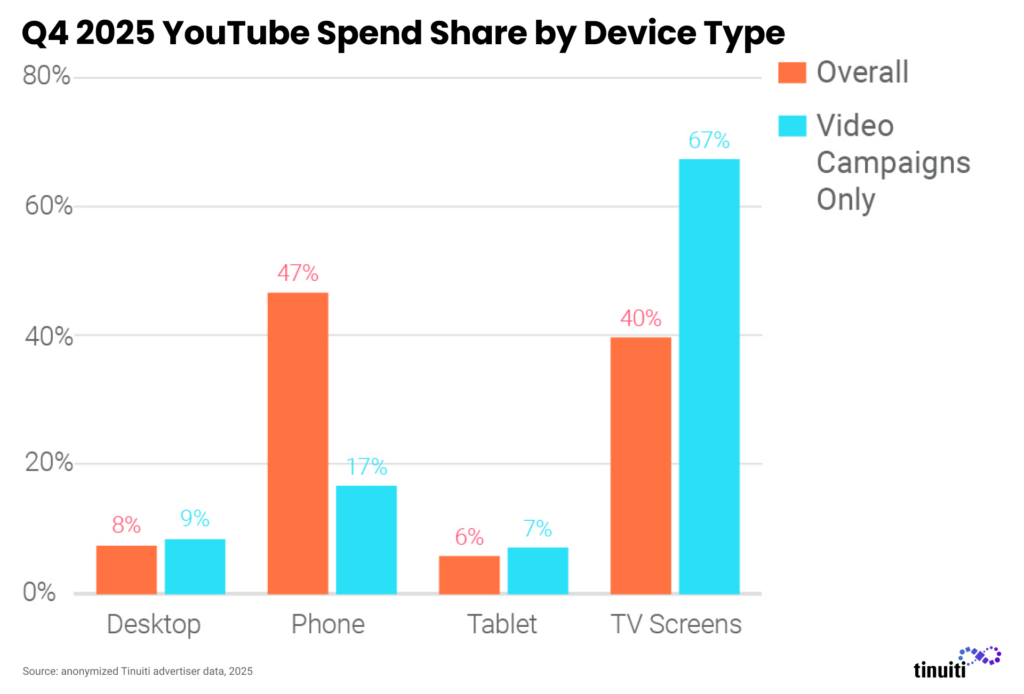
In Q4 2025, 67% of spending on YouTube inventory purchased through traditional video ad campaigns was attributed to TV screens, while phones contributed 17% of spending. Including the more direct-response oriented YouTube inventory purchased through Demand Gen campaigns, along with a smaller contribution from App campaigns, TV screens accounted for 40% of total YouTube spending in Q4, while phones accounted for 47%.
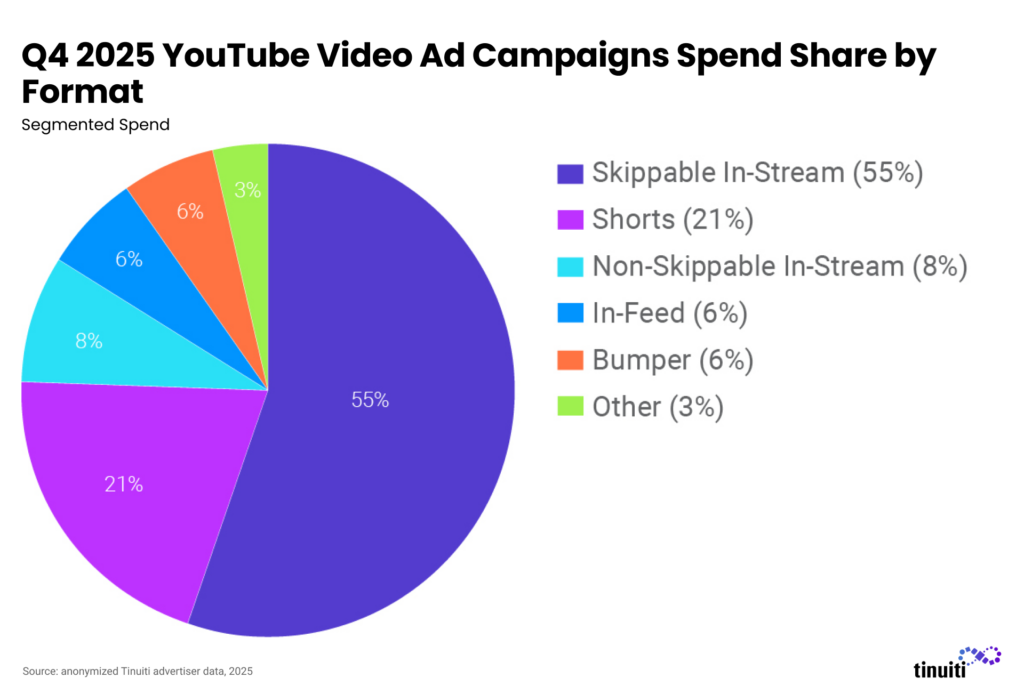
Shorts ads were responsible for just under 21% of spending on YouTube video ad campaigns in Q4 2025, second only to skippable in-stream ads at 55% of spending. TV screens accounted for 49% of Shorts ad spending from YouTube video ad campaigns in Q4, while phones accounted for 26%. Shorts are a smaller contributor to YouTube ad inventory purchased through Demand Gen campaigns, accounting for 11% of spending.
Video ads produced an average of 66% of Google Demand Gen campaign spending in Q4 2025, up from just 28% a year earlier. Google announced in September 2024 that it would transition Video Action Campaigns to Demand Gen campaigns in 2025 and recommended advertisers start running Demand Gen campaigns in preparation. In April 2025, Google removed the ability to create new Video Action Campaigns, while in July 2025, it began transitioning Video Action Campaigns to Demand Gen automatically.
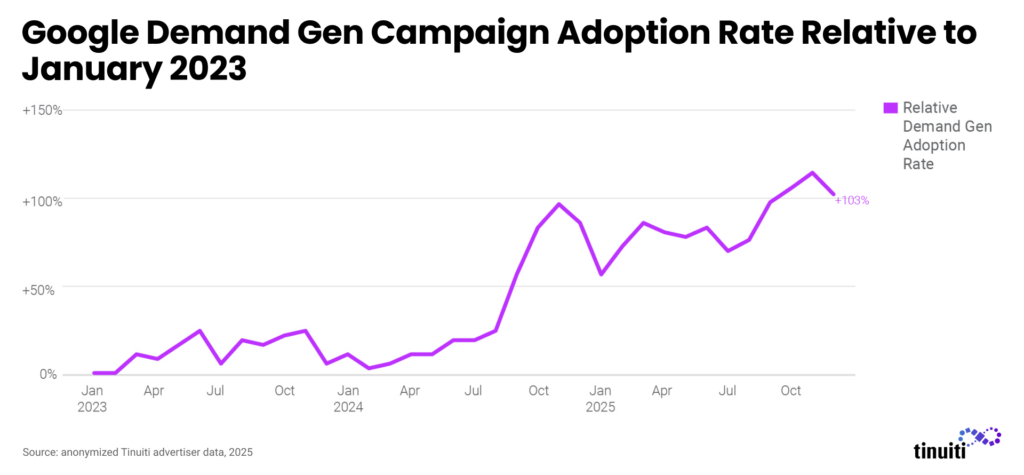
Google’s late 2024 announcement of its plans to transition Video Action Campaigns to Demand Gen campaigns over the course of 2025 brought with it a sharp uptick in adoption rates for Demand Gen campaigns, with a peak in November 2024 at the height of the holiday shopping season. Demand Gen adoption rate dipped to start 2025, but ultimately peaked again at a new high in November 2025. To close out 2025, roughly twice as many Google advertisers were running Demand Gen campaigns than in January 2023.
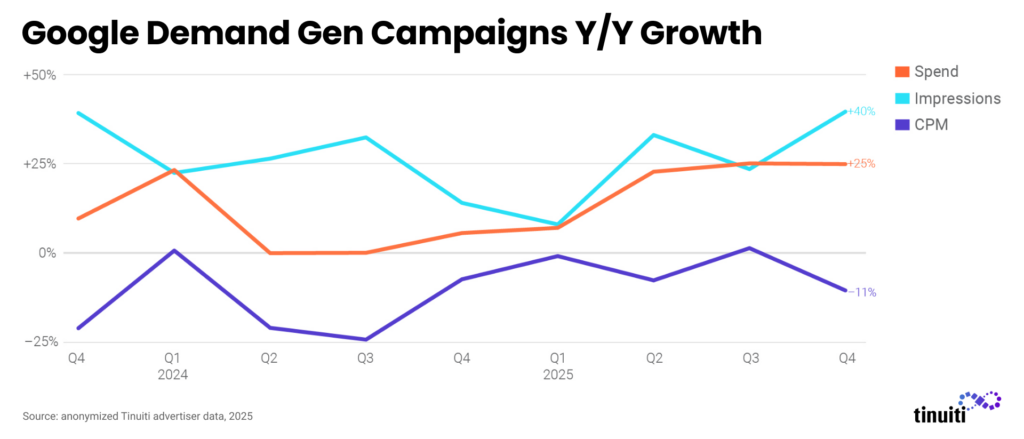
Among brands that were active on Google Demand Gen campaigns in both Q4 2024 and Q4 2025, spending was up 25% year over year, which was roughly steady with a quarter earlier. Same-site Demand Gen ad impressions were up 40% year over year in Q4, an acceleration from 24% growth in Q3. Average CPM growth slowed from a 2% gain in Q3 to an 11% year over year decline in Q4, the largest decline in pricing since Q3 2024.
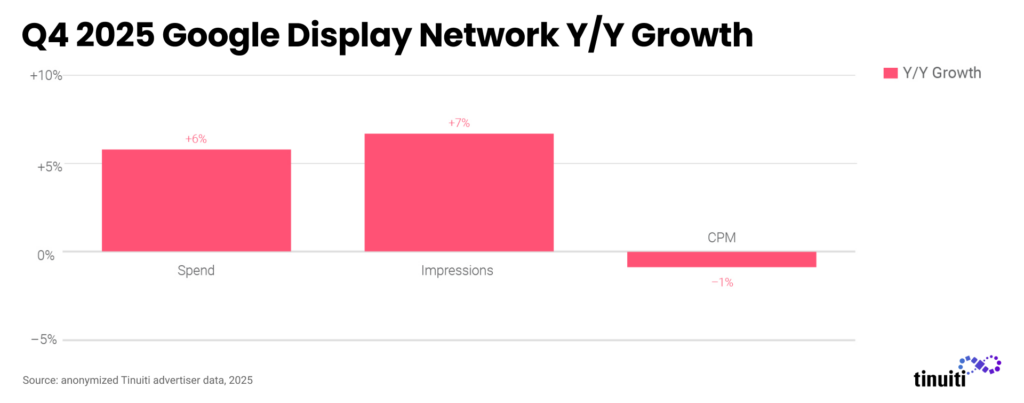
Tinuiti advertiser spending on the Google Display Network, including from Google display, Demand Gen, and App campaigns, among others, was up 6% year over year in Q4 2025, up from a 4% increase in Q3. Impressions were 7% higher year over year, but CPM fell 3%. Google has officially reported year-over-year declines for its Other ad revenue segment — for inventory outside of search and YouTube — each quarter since the second half of 2022.
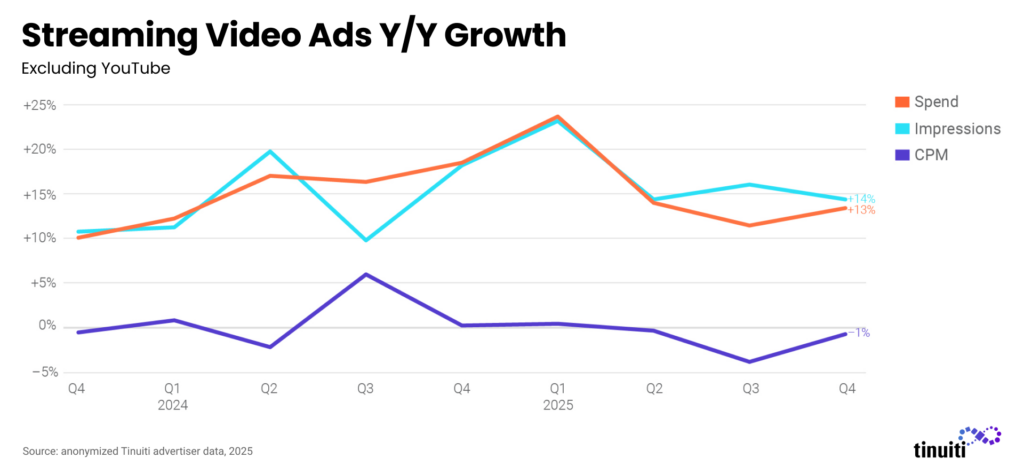
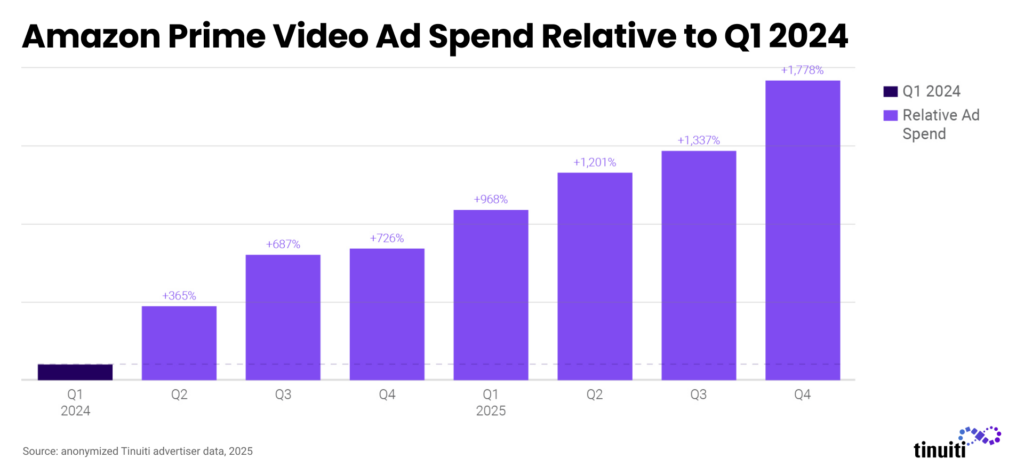
Spending on streaming video ads outside of YouTube was up 13% year over year in Q4 2025, up a couple points from a quarter earlier. Streaming impressions grew 14% year over year in Q4, but CPMs fell 1% year over year. The launch of Prime Video ads in Q1 2024 helped drive up total streaming spending and Prime ads remained a large contributor to streaming spending growth rates in Q4 2025.
Across new, existing, and returning advertisers, Prime Video ad spending grew 31% from Q3 2025 to Q4 2025. Year-over-year spending growth for Prime Video ads was 127% in Q4, an acceleration from 82% growth a quarter earlier. At its November 2025 unBoxed event, Amazon noted that Prime’s ad-supported reach was already over 315 million globally, with an average monthly ad-supported reach of more than 130 million users in the US.
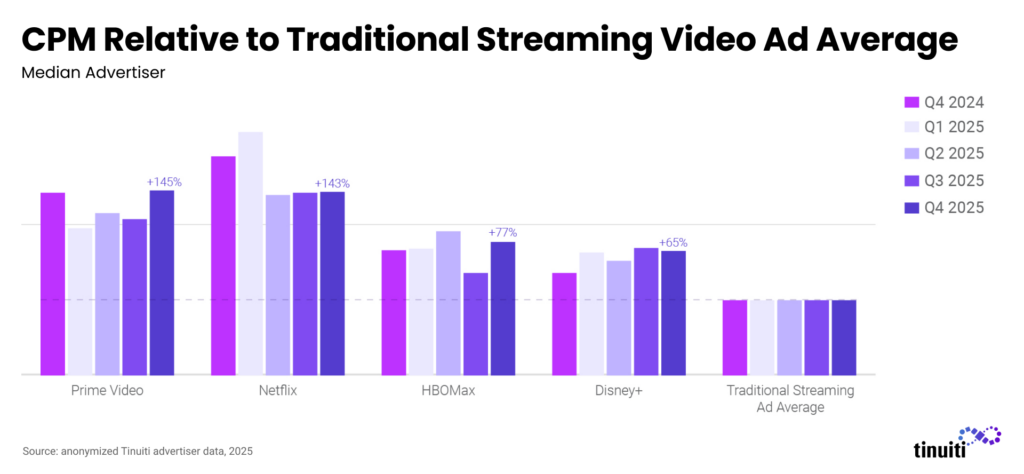
For the first time, CPMs for Prime Video ad inventory outpaced those for Netflix in Q4 2025, albeit just slightly. Across four of the largest US streamers — Prime Video, Netflix, HBO Max, and Disney+ — advertisers have been seeing greater parity in pricing over recent quarters, as overall video ad streaming CPM growth has run flat to down slightly in year-over-year terms.
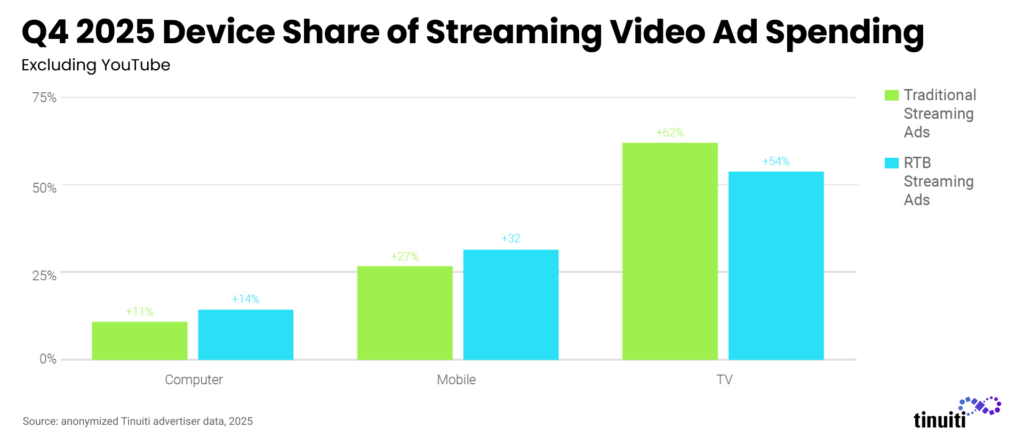
Outside of YouTube, TV screens accounted for 62% of traditional streaming video ad spending and 54% of spending on RTB-purchased streaming video ad inventory. Mobile devices, including both phones and tablets, accounted for 27% of traditional streaming video ad spending and 32% of RTB spending. Computers accounted for 11% and 14% of traditional and RTB spending, respectively.
Check out our most recent Digital Ads Benchmark Report for more exclusive insights.