Amazon Advertising Q2 Benchmark Report for 2017 vs 2018

As an agency managing hundreds of sellers, we know that Amazon Sponsored Products is and will continue to be one of the most powerful tools for driving discoverability and incremental sales for Amazon sellers.
Before we dive into our Amazon Advertising Q2 Benchmark Report for 2017 vs 2018, let’s discuss the building blocks of Sponsored Products and how it impacts sellers.
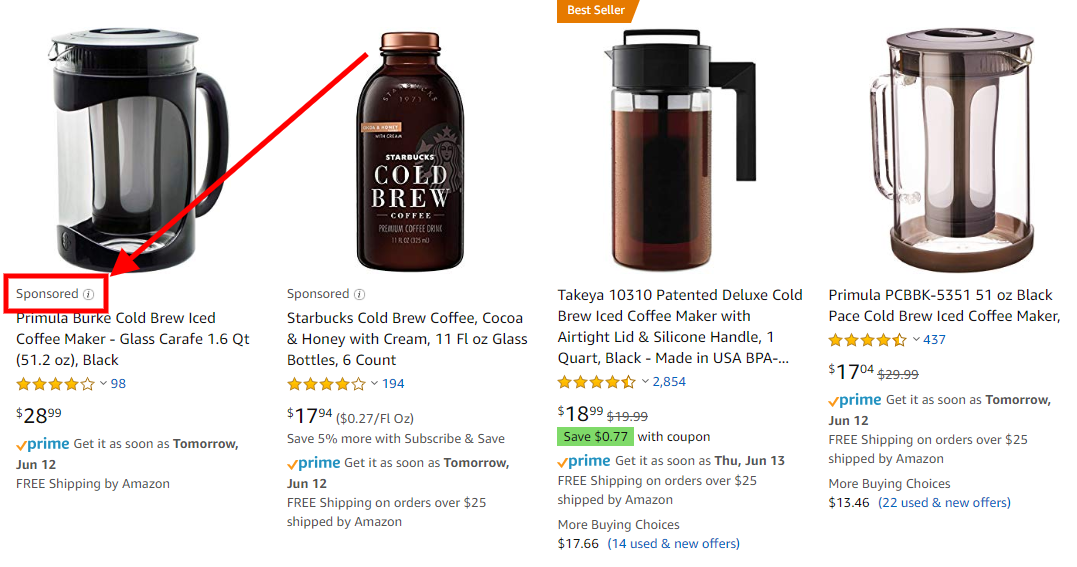
Sponsored Products is a PPC platform, which exists within the Amazon Marketplace and drives traffic to an Amazon detail page.
These ads exist on the right rail of the Amazon SERP, at the top and bottom of the SERP, and on the carousel on product detail pages.

Sponsored Products also impact a seller’s overall Marketplace presence by providing an acceleration program for newer or low-exposure ASINs, increasing Discoverability for your top Buy Box offers and acting as an incremental revenue driver.
Last year, Amazon tightened up their standards for sellers on the platform–and the marketplace is only going to get more competitive in 2018 and beyond.
We anticipate the “cost to play” will increase as more Amazon sellers flood the Marketplace increasing demand in the bidding auction.
In response, sellers will have to rely on sophisticated paid marketing campaigns and strategies to outsmart their competitors.

“We expect click volume and click-through rates to increase for Sponsored Product ads as they become less discernible from organic listings, meaning winning these auctions will be more important than ever.”
– Pat Petriello, Head of Marketplace at CPC Strategy
To better understand the trends occurring within Amazon’s Sponsored Products program, CPC Strategy conducted an analysis of our Sponsored Products data for all same store clients from Q2 2017 to Q2 2018.
The data we gathered is from Vendors & Third Party Sellers leveraging Sponsored Products.
CPC Strategy collected the following metrics* including:
*Please note all data (with the exception of CPC) is normalized for confidentiality.
The analysis below includes data from 54 U.S. Amazon sellers.
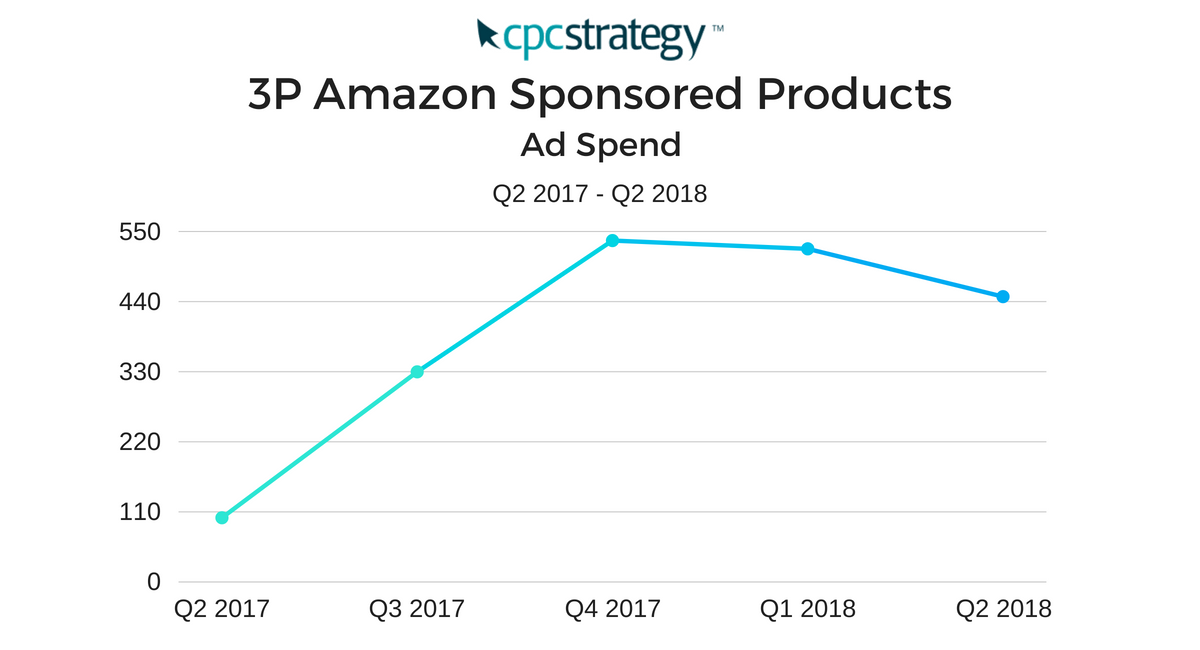
We saw a +347.04% increase in spend from Q2 2017 to Q2 2018.
This steep increase indicates that sellers are investing more marketing dollars into Amazon advertising than ever before.
It also indicates that sellers view Amazon Sponsored Products as an effective use of their budget to help drive sales and increase revenue.
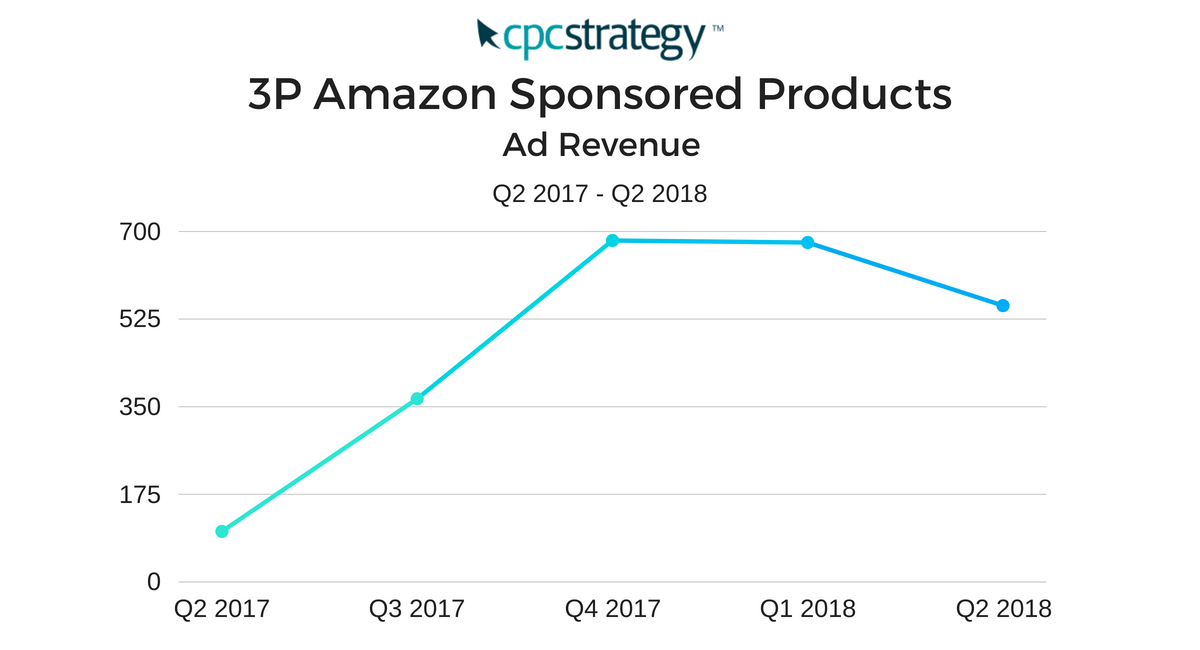
We also saw a lift of +451.81% in ad revenue from Q2 2017 to Q2 2018.
The data above indicates revenue lift is outpacing spend lift which means:
1) Ads are performing better in terms of efficiency, which is likely due to sophisticated targeting techniques and implementation.
2) Sellers are willing to spend more because they are seeing a strong return on their incremental investment in Sponsored Products.
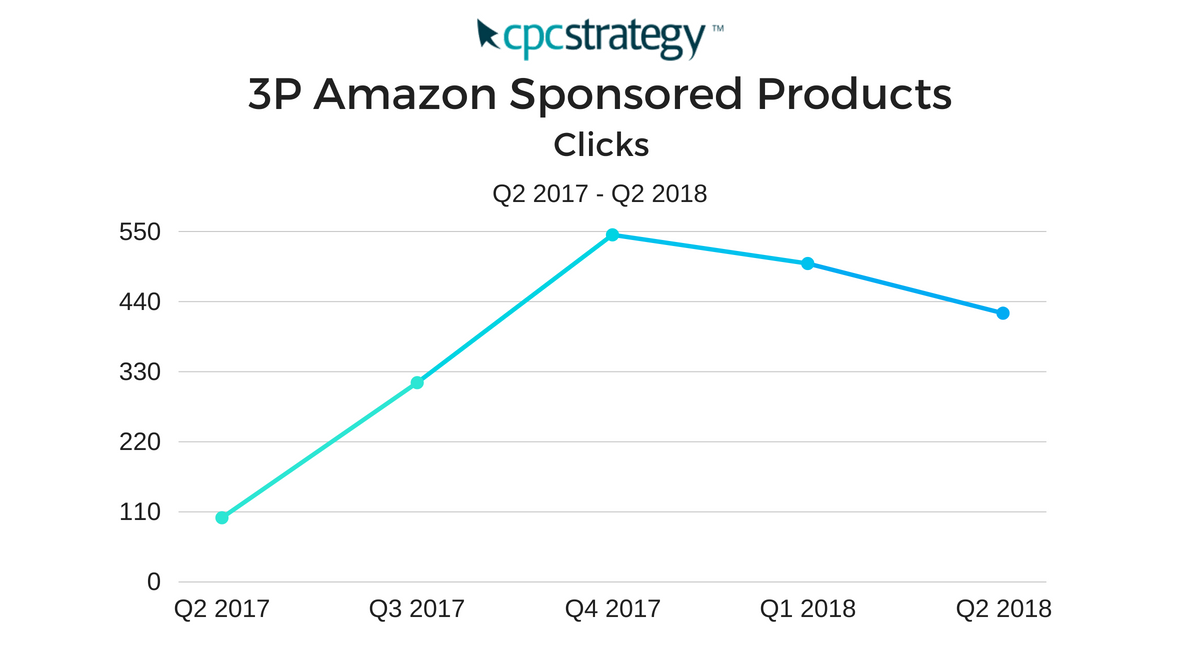
The lift trend continues with a +321.60% increase in clicks. This indicates that the increase in spend is also driving a similar increase in clicks and traffic to seller detail page(s).
Note: Typically, when we significantly increase ad spend (coinciding with a lift in traffic) there is an expected decrease on return. Why? Because you are expanding your reach and targeting shoppers located much higher up the sales funnel, who typically have a lower purchase intent.
However, what the data is showing us (which also supports the actions we see sellers taking) is that the return in conversion rate is actually holding strong (which is counter to what we typically predict to happen in PPC channels.)
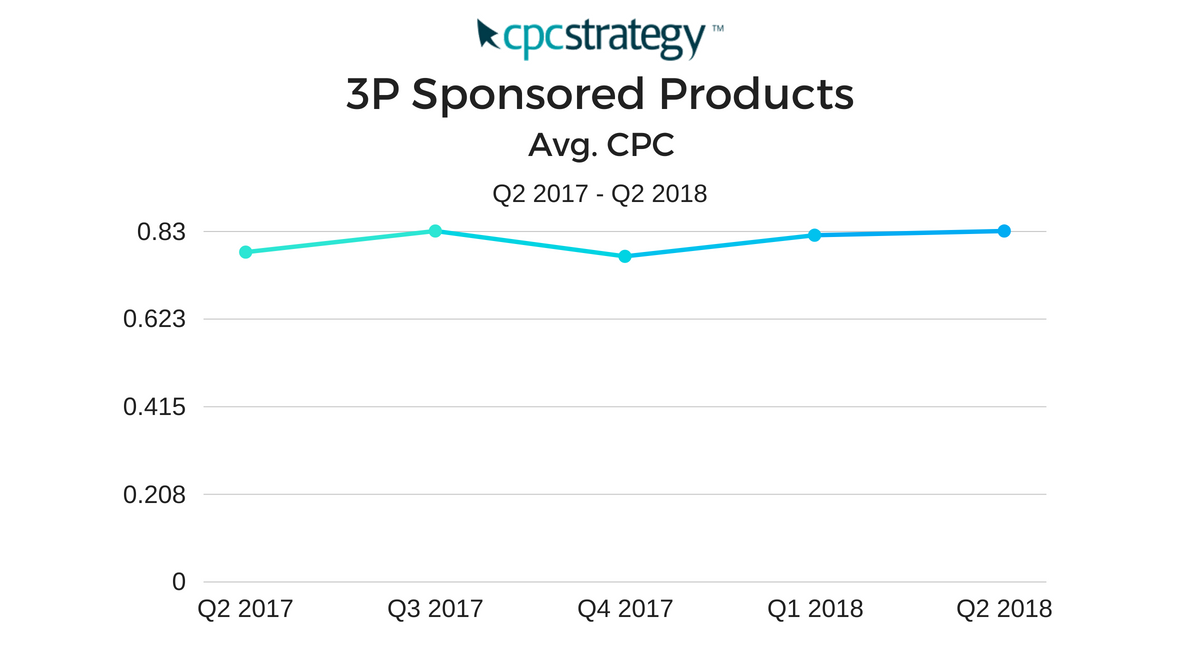
We also saw an increase in average CPCs from .79 in Q2 2017 to .84 in Q2 2018 – this 6% lift is no surprise.
As more sellers continue to join Amazon and adopt the Sponsored Products platform – there is inevitable going to be more competition and higher ad costs within the ad auction.
This analysis includes data from 42 US Amazon Vendors (within our CAPx AMS platform).
Keep in mind, this analysis is focused on large CPG brands that typically have higher budgets than 3P sellers.
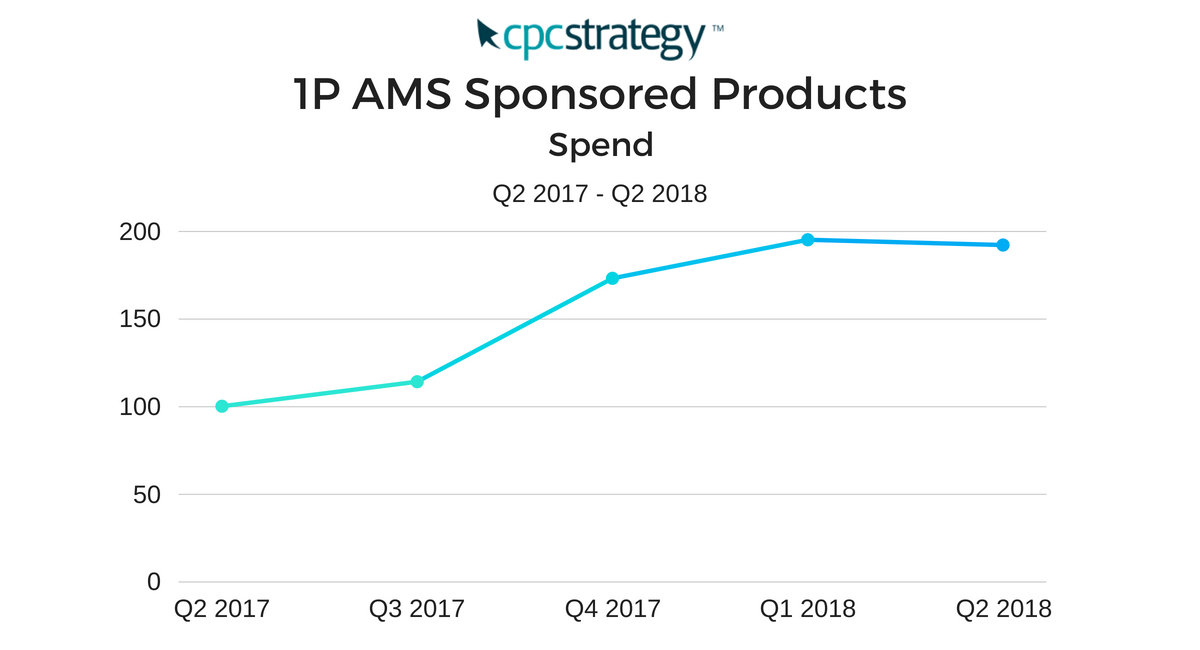
We saw a +92.78% increase in spend from Q2 2017 to Q2 2018 – this indicates a less aggressive but similar trend to the 3P data mentioned above.
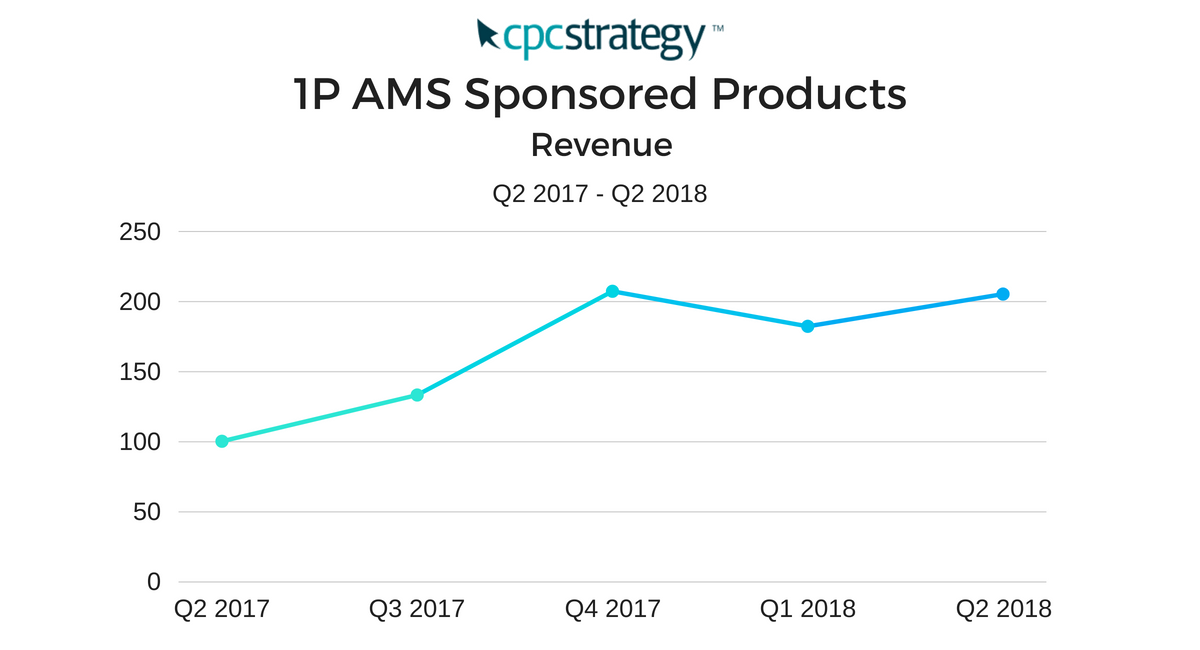
We also saw a +105.29% increase in revenue from Q2 2017 to Q2 2018. This indicates an increase in spend led to an even bigger increase in revenue (even with CPCs continuing to rise).
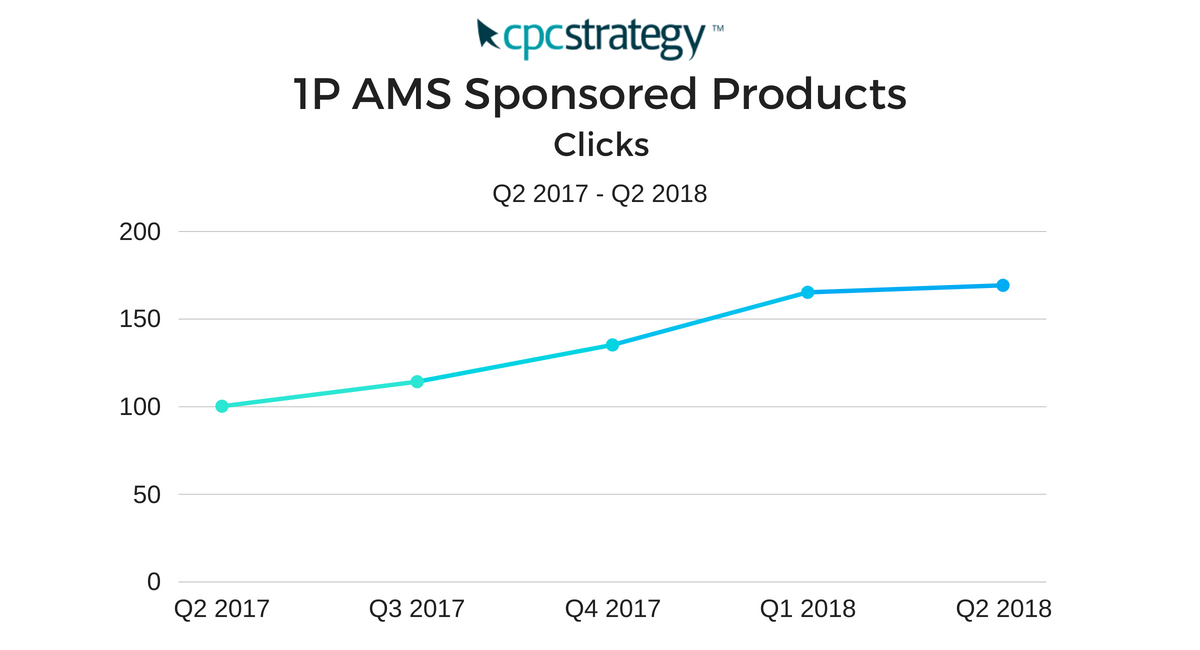
We also saw a +69.67% increase in clicks from Q2 2017 to Q2 2018 – once again similar to the 3P data trend mentioned above.
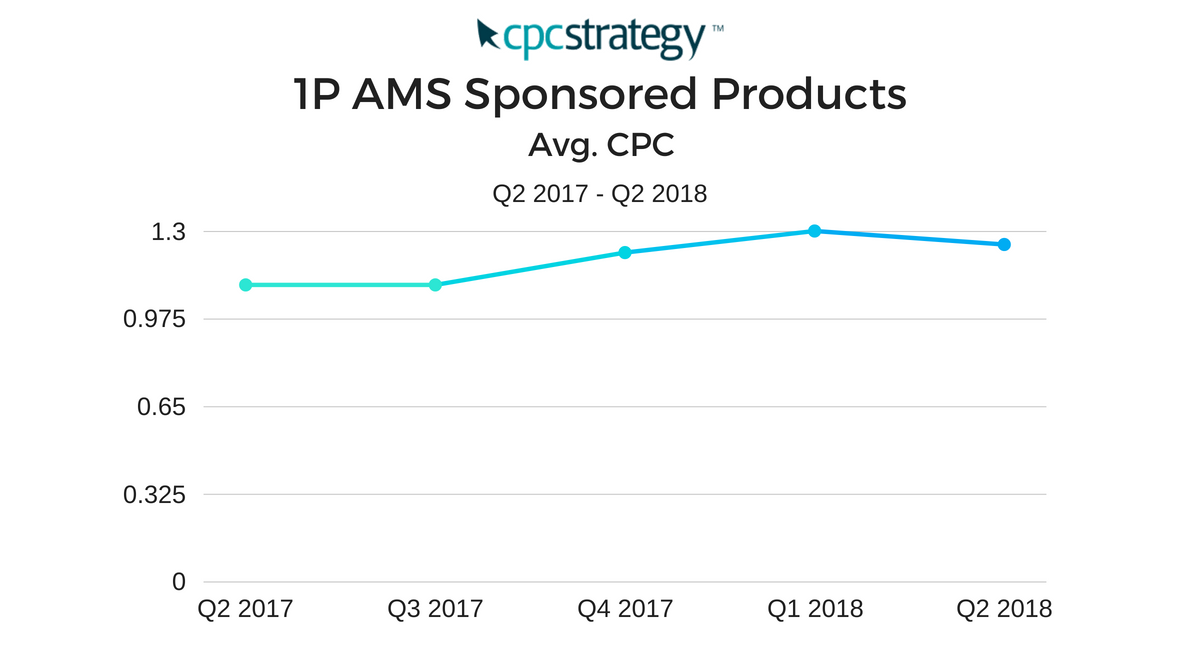
CPCs also increased a total of 14% from $1.10 in Q2 2017 to $1.25 in Q2 2018.
You may have noticed a stark difference between the lift in 3P data vs 1P AMS data. We believe the reason for this is because AMS brands are typically operating with much larger budgets than third party sellers.
Therefore, when they increase budgets, while it may be a sizeable amount, it doesn’t lift the ratio as much as it would when a smaller business doubles or triples a lower tiered amount of ad spend.
However, across both platforms we did see similar trends hold true.
The most notable takeaway is that throughout 2017 to 2018 the increase in spend led to a strong increase in revenue across both Sellers and Vendors leveraging Sponsored Products.
For more on our Amazon Sponsored Products Q2 data analysis, email [email protected]