How to Navigate Attribution Modeling in Google Analytics


An attribution model is the rule, or set of rules, that determines how credit for sales and conversions is assigned to touchpoints in conversion paths.
In ecommerce, attribution can be a complicated concept for retailers to understand. It’s imperative for retailers to know which marketing channels or campaigns are having the most impact on their customers. By dissecting the pathways that customers take to discover and make a purchase, retailers can better inform their budget and marketing strategy.
Most retailers can agree that a large portion (if not all) of their marketing budget will be devoted to their online business. In response to the vast landscape and multiple touchpoints within an online purchase such as email, social media, SEO and PPC – it’s important to understand how each of these channels relate and support each other throughout the shopper’s journey.
In Analytics, conversions and ecommerce transactions are credited to the last campaign, search, or ad that referred the user when he or she converted.
Two questions most retailers ask:
The Multi-Channel Funnel reports answer these questions and others by showing how your marketing channels (i.e., sources of traffic to your website) work together to create sales and conversions.
Even though a purchase is made via a Google search, customers could have been introduced to a brand via a blog or while searching for specific products and services.
The Multi-Channel Funnel reports show how previous referrals and searches contributed to a sale.
Note: For a retailer there are a variety of “channels” (e.g. online-to-offline, computer-to-mobile, digital-channel-to-another-
Below is an example to help explain how each of the attribution models apply to a conversion:
“Laura finds shoes.com by clicking one of it’s AdWords ads. She returns one week later by clicking over from Facebook. That same day, she comes back a third time via one of shoes.com’s email campaigns, and a few hours later, she returns again directly and buys a pair of sneakers.
The Model Comparison Tool allows retailers to compare the impact of different attribution models on their marketing channels. Within the tool, the calculated Conversion Value (and the number of conversions) for each of the marketing channels will vary according to the attribution model used.
For example, a channel that predominantly initiates conversion paths will have a higher Conversion Value according to the First Interaction attribution model than it would according to the Last Interaction attribution model.
The Model Comparison Tool allows retailers to compare up to 3 different attribution models at once to measure the impact of their marketing channels.
According to Google, when evaluating the effectiveness of your channels, use attribution models that reflect your advertising goals and business models. Regardless of the model(s) you use, test your assumptions by experimenting. Increase or decrease investment in a channel as guided by the model output, then observe your results in the data.
There are a variety of tools available to determine this information but for this example we will focus on Google Analytics.
“Google Analytics is the best place to start. There is a lot of valuable data in there – but first retailers should define what they are trying to accomplish with this level of analysis, otherwise they risk getting lost in a mess of details,” David Weichel, Paid Search Director at CPC Strategy said.
The Multi-Channel Funnel reports are generated from conversion paths, the sequences of interactions (i.e., clicks/referrals from channels) that led up to each conversion and transaction.
By default, only interactions within the last 30 days are included in conversion paths, but you can adjust this time period from 1-90 days using the Lookback Window selector at the top of each report. Conversion path data include interactions with virtually all digital channels. These channels include, but are not limited to:

“In the end, make sure to consistently come back to compare your models against one another to see if your hypothesis was indeed correct. It may very well have not been true, but at least now you know,” Weichel said.
Note: There are a few different types of multi-channel attribution but for this example, we’re focusing strictly on Digital Channels. This doesn’t account for online-to-store or across-devices or anything else that in reality impacts how we’re attributing value to channels.
Figure out which channels are leading to the most New Customer Acquisition and invest more in those channels.
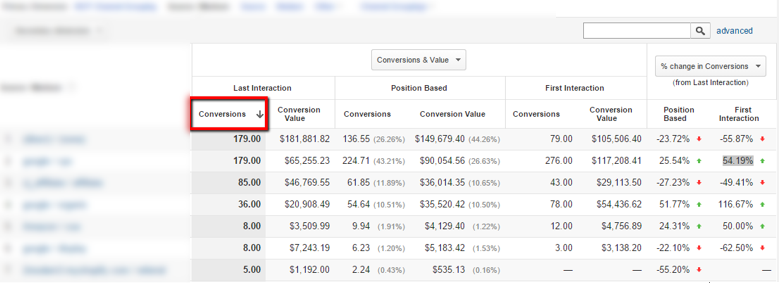
View conversion data by Last Interaction (the default in Google Analytics) would provide the example below:
Note: (direct) / (none) is high on the list.

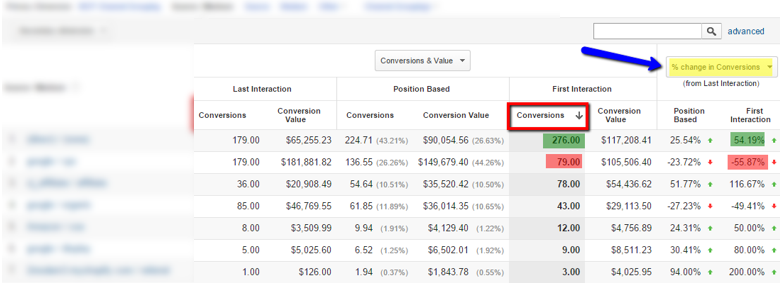
If you sort by First Interaction conversions, you may see a completely different story (below):


For this example, the data tells you to invest more into google / cpc if you want to continue growing the business.
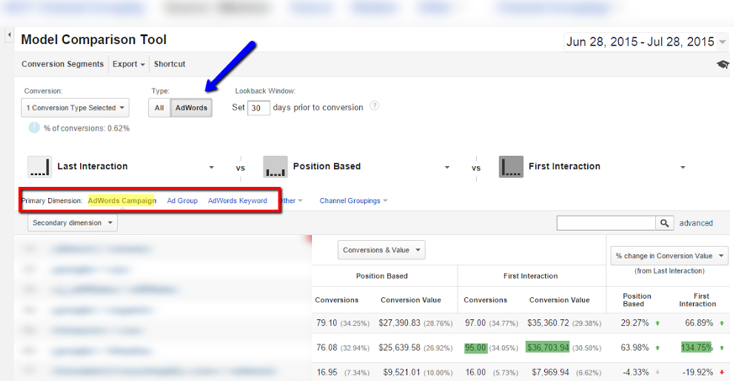
Now you know to invest more in AdWords, but the next question is where do you increase campaign budgets or raise keyword / product bids?

Unfortunately AdWords data doesn’t differentiate between First click and all other clicks.
So where in the funnel does it actually exist?
Is it an Introducer? Or is it a Closer?
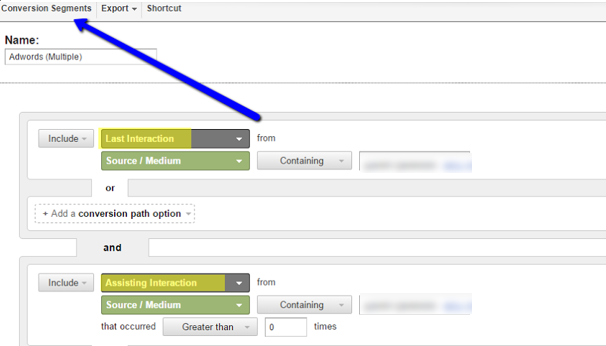
Depending on which one, retailers should be treating it differently. According to Weichel, retailers can use Conversion Segments to further refine the data here and if they only want to look at Transactions that resulted from multiple AdWords clicks then they can do so here.
Below is an example of setting up a conversion segment to do just that:

Here retailers can see within AdWords clicks, which ones are happening First, and which ones are actually taking the credit in Analytics (and AdWords for that matter since AdWords uses a last-paid-click model as well).
“Retailers can use this to inform their analysis within AdWords, because that Brand/Trademark campaign might not be doing so well if it didn’t have all these other campaigns to first introduce users to the site.”

Check out our video on how to use attribution models and search funnels here.
