Though Facebook’s newest tool – Facebook Analytics – is technically designed for advertisers, it’s something marketers of all types can use, whether they’re using Facebook for organic traction, sales, lead generation or just a simple social presence.
For advertisers, Facebook Analytics can shed light on detailed ad data that can improve your campaigns and your conversion rates.
And since Analytics is powered by the Facebook Pixel, it can also give insights into all your Facebook-to-website activity, regardless of whether it’s associated with a paid campaign or not.

In fact, Facebook Analytics can actually give you a full visualization of your entire sales funnel: See how comments on a post translate into clicks to your site, then products in your cart and, finally, to money in your pocket.
Let’s look at the power of Facebook Analytics a little more in depth.
What is Facebook Analytics?
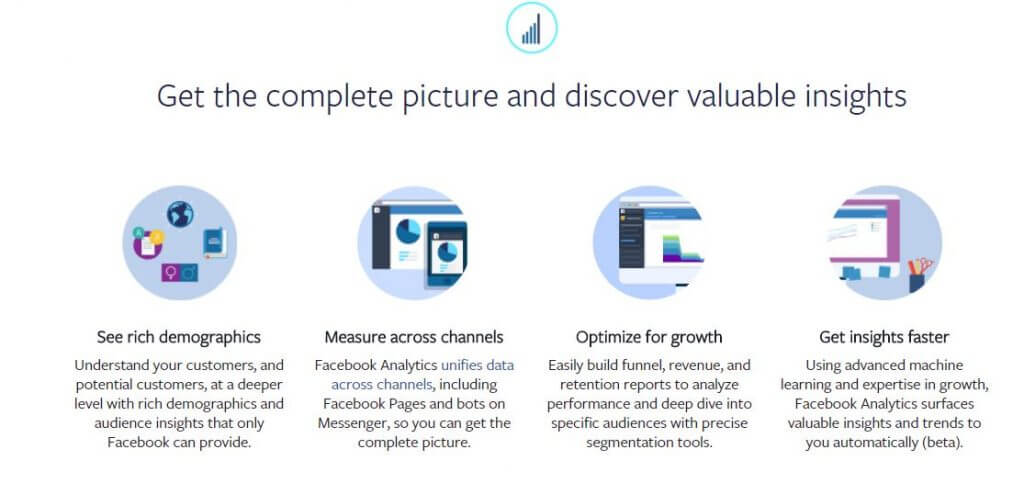
Facebook Analytics is a metrics tool that lets you see how Facebook users are interacting with your page, your websites, your apps and your Messenger bots. It’s completely free, and you don’t even need a Facebook login to use it.
All in all, Facebook analytics can help you:
- Better understand audience demographics
- Measure activity as it transfers across channels and devices
- Build funnel, revenue and retention reports
- More easily understand your retention rate
- Identify your top, highest-value customers and create lookalike audiences that mirror those
- Get automated insights and trend data as it happens
- Measure conversions for any number of tasks
- Use graphs, bar charts and tables to visualize your metrics in an actionable way
Facebook Analytics is also great for measuring how users interact with your brand across devices.
Since Google Analytics uses cookies – which can easily be blocked, they’re often inaccurate once a user switches to mobile or back to desktop.
With Facebook, however, users are typically logged into the same account across all their devices, making cross-device tracking easier and more accurate.
You can also use Facebook Analytics to discover when users are encountering a challenge in the sales cycle.
As Facebook puts it, “Find out when customers have trouble completing a task, such as when a checkout flow is too long or a game level is too hard to beat.” These insights can help you tweak your strategy and improve future performance.
What Kind of Reports CaDemon Facebook Analytics Pull?
There are hundreds of unique Facebook Analytics reports you can pull, each one offering different insights into your strategies, campaigns and overarching goals.
Here are just a few of the potential reports you might find interesting:
- A funnel, showing how Facebook comments trickle down to website purchases (and how many of those comments brought in sales)
- The lifetime value of certain customers, broken down by age, gender, country and even value of purchase
- User retention, after an initial interaction with your brand
- Your highest-value customers, broken down by demographic data
- The number of users who registered on your site and then eventually made a purchase
- App downloads as they translate to website views and eventual purchases
These are just an example of the many reports you can pull using Facebook Analytics. The exact ones you’ll want to generate depends on your unique goals, as well as the marketing and advertising strategies you’re currently using.
How Does it Gather Data?
Facebook Analytics reports use data pulled from the Facebook Pixel, as well as subsequent events you have set up for your website.
You can track a total of nine different events using your Pixel, including:
- Purchase
- Lead
- Complete registration
- Add payment info
- Initiate checkout
- Add to cart
- Add to wishlist
- Search
- View content
You don’t need to track all of them to gather solid insights into your marketing efforts, but remember: the more events you have, the more Pixel data you’ll have to pull from for reports. And that likely means deeper insights into how each individual effort interacts and plays off one another (or how it doesn’t).
Setting up the Pixel is as easy as adding a few lines of code to your site’s back-end.
Just check out these directions to learn more about setting yours up if you haven’t already done so. As for adding events, you can simply click the events you want to track within Ads Manager to toggle on or off, then add parameters as necessary and copy the event code onto the page you want to track.
To learn more about Facebook Analytics, email [email protected].
You Might Be Interested In


