The Q4 Google Analytics Report Every Ecommerce Retailer Needs


There’s nothing worse than being caught out of stock on a hot-selling item in the middle of the holidays.
What if we told you there’s a solution that could help you avoid that and help you stay on top of your bids for a maximum return?
At CPC, we call them “sales velocity reports.“
This simple custom Google Analytics ecommerce report will show you product- and category- level data during key shopping holidays so you can plan ahead. Overall, it helps with:
That’s right–it’s a report you’ll actually be able to put to good use.
 “These reports show the percent difference in product performance from one time period to another, which can be helpful to see,” says Stephen Kerner, Manager of Retail Search at CPC Strategy.
“Let’s say you have one product that really picks up during Black Friday–you can prepare for the next year with inventory and bid adjustments.”
Let’s get started.
Start in your Google Analytics account under Customization > Custom Reports.

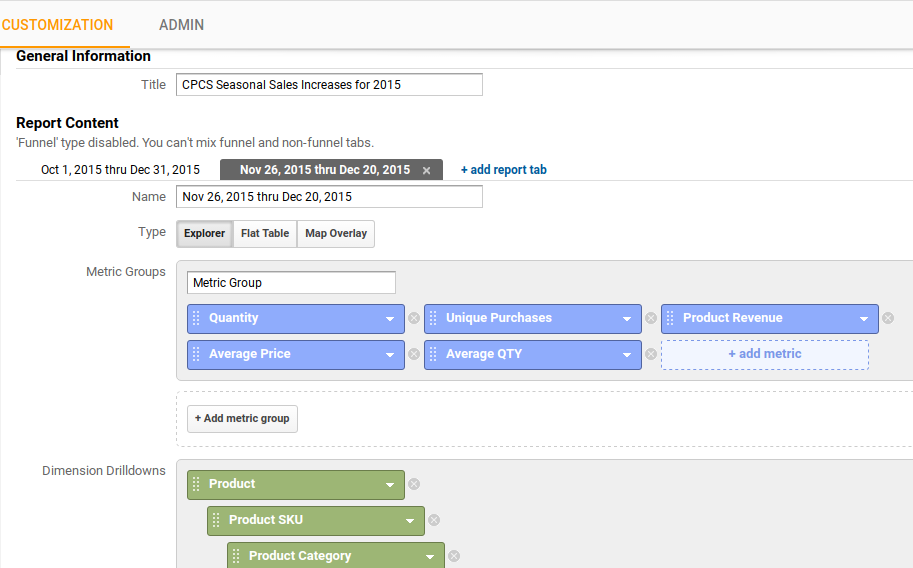
1. Title your report. Something like “seasonal sales increases [date]” is fine. (Unless you’re a custom reports guru with strict naming conventions and a plethora of reports to sort through.)
2. Under Report Content, create two report tabs named by the date ranges you want to compare. Try starting with:
(Note: This changes from year to year, so make sure the Black Friday start date is accurate for the most recent year. Also note changing the names of these tabs will not automatically update your report.)
3. Under each tab under Type > Explorer, add in the following metrics:
4. Under Dimension Drilldowns, select the following:
So far, your report specs should look like this:

5. Save your report and access it on the main Custom Reports page.
6. Time to download! But first–a couple important tweaks.
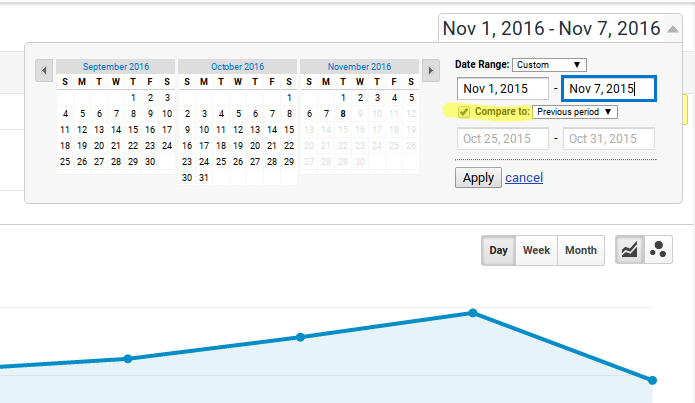
In order to calculate % change over time, check the Compare to Previous Period option (highlighted below).

Then, sort by Unique Purchases to ensure that you have the top volume drivers at the top.
7. Export and download as a CSV file, then open in Excel.
Columns A-G should be filled out already. In cell H8, paste the formula below:
=IF(MATCH($A8,$A9,0),(D8-D9)/D9,””)
Drag the formula down in that column and you’ll see the percent change in Unique Purchases for each product.
If you want do the same thing for Product Revenue, just drag the formula to the right (into column I), and it will load up automatically.
You’ll notice a lot of #N/As, but you can clean up your report with these simple steps:
Voila. You now have product-level data and percentages to show you exactly what’s selling holiday-over-holiday.
So you’ve pulled all the data and you’ve sorted it twice. How does this translate into your strategy?
“It depends on what everything else looks like–but products that are converting above 100% are obviously going to catch my eye,” says Kerner.
“Get a sense for the products that could be the movers and the shakers of the season, so you can monitor those throughout the quarter, and make sure your bids are competitive.”
Our experts also recommend you take a look at both the product-level and category-level results, particularly if you have a lot of products. All of that data is available in your report, and can be directly applied to your bidding strategy for particular categories–whether that’s up or down.
If you’re planning on launching a product and you’re wondering about the right timing, check your custom velocity report for similar products. You might be able to anticipate how your new product will perform during a particular holiday.
However, Kerner also points out that a product’s success–especially in apparel–can be tricky to predict, so always keep your target customers in mind.
How would you use this data? Have you had success with another type of custom report? Share with us in the comments.
