7 AdWords Reports to Improve Q4 Sales on Google


Q4 2013 saw Google paid search grow 19%, with a 15% increase in paid clicks from the previous year.
Are you prepared for Q4 AdWords increases this year? Below are key AdWords reports to help you optimize and prioritize your AdWords campaign for the holiday season.
Here are 12 performance reports you should be running for before Q4 for AdWords this year:
Top sellers are important to leverage all year, but especially useful to leverage during Q4.
Run a top movers report to identify any changes in clicks, conversions and cost for ad groups- whether positive or negative to identify items which are doing well, and those which you should decrease bids for.
To run a top movers report:
Login to AdWords, select Campaigns> Dimensions> Choose View> Top movers:
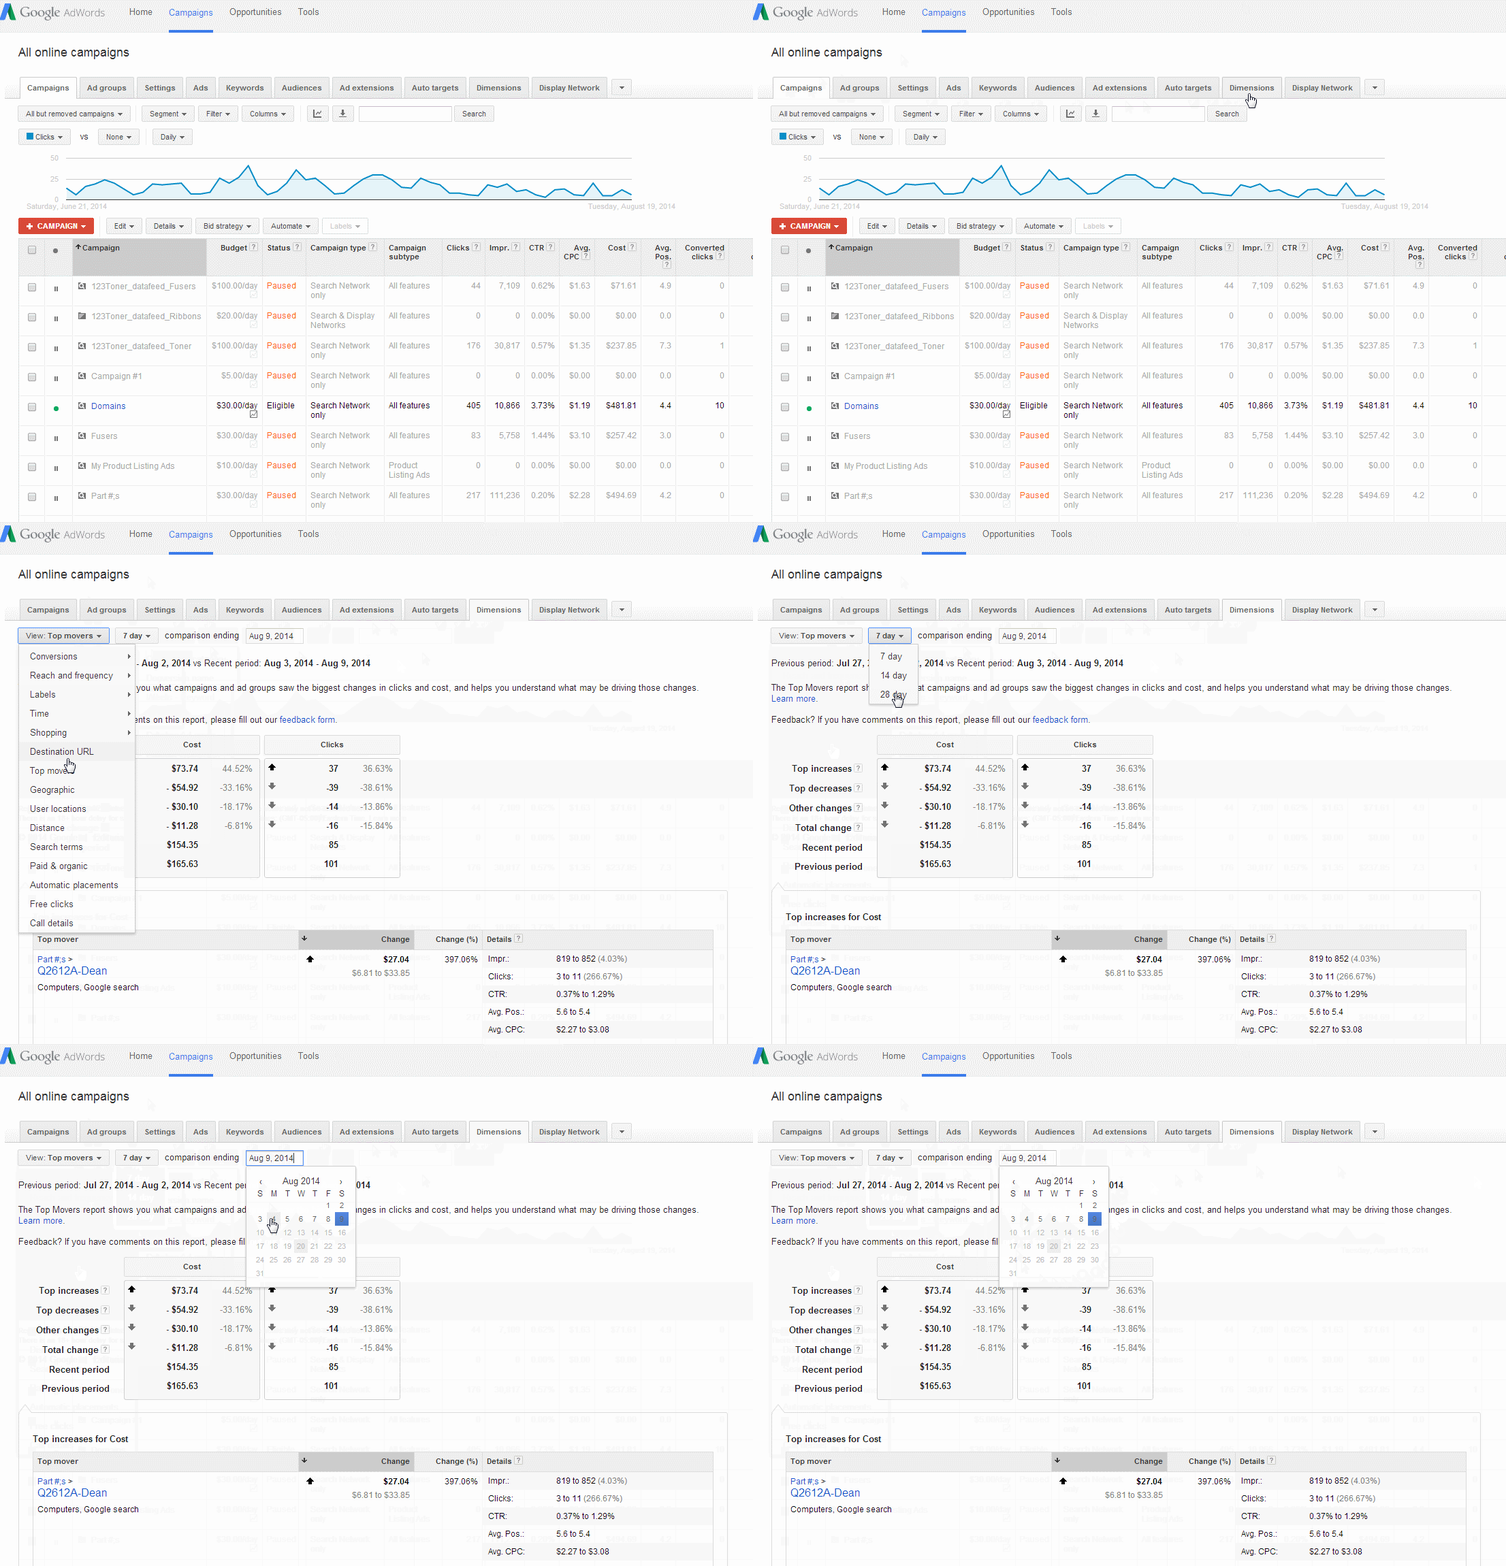
Be sure to choose a specific time period to compare performance (start date/end date).
Run an Ad Performance Report in AdWords to monitor your account status, Click Through Rate (CTR) and Average Cost Per Click metrics (Avg CPC).
To run an Ad performance report:
Login to AdWords, click Campaigns> Select the Ads tab:

Here you can view performance metrics such as Status, Campaign type, clicks and Impressions. Some top metrics to analyze are:
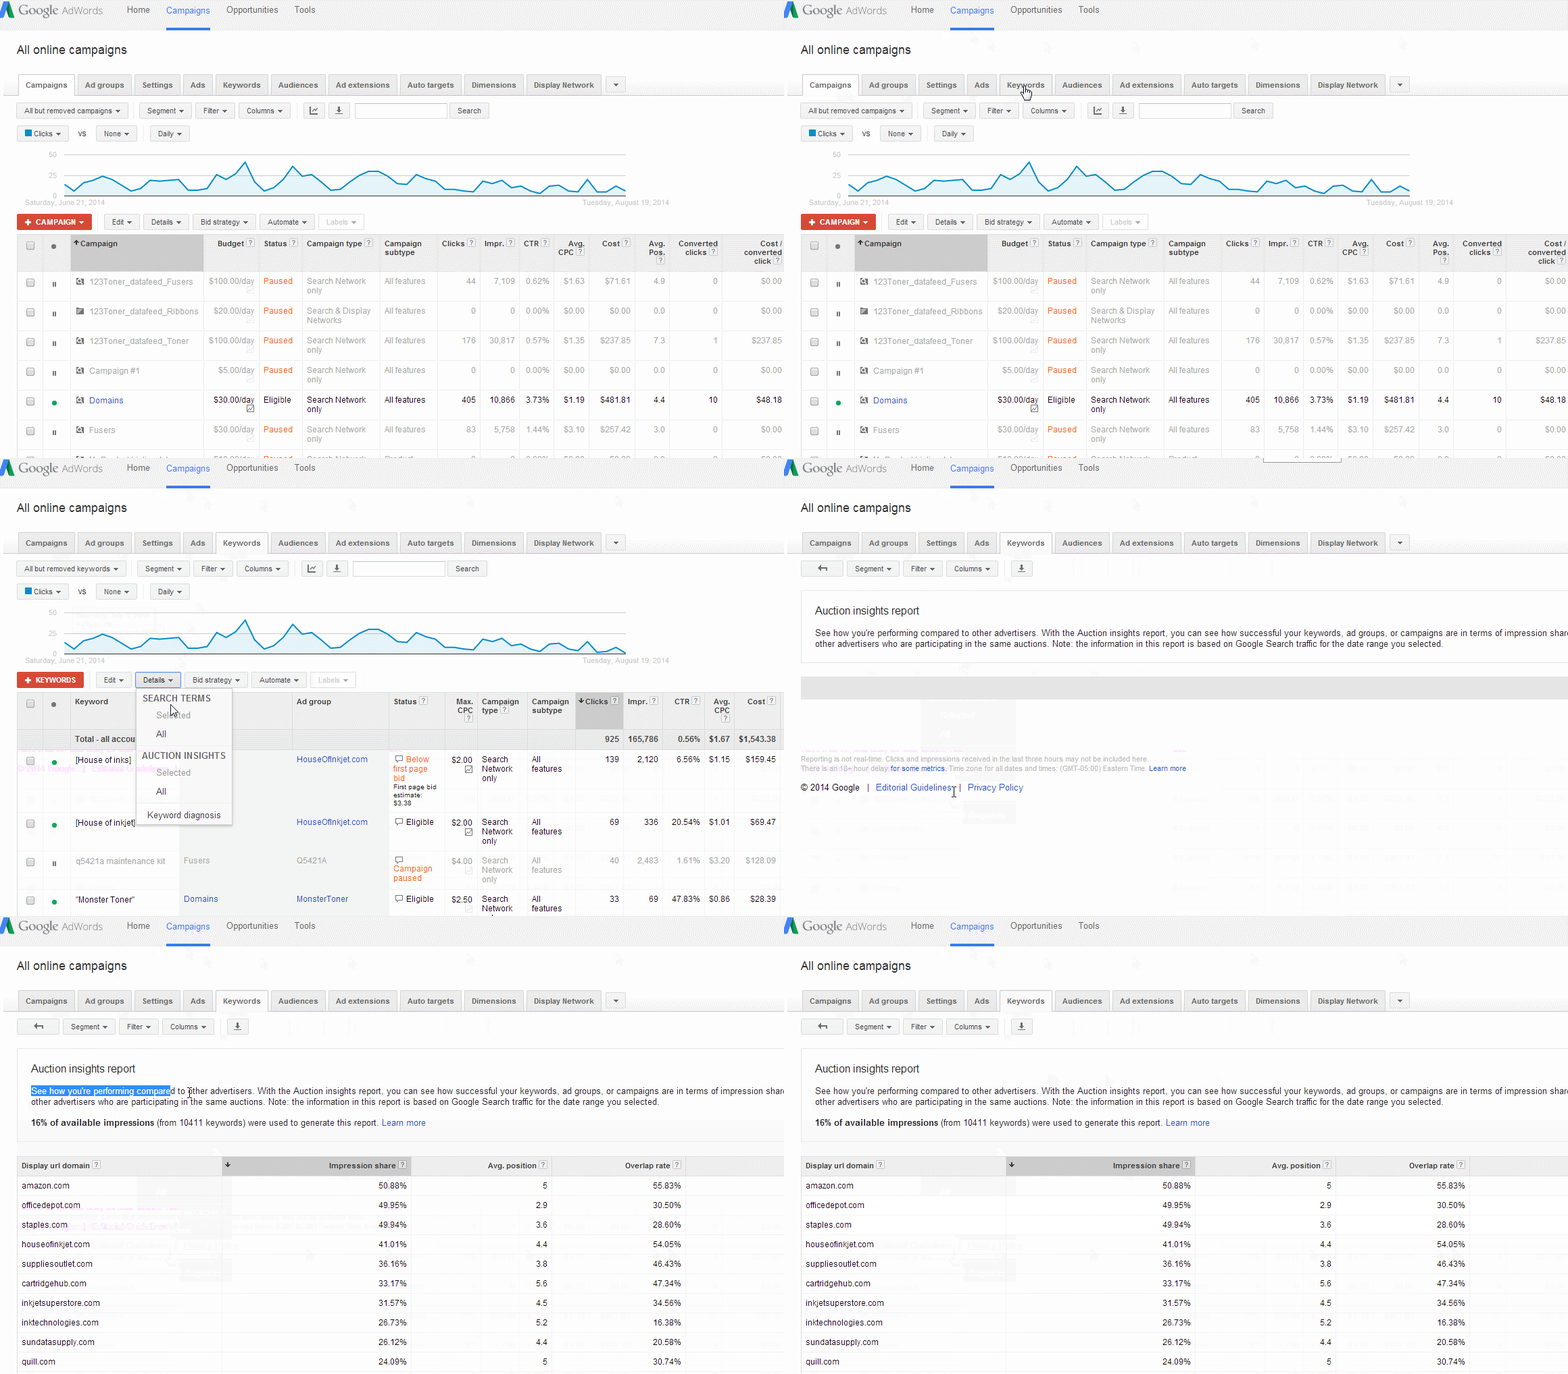
Use the Auction insight report to compare campaign performance in your AdWords auction to determine where your ads rank in search, and your ad share impressions alongside your competitors.
To run an Auction insight report:
Login to AdWords, select the Campaigns tab> Choose the Keywords tab> Choose your intended keyword(s) and select details in the statistics table> Click “All or Selected” under “Auction Insights” in the dropdown menu:
Run an AdWords keyword performance report to determine which keywords are performing well for your ad groups, and those which are not.
To run a Keyword performance report:
Login to AdWords, select the Campaigns tab> Choose Keywords:

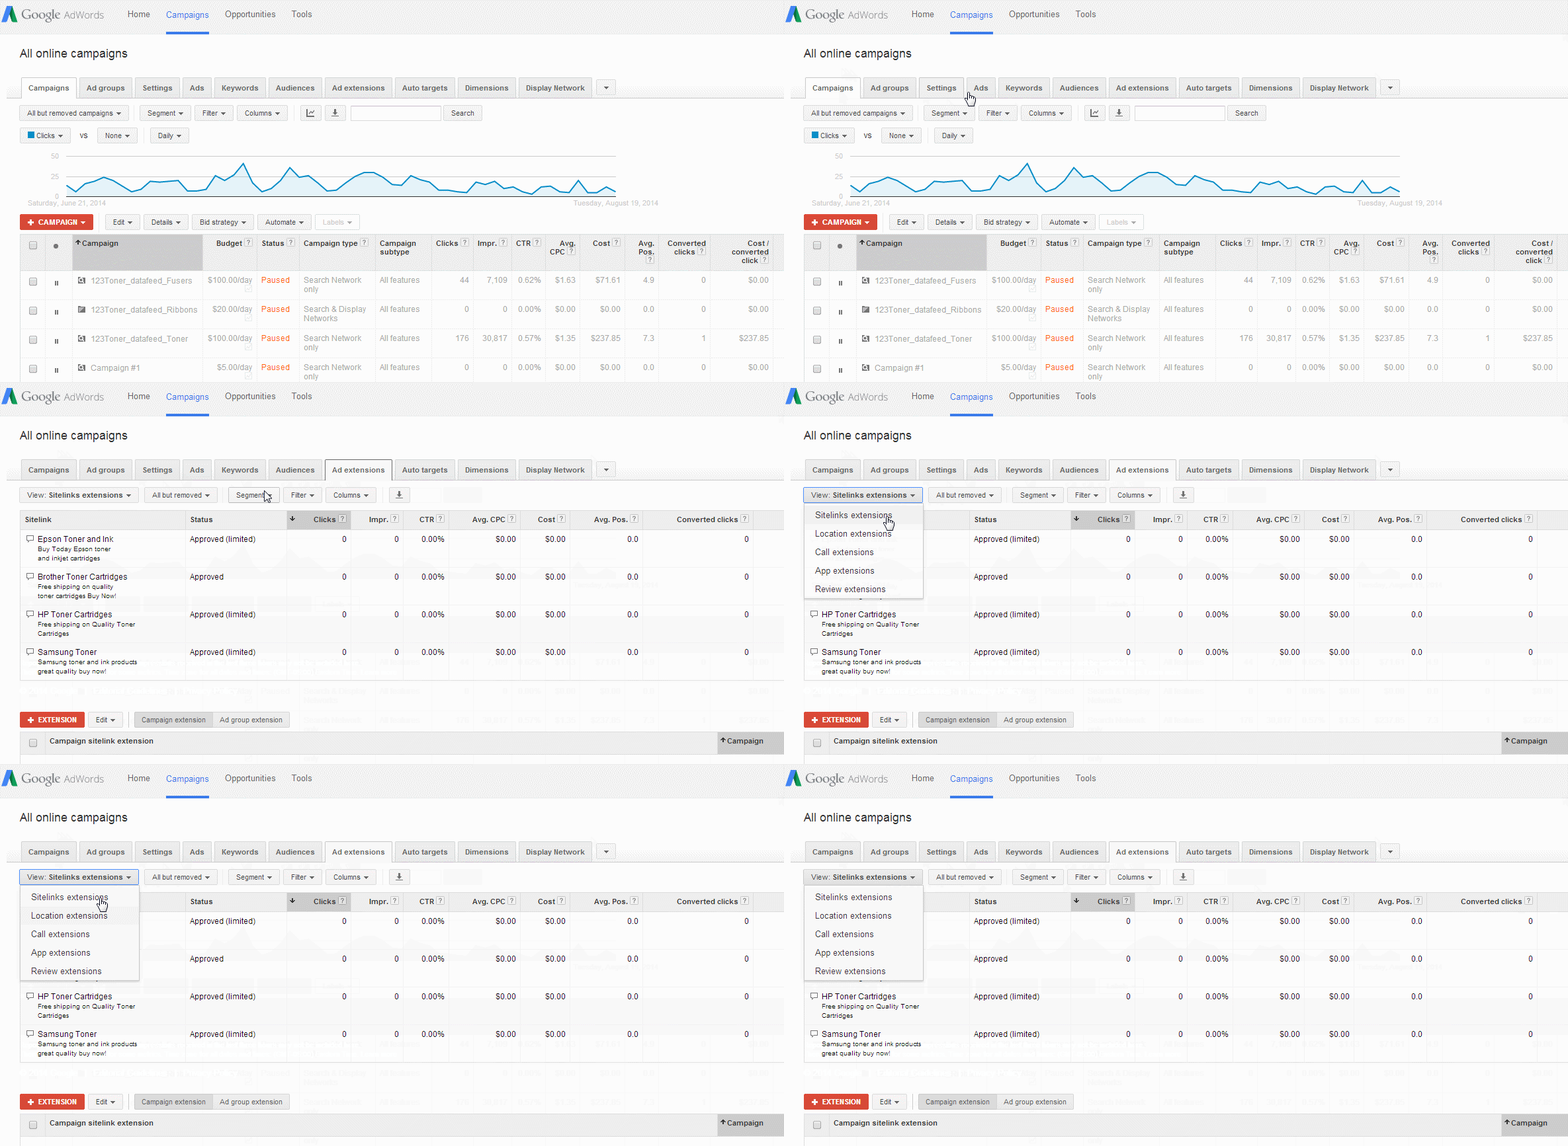
Run an Ad Extension Performance Report to measure the success of your ad extensions (i.e. phone number, website link) and tailor them for optimal sales during Q4.
To run an Ad Extension performance report:
Sign into AdWords, select the Campaigns tab> Click the Ad extension tab> Select view> Choose “All online campaigns” or a specific campaign:
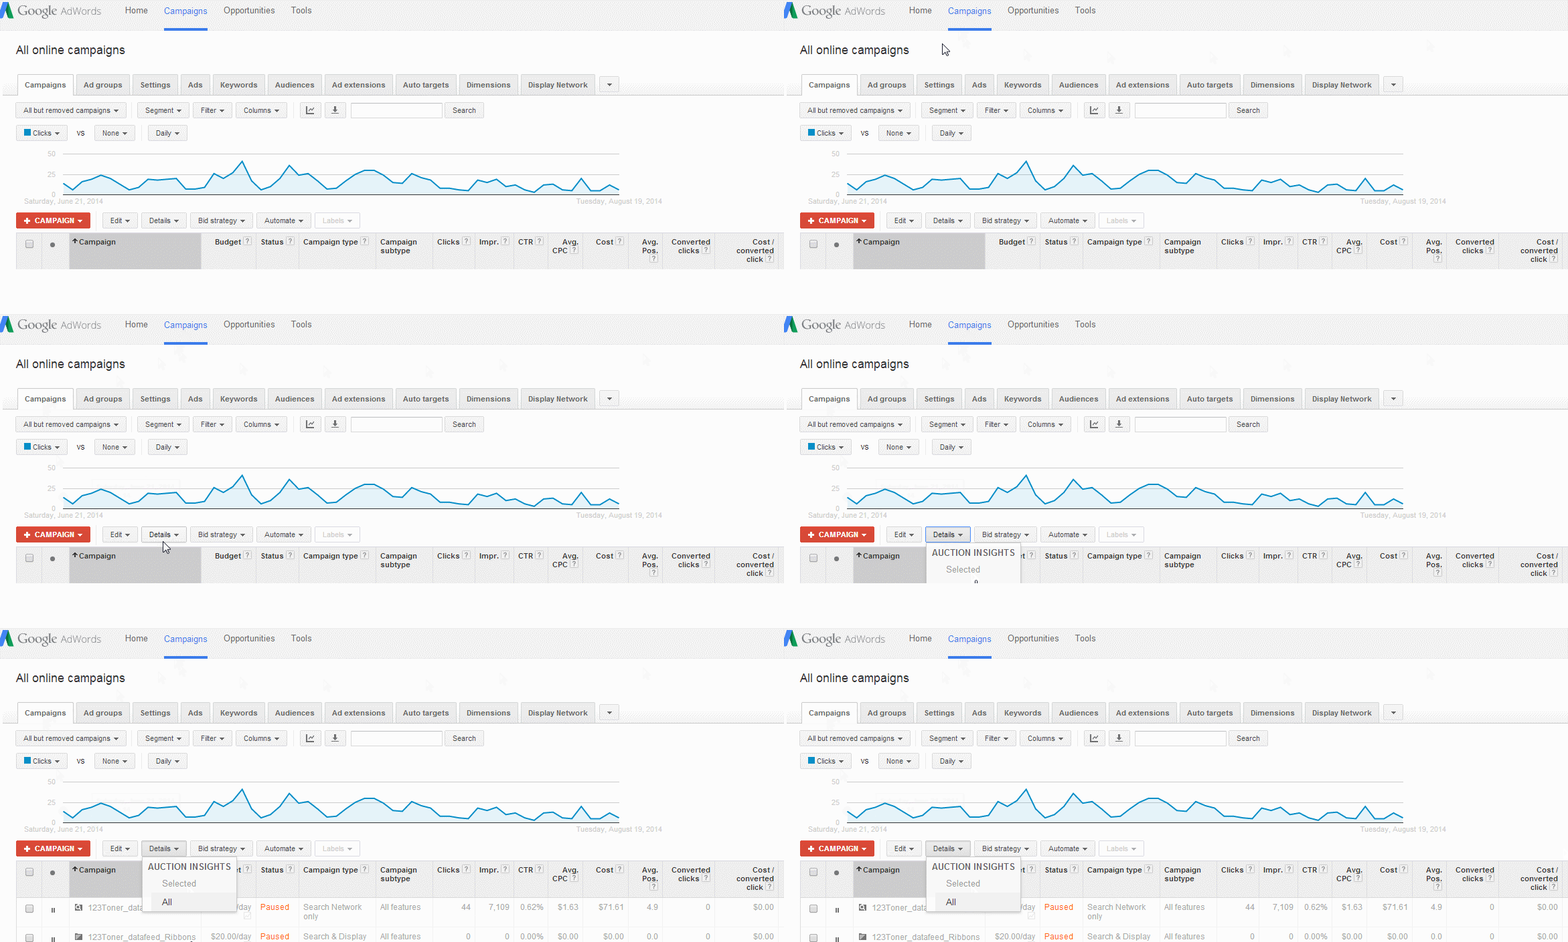
Run a search terms report to identify which searches trigger your ads. Use this data to analyze ad performance and refine ad impressions and ad spend with additional keywords and negative keywords.
To run a search terms report:
Login to AdWords, select the Campaign tab> Click “Details” under the Keywords tab> Select “All”:
You’ll want to regularly analyze your AdWords ads to look at Clicks, Impressions and Click through rate (CTR) for your overall performance goals and ROI.
To view your campaign performance:
Login to AdWords, view campaign metrics under the campaign tab:
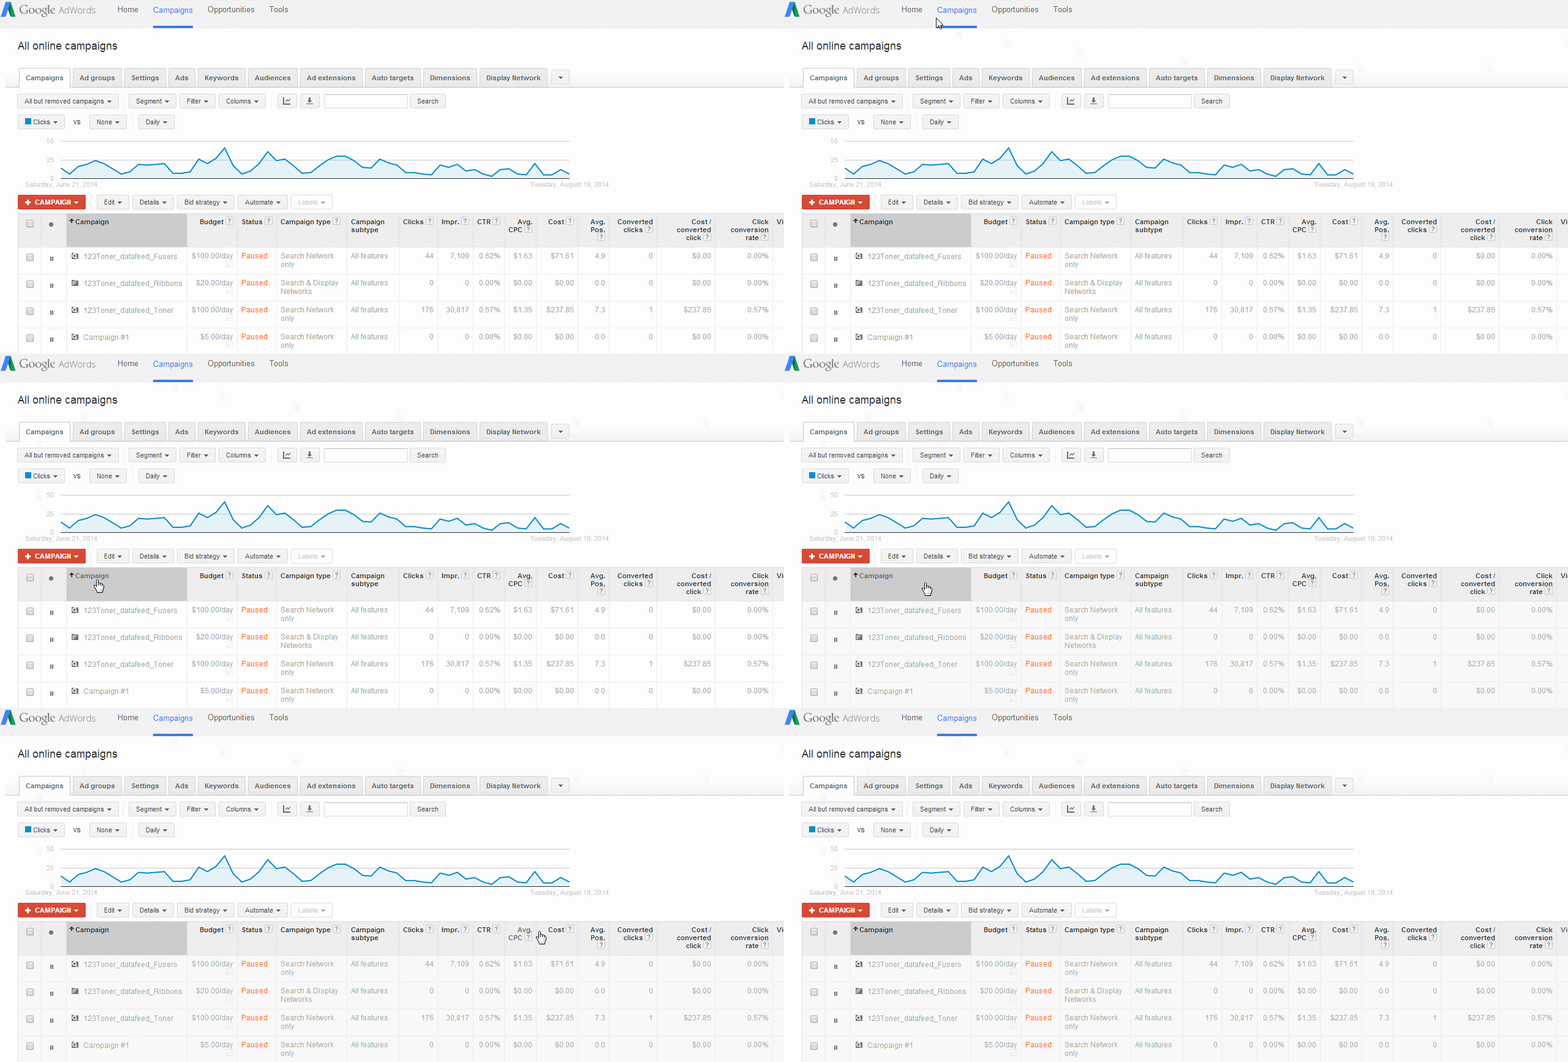
Depending on your Q4 goals, you may want to tailor your statistics table for specific metrics.
Remember most AdWords reports can be downloaded as a document, emailed and scheduled.
Understanding your performance data for AdWords is a key element for holiday success on Google. Be sure to perform the above reports for AdWords prior to Q4, during the holiday and moving into Q1. You may also want to look back on Q4 performance and top sellers on AdWords for 2013 to inform your campaign strategy.
