How to Evaluate Your ASIN Report in Amazon Seller Central

Creating and analyzing standardized reports is a standard, good practice for any advertising or sales channel – and this is especially true for Amazon.
The approach defined here by Pat Petriello, Senior Marketplace Strategist at CPC Strategy is intended to guide sellers from taking an ASIN Report and efficiently analyzing it for meaningful takeaways.

“What we are looking for here are both recent trends and historical precedent. We also want to see how the most recent week compares to the average week over the last 2 months,” Petriello said.
Questions sellers should ask if sessions are down
1. Check for the current inventory levels for top selling products.
According to Petriello, “No matter what efforts we take with Sponsored Products, content, catalog structure, title optimization, and FBA recommendations, it won’t matter if the seller doesn’t have inventory to sell.”
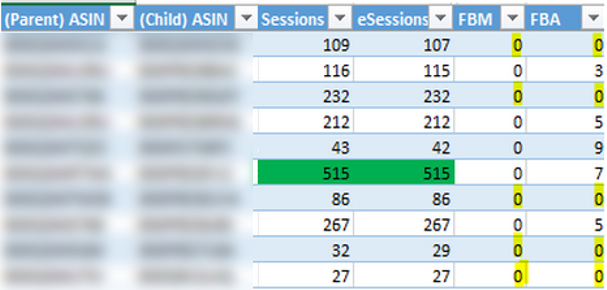
Example: The screenshot below indicates that 5 of the 10 top best selling products over the last 60 days currently have no stock available. Where sellers will expect to see the impact of this condition is in weekly revenue and sales. They can also use this to project when potential dips might be coming as top selling products are at risk for selling out.

2. You also want to look to see how heavily leveraged the seller is on a handful of ASINs.
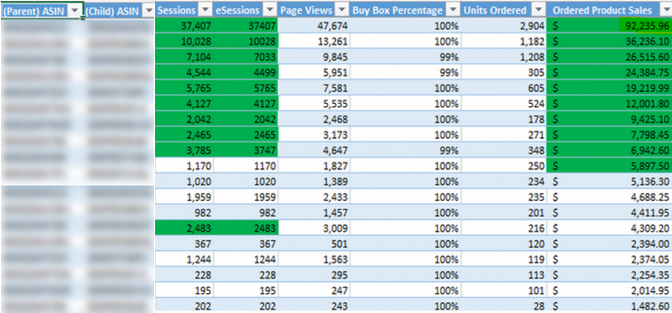
Example: Below the top ASIN generated more revenue in the same time frame than did the 3 next best selling products combined. This indicates that not all ASINs are equal within a seller’s catalog. While the sellers approach is to give every product a chance to succeed, small changes in the performance of an ASIN which has a massive impact on the total account performance will overshadow more significant performance changes for ASINs that are not as strong.

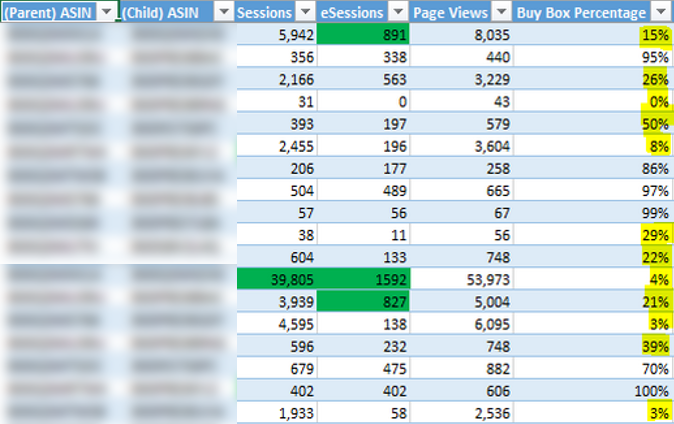
3. Sellers should look at the buy box ownership for the ASINs driving channel performance.
One of the main drivers for channel performance is how much buy box they own for the ASINs which are most important to the channel. This also drives their strategic approach.

The key to interpreting reports is the output of the combined effects of discoverability and buyability factors such as:
Discoverability Metrics
Buyability Metrics
“For example, if a seller’s revenue is decreasing steadily over the last few weeks, and they see that sessions are also decreasing, they know they need to focus on their buyability levers to stabilize and grow the account, ” Petriello said.
“It’s important to remember that the data tells sellers where they are strong, where they are weak, what is working, what needs immediate attention, and what needs long term focus.”
