Media Update: AMC+ Ad-Supported Tiers, NBA Viewership, and Declined Retail Spending


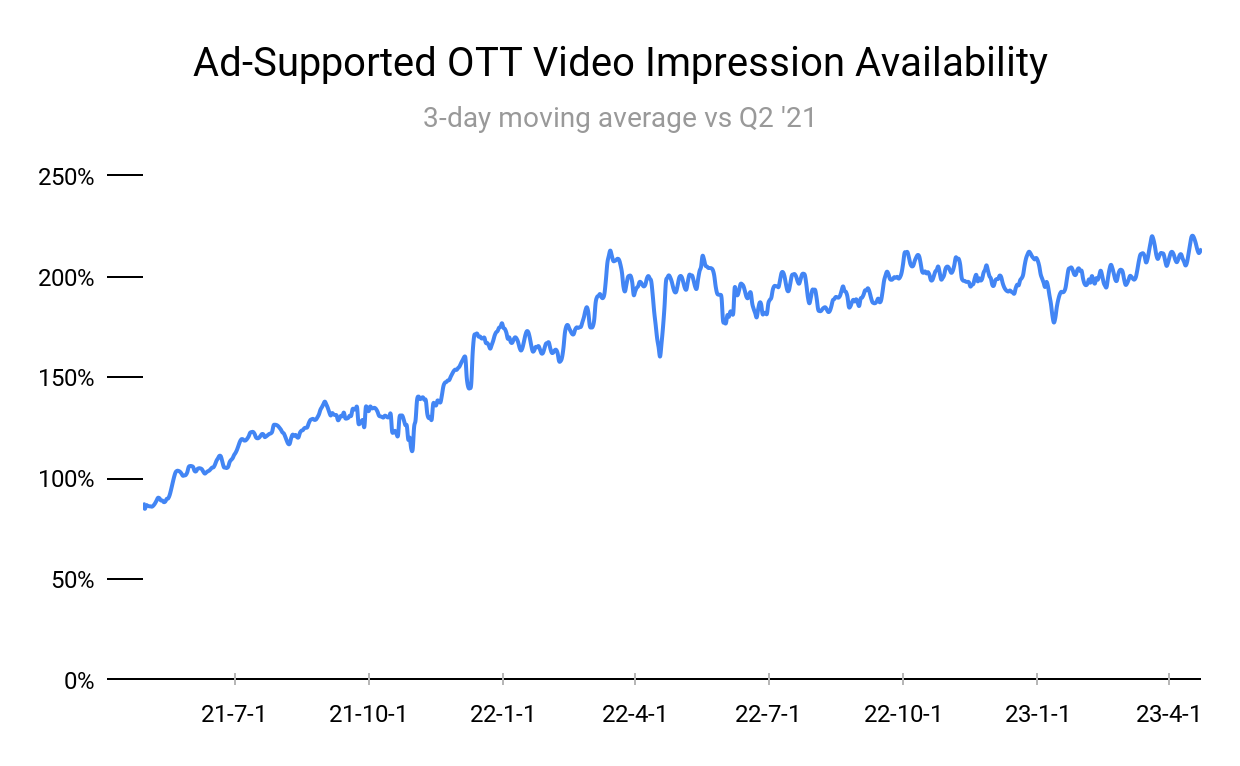
After rising in mid-March and stabilizing, ad-supported video supply ticked up once again in April.
Industry Notes (Video)
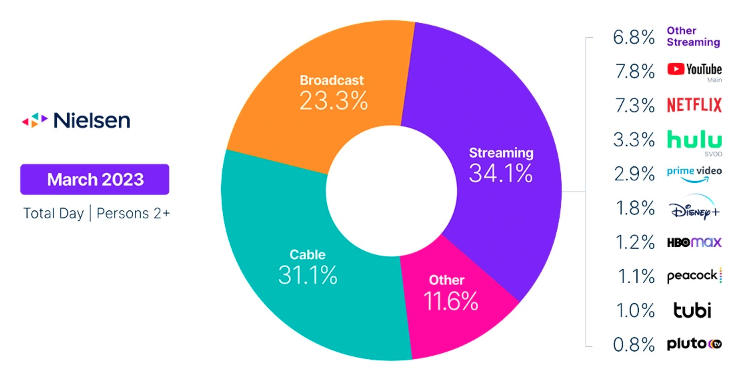
1. Total TV usage declined 2% MoM as a result of seasonality, according to Nielsen’s March edition of The Gauge. Despite record low viewership in the final stages of the NCAA men’s basketball tournament, March Madness boosted cable’s share for the first time since last year’s tournament. Relatedly, streaming declined 0.2 share points, the first dip since August 2022. Seasonality is the culprit here – streaming usage is still up nearly a third over last year, and it seems rather unlikely that it will continue to lose share in any significant amount to broadcast or cable. Other notable points:
2. At the end of last year, following the launch of Netflix and Disney+’s ad-supported tiers, the streaming industry definitively turned towards advertising. But the move has been an incremental process – consumers obviously prefer their video content free of ads, and streamers can still make decent revenue by hiking the price of ad-free content. However, as churn rises, streamers have a pressing need to increase revenue where possible. With Hulu, HBO Max, Paramount+, Peacock, Netflix, and Disney+ all serving ads, it should come as no surprise that AMC+ will be launching an ad-supported tier in the fall. The company also announced a new insights and data targeting platform, Audience+, which allows advertisers to target segments across linear, VOD, and streaming.
AMC is taking a multi-pronged approach toward streaming, not dissimilar from HBO. Both networks have seen revenue growth suffer because of the decline of linear television, and are licensing out their original content to free ad-supported TV (FAST) platforms to address this. AMC has struck deals with Vizio and Roku to bring on-demand content and linear programming to their FAST platforms. This is something that Netflix does not do, and Disney is just beginning to explore more – but given the success of FAST platforms, we might expect this strategy to become a mainstay in streamers’ playbooks. | Fierce Video
3. Subscription video-on-demand (SVOD) services are still experiencing steady churn, with the subscriber turnover rate standing at 44% in 2023, up from 37% in 2022. For Gen Z (born 1996 and after) and millennial consumers (born 1981 – 1996), those numbers jumped to 57% and 62%, respectively. However, it is important to note that churn can fluctuate over time and may be influenced by various factors, such as pricing, content, and user preferences. In this case, half of the surveyed subscribers said they are paying too much, indicating that pricing is a significant factor affecting subscriber retention.
The average US household now subscribes to four streaming services, up from three in 2020. Despite this trend, 46% of respondents said they have canceled at least one streaming service in the past year. This suggests that “content fatigue” may be a potential driver of subscriber churn, with 43% of respondents feeling overwhelmed by the amount of content available to them. This feeling could be especially true for younger generations, who are more likely to view their entertainment options holistically and may be quicker to switch between different platforms based on their preferences.
Millennials spend more than any other generation on paid streaming video services — an average of $54 per month, compared to the overall average of $48 per month. They churn through SVOD services at the highest rates and are more likely to cancel paid gaming services (26%) and paid music services (39%). About 60% of households are now using a FAST service, and around 45% say they watch more ad-supported streaming video services than they did a year ago, whether paid or free. As streaming audience composition evolves, we can expect to see innovation in their offerings to attract and retain subscribers. | Deloitte
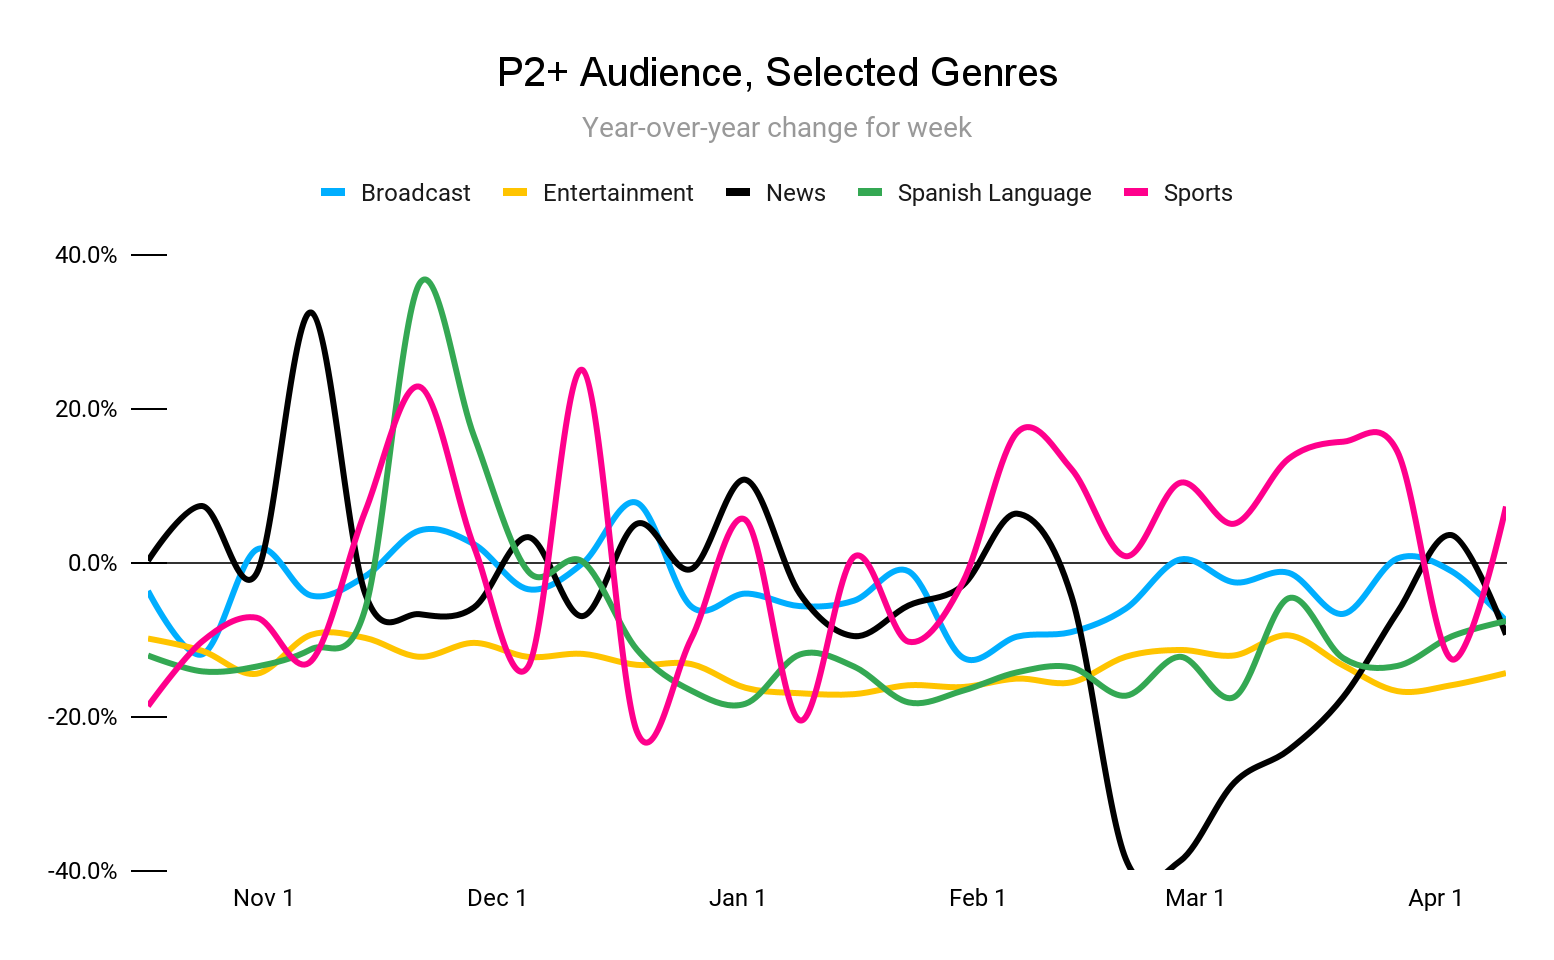
Sports viewership rebounded last week as the NBA playoffs kicked off. The YoY decline in news viewership likely reflects the ongoing coverage of the invasion of Ukraine, which began in late February last year.
Industry Notes
1. Those of you who follow the “currency wars” may recall the shocking moment, back in September 2021, when the Media Ratings Council (MRC) suspended accreditation of Nielsen’s national and local TV measurement services. This followed many months of simmering tensions (if you’re interested in the play-by-play, see here, here, and here) and left the industry without a single accredited service for measurement of TV audience delivery.
In the meantime, the major networks wasted no time in attempting to cultivate a post-Nielsen world; for years, the networks have chafed under Nielsen’s monopoly, which they view as extortionate and inaccurate. Every major network group declared its willingness to transact on alternate currencies, and the networks even formed the Joint Industry Committee to promote the adoption of Nielsen alternatives and have begun establishing an independent panel, striking directly at Nielsen’s moat.
For all this upheaval, relatively little has changed – while alternative currencies from the likes of Comscore and iSpot are theoretically accepted by major networks, none have gained major adoption and Nielsen has remained the default. And now, nineteen months after its very public rebuke, the MRC has reinstated accreditation for Nielsen’s national TV measurement. While this patches up a black eye for Nielsen, there’s a lot it doesn’t do – it doesn’t restore accreditation of its local TV measurement, nor of Digital in TV Ratings, and it certainly doesn’t address any of the concerns around Nielsen One, the big-data-fueled replacement for its incumbent panel-based measurement products that is slated for introduction ahead of next year’s upfronts. While the MRC accreditation is surely a welcome relief, Nielsen’s key battle is over maintenance of its monopoly with every other industry participant arrayed in opposition. | AdAge, AdExchanger
2. Now that we are firmly into the NBA playoffs, it is a good time to take a look back at the season and examine how viewership compares to previous years. The NBA averaged 1.59 million viewers across ABC, ESPN and TNT during the regular season, the fifth least watched season in the past 20 years. This is not great for the NBA (especially because out-of-home viewership is only counted for recent years), but it is not terrible when you consider the decline of primetime viewership. In fact, regular season viewership has been fairly resilient: in the past five years, the league saw viewership fall only 16% while primetime viewership fell 35%.
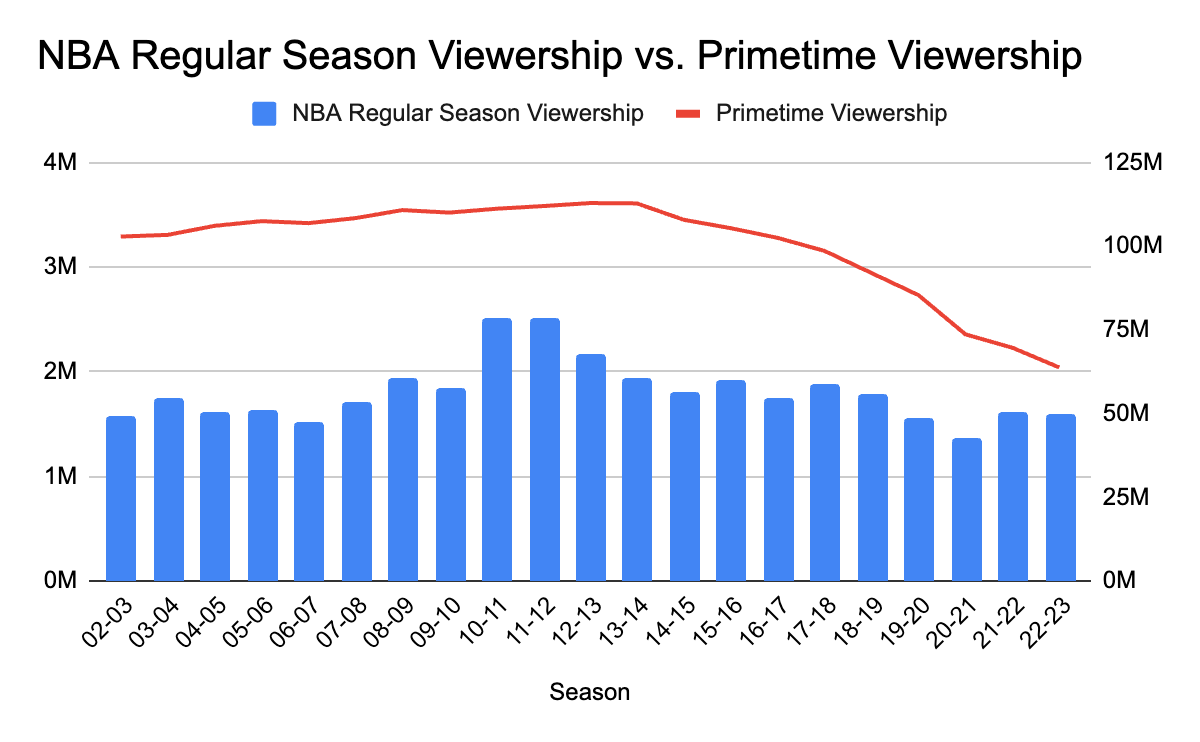
As far as reasonable comparisons can be made, the NBA averages more viewers per game than MLB (936,000) and the NHL (470,000). Although it is true that MLB and the NHL increased their average YoY this season, there is no meaningful evidence that the NBA is losing share by a concerning amount. Further, playoff viewership this season is up 3% over last year, and opening weekend was the most watched since 2011. The durability of live sports viewership should not come as a major surprise to readers of this newsletter, as we frequently discuss this topic with regard to the NFL. As the number of large audience live events dwindles, it is clear that sports will continue to be a success in this domain. | SMW, SMW
1. Google recently published a white paper detailing the results of an experiment it ran in Q1 comparing third-party cookies (3PC) to privacy-preserving signals. With the Chrome browser the last bastion of the 3PC, and Google having announced its sunsetting of the technology in Q3 2024, the heat has been on to develop and demonstrate alternatives that respect user privacy without sacrificing effectiveness for the advertisers that fuel Google’s revenue machine.
Way back in January 2020, Google announced that it would follow in the footsteps of Apple and Mozilla by removing 3PC from its popular Chrome browser. Since then, it has been working on developing privacy-preserving substitutes while navigating pressure from governmental authorities over the anti-competitive implications of cookie deprecation. In October of 2020, Google announced FLoC (Federated Learning of Cohorts), an approach based on grouping users with sufficiently similar browsing histories into targeting cohorts. Then in January 2022, Google ditched FLoC due to concerns over user identifiability and introduced a replacement, the Topics API, that tags users with a small number of interests topics based on their browsing behavior.
The question looming over all of these technical developments has been, How well will the replacement approaches work? Google aimed to address that question as squarely as possible with this latest experiment, which found privacy-preserving approaches evinced relatively little degradation relative to standard 3PC targeting, yet several caveats remain. Specifically:
Now for those caveats. Firstly, the experiment was run on display inventory only, not all of Google Ads; it is unclear how these results will generalize beyond display. Second, the cookie-less arm still used cookies for attribution, retargeting, and frequency capping; in a true post-cookie world, these signals would not be available. Third, the experiment was not a head-to-head matchup of 3PC and the Topics API; the treatment arm of the experiment combined the Topics API with additional contextual signals and publisher-provided IDs (in fairness, this is likely how a post-cookie apparatus would work, so the comparison is relevant). The full experimental design looked as follows:
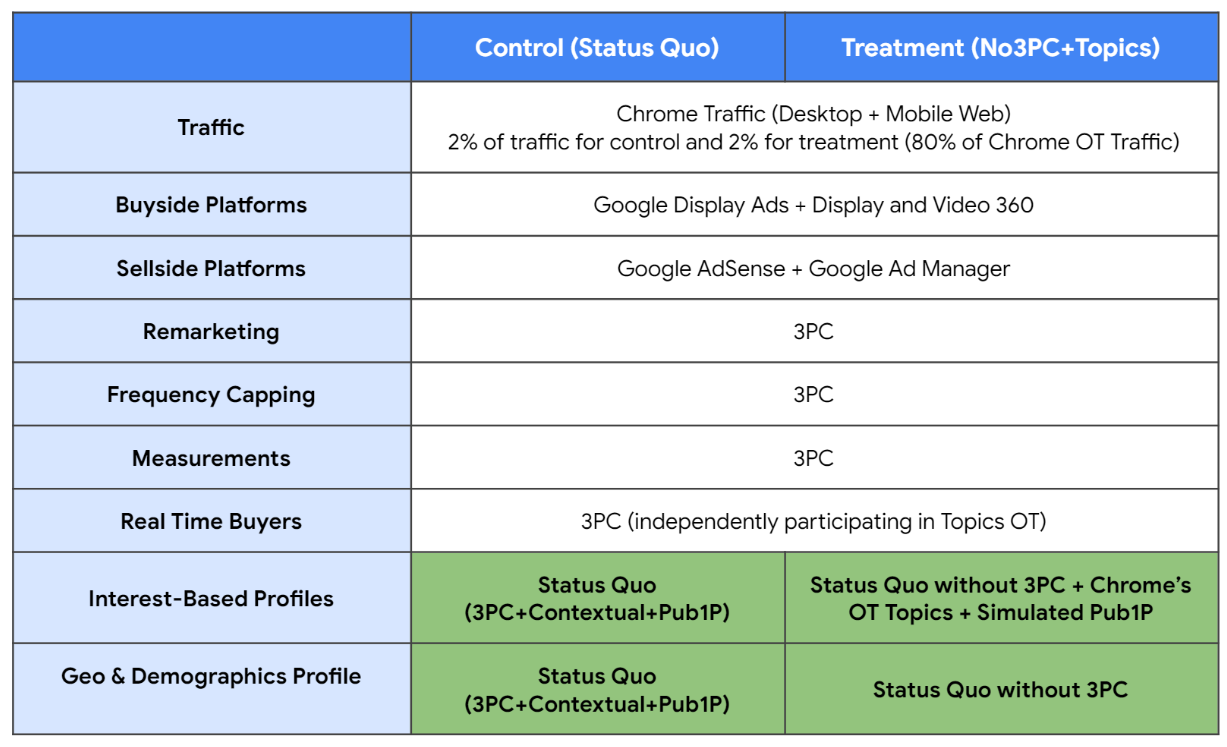
A significant takeaway from the experiment was the value-add of Google’s machine learning technologies – across almost all metrics, the privacy-preserving approach performed much better when paired with ML than without. This will undoubtedly be a point heavily emphasized by Google when it finally comes time to move on from cookies. | Google Ads & Commerce Blog, AdExchanger
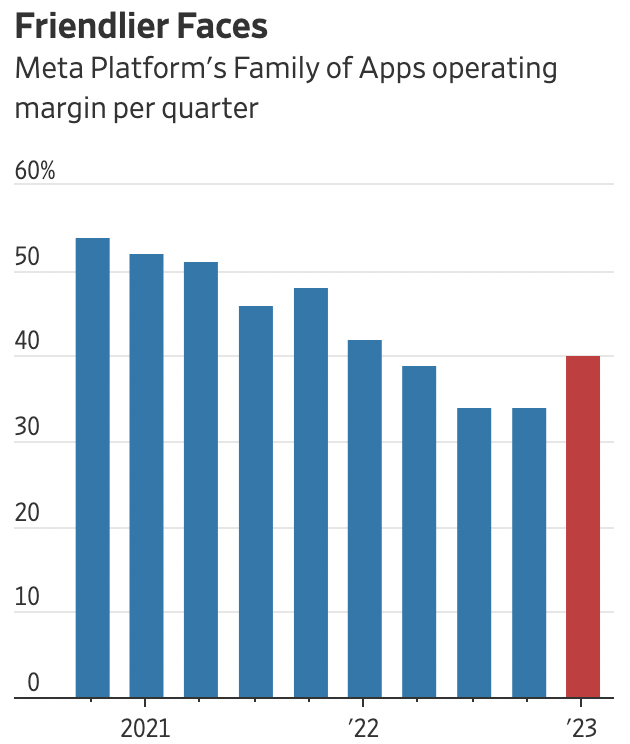
2. Tech earnings kicked off this week, bringing a mixed bag of news for streaming, social media, and advertising.
1. Last week we told you about slowing credit and debit spending from BofA, a possible leading indicator of a broader pullback in consumption. With March retail figures now in, consumers did indeed cut back on retail spending for the second consecutive month, and by significantly more than the February decline.
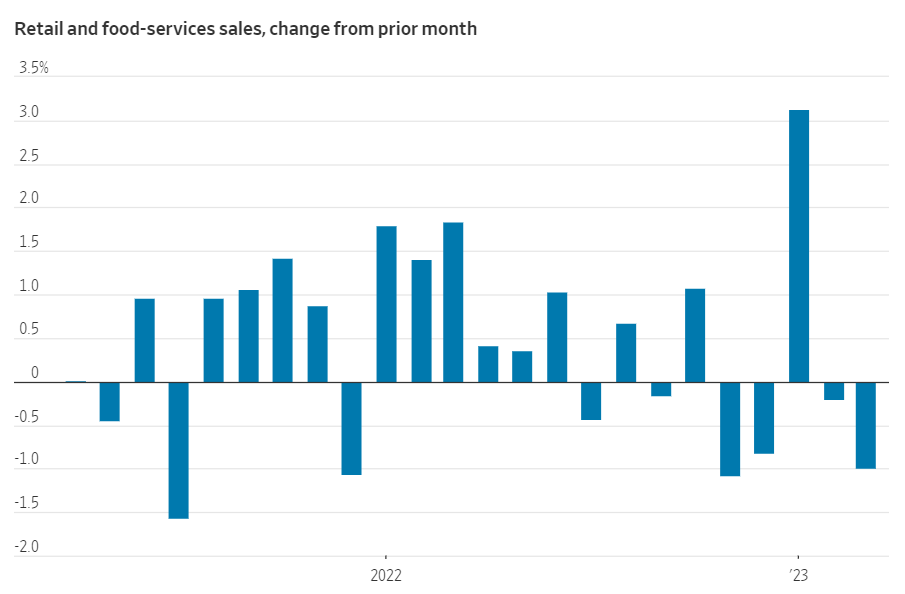
This is yet another indication of a cooling economy, with slowing hiring the other major indicator moving in the same direction. The largest single driver of March’s consumption slowdown was spending at gasoline stations, which fell by 5.5%; this seems to reflect a genuine reduction in consumption, since average gas prices actually increased slightly from month to month.
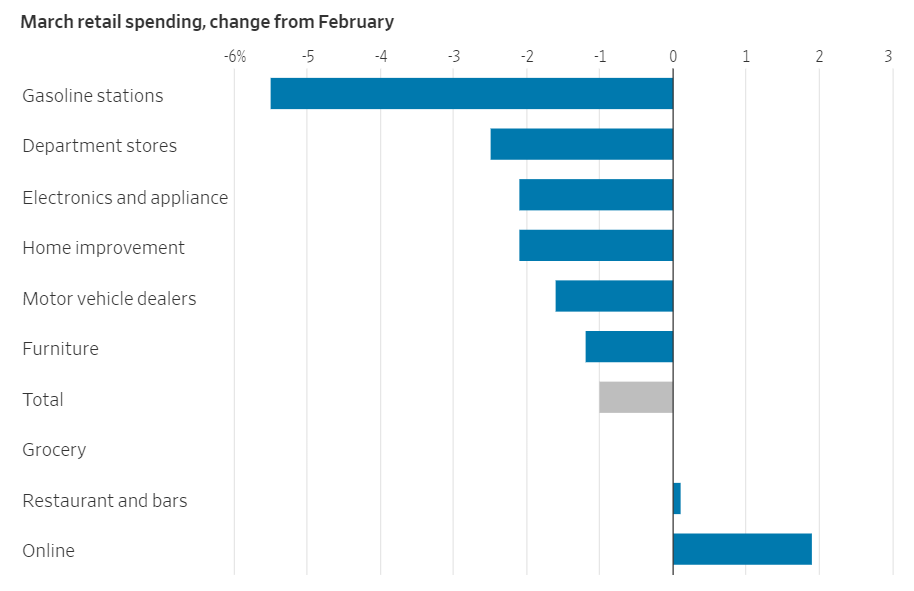
Notably, online sales increased by almost 2% MoM, by far the largest gain of any measured category.
It’s important to contextualize where we are in terms of post-pandemic consumption: while consumers have pulled back a bit for the last couple of months, consumption is still way above trend – the pre-pandemic trend line would put March’s total consumption at just over $500b, while the actual figure was just under $600b:
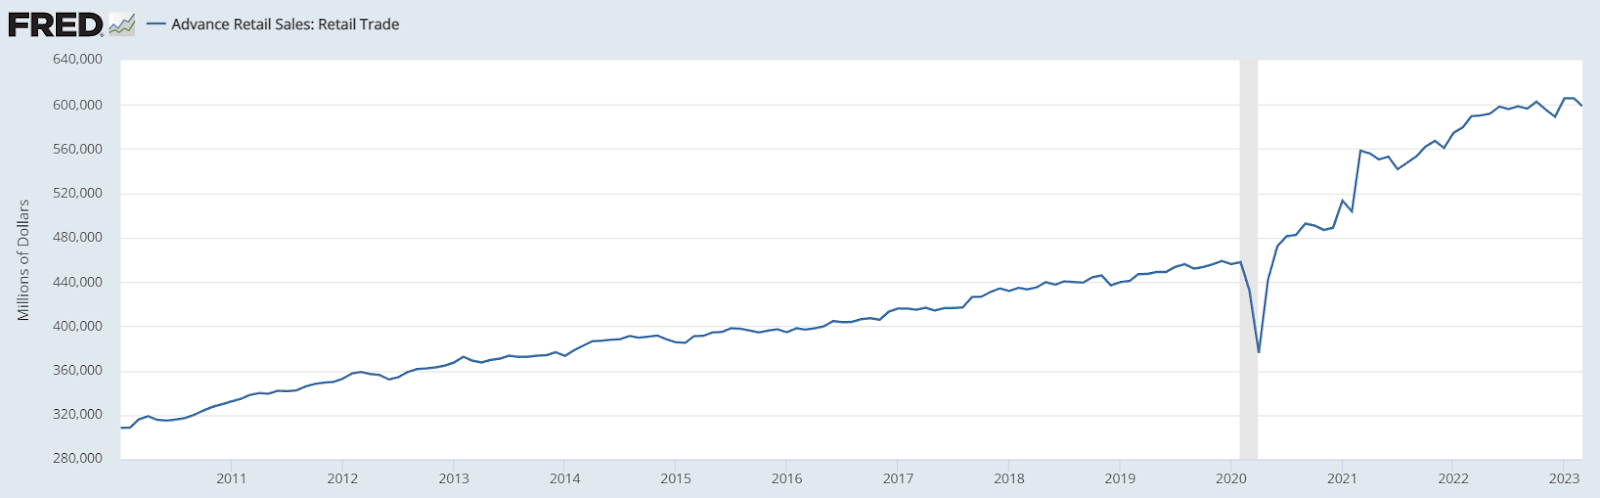
Because the productive capacity of the economy hasn’t increased correspondingly, the predictable result is the unpleasant inflation, and consequent rise in interest rates, that we’ve experienced over the past two years. Thankfully, inflation also seems to be cooling somewhat, but the correction likely has some ways to go. | WSJ
2. To the above point, several major brands are reporting that consumers largely absorbed price increases in the first quarter of 2023. McDonalds, PepsiCo, Procter & Gamble, and Kimberly-Clark all raised prices by 10% or more in Q1 YoY and beat analysts’ expectations for sales. Despite this, there is far from a consensus on the health of American consumers: AT&T and Verizon saw demand slow, Constellation Brands (Corona beer seller) saw sales growth slow, and Whirlpool saw sales fall 5%. Executives at many companies are signaling that price hikes will slow later this year, as concern over an upcoming recession weighs heavily. However, as General Motors finance chief Paul Jacobson noted, “Everybody sees [price] declines around the corner. That corner just keeps getting further and further out.”
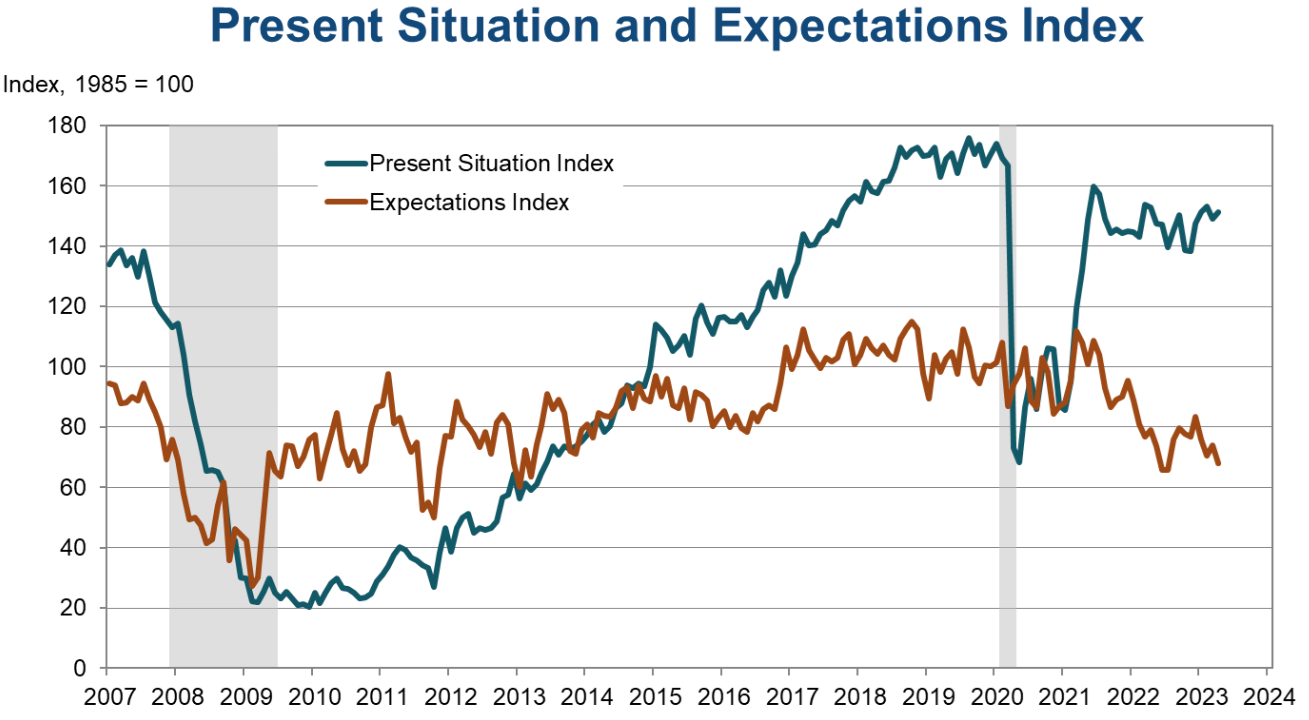
As an additional insight, consumer confidence fell to its lowest point since July of 2022. Interestingly, optimism regarding the present situation ticked slightly up, reflecting improved feelings about the labor market, while six-month expectations fell. As the labor market cools down, we might expect to see consumer confidence fall as employment and wages are affected. | WSJ, Conference Board