Google Removes Average Position as a Key Metric


It’s official: Google has retired its Average Position metric in favor of a new set of prominence metrics announced late last year.
The Average Position metric was used as a reporting indicator of where a specific ad fell in Google search results.
Here are the new metrics replacing Average Position, their impact, and some examples of how the new metrics have worked with our accounts.
The removal of Avg. Position and creation of new performance metrics is good news for clients. The metrics do provide a more transparent picture of where the ads appear for both clients and their agencies. It also helps to show where the areas of improvement exist and allows search marketers to make optimizations in response to performance, ensuring their ads appear higher on the SERP.
Google continues to evolve how they display their search results, including the recent removal of right-hand rail ads and with the addition of more prominently placed Shopping ads.
In its latest move, Google recently determined that Average Position was a metric that was no longer needed. To improve transparency, Google added new metrics in November 2018 that provides a more accurate picture of where paid search ads appear on the SERP in relation to organic and other paid ads.
On September 30, 2019, Google removed Avg. Position altogether from their interface and will fully depend on the below performance metrics to provide a clearer picture of where ads appear and how often. Microsoft Advertising has confirmed they will keep the Avg. Position metric.
While the new metrics should provide a more accurate picture of ad placement, it will require more education for clients and other stakeholders to ensure all parties are on the same page.
The removal of Avg. Position should not impact performance directly but the addition of new metrics also means the arrival of new smart bidding strategies.
Google Ads has released multiple smart bidding strategies leveraging the new performance metrics which will be interesting to test. Remember that it’s always a best practice to keep a close eye on performance during the first few weeks especially after implementing a new bidding strategy to make sure everything is working appropriately.
1.) Search Top Impression Share
Shows the percentage of how many impressions on top you received out of the total eligible impressions on top (% of ad impressions shown anywhere above organic search results).
2.) Search Absolute Top Impression Share
Shows the percentage of how many impressions on absolute top you received out of the eligible impressions on top that were available (% of ad impressions shown as the first ad above organic search results → % of impressions where we served in “position 1”).
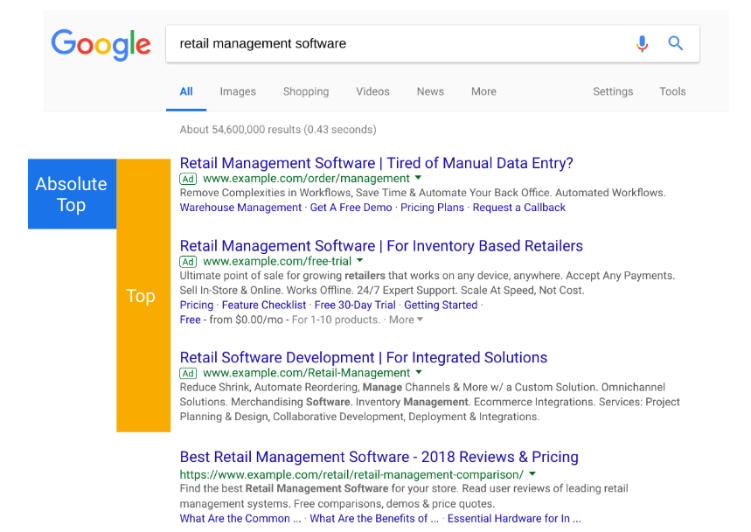
3.) Top of Page Rate
Shows the rate of total impressions received that appeared above organic results (% of your impressions were above organic search results, the “cousin” of search top impression share).
4.) Abs. Top of Page Rate
Shows the rate of total impressions received that appeared at the absolute top of the SERP (% of your impressions that were in position 1, the “cousin” of abs. top impression share).
Abs. Top Impression Share (Campaign Tab) vs. Abs. Top of Page Rate (Auction Insights)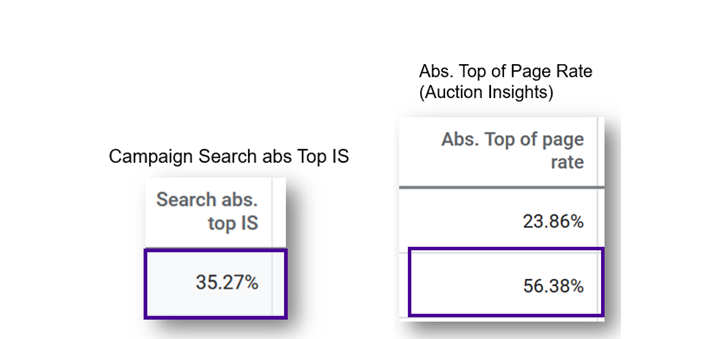
With an absolute Top IS of 35.27%, this client is showing up in “position 1” 35.27% of the time for impressions they’re “eligible” for.
With an absolute top of page rate of 56.38%, when this client does appear in the SERP, they’re in “position 1” 56.38% of the time.
What this shows is that even though this client is reaching position one more than half the time they appear, they’re missing position 1 in ~65% of the auctions they’re eligible for.
More agencies and clients will begin to rely on the new performance metrics and implement the associated bidding strategies especially for Brand and high-value Non-brand terms to increase visibility.
This will result in more visitors to the clients’ website and hopefully translate to stronger results.
Initially, you may see greater-than-normal fluctuations in cost-per-click and impression share performance as fellow advertisers adapt to these new metrics.
Gone are the days of using a single metric to analyze position performance. We now have several metrics that help tell a more complete story. With that said, the key going forward will be to understand how they all behave with one another.
As this change comes into effect, there are several steps you can take to ensure your accounts have a smooth transition.
This post was written by Joel Greenspan and Pratik Shroff.

Want to learn more?
Google To Sunset Accelerated Ad Delivery
Google Extends Same-meaning Close Variants To Phrase And Broad Match Modifiers