Google Algorithm Updates History & Timeline (2000-2023)


The only constant is change, and Google certainly takes that phrase to heart when it comes to algorithm updates. They are consistently making tweaks and updates to enhance their overall user experience and aim to elevate the quality of the search results they provide.
In this article, we’ll take a deep dive into the history of Google algorithm updates, how these launches affected SERPs (Search Engine Results Pages), and current advice from SEO (Search Engine Optimization) experts covering best practices to help you stay ahead of upcoming algorithm updates – yes, they’re inevitable.
First, let’s cover the major algorithm updates that shook things up in the search space.
While Google makes hundreds of updates every year, many are so small that they fly under the radar, but every so often, significant changes are made. These are some of the major players that had a substantial impact on SERPs.
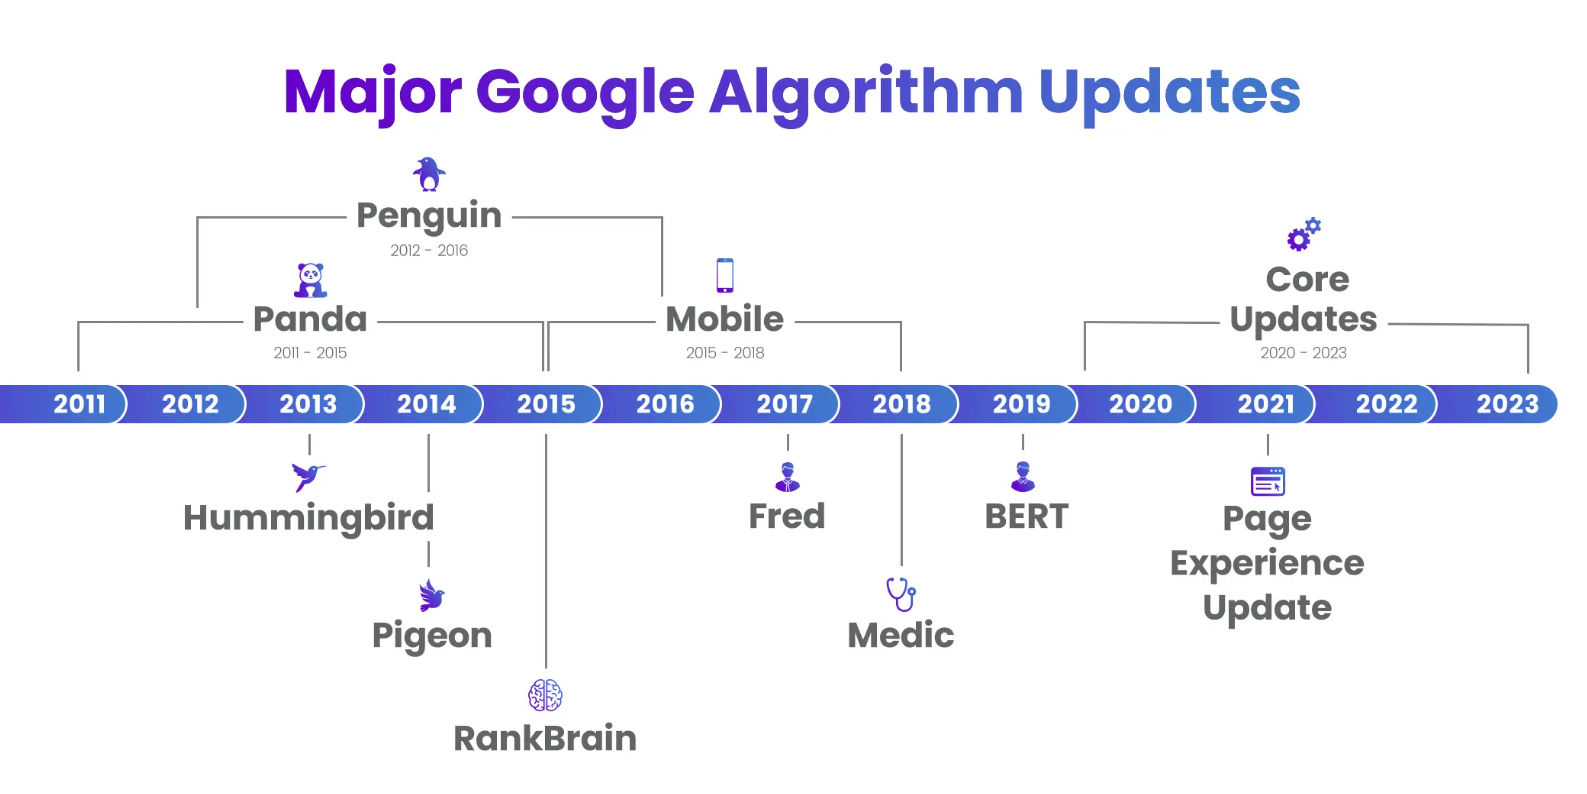
We’ll cover all the significant algorithm launches mentioned above including the latest Google update, but first, let’s bring it back to the basics and answer the question, “What is a Google algorithm update?”
A Google algorithm update is any change to Google’s algorithm that’s designed to improve overall user experience and to provide the most relevant search results when a query is submitted. While we wish we knew when and how many updates are coming, Google often (but not always) keeps this info under wraps until the update is ready to roll out. Updates can be minor or major, and can focus on anything from content quality to your site’s mobile-friendliness – more on that later.
Google frequently rolls out updates, with core updates being released multiple times a year. In addition to these core updates, which bring numerous significant yet subtle changes, Google also introduces specific updates that can alter our understanding of SEO best practices.
But why do Google algorithm changes matter in the first place? We’re glad you asked.
Google’s updates can have a large impact on your website’s SEO and overall traffic so it’s important to stay ahead of the game when possible.
As we mentioned, Google’s updates can vary. Some might not leave a lasting impact on your website, while others can have a significant effect on your overall search traffic.
Google consistently fine-tunes its algorithm, resulting in continuous updates. While not every update negatively impacts organic metrics, specific updates have the potential to alter a website’s visibility in SERPs, consequently influencing various aspects of performance such as traffic, keywords, and more.
Before an update, your site might have been ranking for a certain search query but that can change in an instant depending on the type of algorithm change Google puts into place. In general, different algorithms can have different impacts on SEO, so it’s important to stay on top of your overall strategy and to implement SEO best practices to stay ahead of any upcoming changes.
“Algorithm updates can drastically shift the organic search landscape. To insulate ourselves as much as possible from Google’s whims, we should be hyper-focused on our customers, providing the most useful content and the best user experience as possible. Updates are often Google’s way of forcing websites to meet expectations better, so we never want to be chasing the algorithm. ”
— Jamie Schleicher, Senior Manager, SEO at Tinuiti
Google rewards solid SEO best practices – plain and simple. If you’re looking to up your SEO game, we’ll cover top tips for preparing for future algorithm changes at the end of this article.
But for now, let’s dive into the history of Google’s algorithm updates starting with the most recent changes to date.
In April 2023, Google announced a reviews update that “aims to better reward high quality reviews, which is content that provides insightful analysis and original research and is written by experts or enthusiasts who know the topic well.”
Google rolled out another Core Update on March 15, 2023 that lasted until March 28th. These larger Core Updates can have significant implications for search results.
In February 2023, Google announced their Product Reviews Update. This update aimed to reward high-quality reviews that are rooted in research rather than “thin content that simply summarizes a bunch of products, services or other things.”
In this update, Google announced its improvement to SpamBrain, their AI-based spam-prevention system. In addition to its capability to identify and combat spam directly, the algorithm now has the ability to detect instances where websites engage in link purchasing practices, as well as websites that serve as platforms solely for the purpose of distributing outgoing links.
In December 2022, Google released the Helpful Content Update. Google noted, “The system automatically identifies content that seems to have little value, low-added value or is otherwise not particularly helpful to people. Any content—not just unhelpful content—on sites determined to have relatively high amounts of unhelpful content overall is less likely to perform well in Search, assuming there is other content elsewhere from the web that’s better to display. For this reason, removing unhelpful content could help the rankings of other content.”
The October 2022 Spam Update impacted all languages and focused on spam-related sites. They encouraged site owners who might have been impacted by this update to ensure they are complying with Google’s spam policies.
This Product Reviews Update focused on English-language product reviews and again highlighted the importance of high-quality, helpful product reviews.
The September 2022 Core Update was reportedly less significant than previous Core Updates especially considering this update overlapped with the recent Helpful Content Update.
Google’s Helpful Content Update launched in August 2022 focused on people-first content. They encouraged site owners to avoid creating content for search engines first as this is strongly correlated with content that searchers find unsatisfying. They noted that removing unhelpful content could help the rankings of other content.
This Product Reviews Update came out fast and furious. Other updates of this fashion take around 2-3 weeks to roll out, but this update only took six days.
The first Core Update of 2022 occurred in May. As with all Core Updates, Google again recommended that sites continue to focus on creating high-quality content. Many site owners saw a significant shift in overall rankings during this time period.
Google announced another Product Reviews Update in March 2022 further highlighting their mission to prioritize in-depth and authentic content. They encouraged users to follow best practices for product reviews in order to have the most impact.
In February 2022, Google revealed their Page Experience Update for Desktop. This update ranking launch was based on the same page experience signals that Google rolled out for mobile. It encouraged site owners to optimize their page experience.
The Product Reviews Update in December 2021 focused on rewarding high-quality reviews. Google shared the following best practices for creators to keep in mind:
The November 2021 Core Update reportedly impacted health-related sites the most, but nearly every vertical was impacted in some way. This rollout took roughly two weeks and was the third Core Update for the year.
In November 2021, Google released yet another Spam Update. This update included a notable improvement to how Google’s automated systems detect search spam.
The July 26th Spam Update, focused on refining inbound and outbound links across sites and nullified links that weren’t attributed correctly and/or came from less than reputable sources.
This update revealed that if inbound or outbound links are improperly coded or originate from unreliable sources, Google no longer considers them as attributions to a website. As a result, rankings and traffic from those sources are negatively impacted. At Tinuiti, we consistently monitor our clients’ sites for spammy links, which mitigated significant fluctuations during this update. However, it remains crucial to adhere to best practices for link-building to avoid adverse effects from similar changes.
The July 2021 Core Update began on July 1, 2021 and officially completed on July 12. As with most core updates, July’s didn’t specifically update certain facets of search but rather released a broad update to refine search results as a whole.
Google announced their plan to begin using page experience as part of their ranking systems with the Page Experience Update, better known as Core Web Vitals. The update considered a variety of page experience signals – Largest Contentful Paint, Cumulative Layout Shift, and First Input Delay. Google noted that sites shouldn’t see drastic changes right away considering the slower rollout process.
Google announced that another 2021 Broad Core Algorithm update was coming for the month of June. The search engine noted that some of the planned improvements for this update weren’t quite finished and they would likely carry this update into July. Google also reported that “it’s possible a very small slice of content might see changes in June that will reverse in July.”
The Product Reviews Update centered around “providing users with content that provides insightful analysis and original research.” This improvement to Google’s ranking system rewarded sites with thorough and thoughtful product reviews.
Google confirmed its third Broad Core Algorithm Update for 2020. The December Core Update created shifts in the search space which is typical for these kinds of updates, but Google didn’t share concrete reports of its overall impact. They again recommended that sites continue to focus on creating high-quality content.
Google announced another Broad Core Algorithm Update for the month of May. They reported that the May 2020 Core Update would take roughly one to two weeks to fully implement and recommended following the same guidance as their previous core updates.
Google’s Danny Sullivan confirmed that pages that are highlighted as a featured snippet won’t be repeated again on the first page of organic listings. With the addition of this new update, Google’s aim was to declutter results for a better user experience.
Google announced another Broad Core Algorithm Update during January 2020. Their guidance concerning the update remained the same as previously covered.
Shortly after the major rollout of BERT in the United States, Google announced that the update would now begin launching worldwide.
BERT (Bidirectional Encoder Representations from Transformers) was a major Google algorithm update centered around improving language understanding. This update was particularly important for users who made longer or more conversational queries. Now, the search engine could better understand a user’s context of words within a query so they could search in a more natural way.
The BERT update impacted a total of 10% of overall searches.
Another Broad Core Algorithm Update launched in late September. Google directed site owners to view the guidance they have provided for all other Broad Core Algorithm Updates thus far.
The Site Diversity Update honed in on providing users with a more diverse set of websites on SERPs. For certain searches, many of the same websites appeared in the results pages and Google took notice. With this update, Google noted that now users wouldn’t typically see more than two listings from the same site in their top results unless their systems determined it was especially relevant to a particular search.
The June 2019 Core Update was announced just a day before it went live with very few details. Google’s guidance was that there was nothing for websites to “fix” as this was one of their routine updates that happens several times a year. Google denied that it focused on any one niche in particular, but did confirm that the changes would be noticeable.
In March 2019, Google launched another Core Update and gave little details around who would see the largest impacts. They once again noted the update was designed to improve overall search results.
Google’s Danny Sullivan confirmed that there was a “small” update during this timeframe, but additional information on the change was not shared publicly.
In August 2018, Google launched its Broad Core Algorithm Update AKA the Medic Update. The medic update largely affected health and wellness, medical, and financial websites, among others. This was a global update and Google noted there was no “fix” for pages that might have taken a hit other than to continue building great content.
Google gave marketers roughly six months notice before the rollout of the Mobile Speed Update. This algorithm change focused on the speed of mobile, hence its namesake. Mobile speed was now an included factor in the search rankings, but Google noted this update only affected the slowest mobile sites. So, if you further optimized your already fast-running mobile pages, you likely wouldn’t see much of a difference from this update.
Google launched yet another Broad Core Algorithm Update just a month after their last update. Google did not give specifics on the update other than to remain focused on producing high-quality content.
Google announced that a Broad Core Algorithm Update occurred during this time period. This routine update was designed to improve their search results and warned that as with any update, sites may notice fluctuations in drops or gains.
Many publications and search experts reported large shifts to SERPs during this timeframe, but Google did not confirm an update, and information concerning specific impact was limited.
While Google was a bit wishy-washy when it came to confirming this update, many marketers saw a significant impact from Fred. This change focused on low-value content as well as sites that were embracing aggressive advertising placements, an overload of affiliate links, or other spam-like behaviors. During this update, Google also targeted sites that violated their Webmaster Guidelines.
Experts also saw a significant update on February 7th and noticed large changes to certain sites’ visibility on SERPs. Confirmation or additional details from Google was not reported.
Webmasters speculated that an update occurred on this date as they were seeing some fluctuations on SERPs, but Google did not confirm. The overall impact was minor.
The Intrusive Interstitials update’s goal was to penalize pages where content was not easily accessible to a user on the transition from the mobile search. Google noted examples of the following techniques that would make content less accessible to a user:
While Google never confirmed an update, many site owners saw significant shifts in rankings during this time period. Additional details were limited.
With this update, Google announced Penguin was officially part of their core algorithm. This integration meant that Penguin would now work in real-time, meaning that changes would be seen much quicker and would take effect just after Google recrawls and reindexes a page. Google also noted that Penguin was now more granular, meaning it “devalues spam by adjusting ranking based on spam signals, rather than affecting ranking of the whole site.”
Minimal details were provided on the Possum Update as it was never confirmed by Google. Many webmasters and SEOs saw dramatic changes when it came to local results during this update.
This was Google’s second Mobile Update designed to “make the web more mobile-friendly.” The announcement noted that the update increased the effect of the ranking signal to help users find pages that are mobile-friendly. The effect was minimal as most sites were already optimizing for mobile search at this time.
While Google never confirmed this update, SERP trackers saw significant fluctuation during this time period.
During the AdWords update, Google announced they would be removing the sidebar of ads that were originally seen on the right side of SERPs. During this update, Google also added an additional ad at the top of the search results (a total of four) and three ads at the bottom of the page. Many advertisers embraced the change, while other marketers felt at a disadvantage as organic search results were pushed further down the page and no longer appeared above-the-fold in many cases.
SERP trackers and webmasters reported an influx of ranking changes during this time period. While additional details were minimal, Google later noted that this change was to its core algorithm.
The RankBrain update, announced in 2015, was the addition of machine learning and artificial intelligence into Google’s algorithm. Baking this technology into Google’s algorithm allowed the search engine to even better predict a user’s intent when plugging in a query.
Once this technology was integrated into Google’s algorithm, the search engine had the ability to better guess what a user was searching for if it was a term Google was originally unfamiliar with.
Google announced another Panda refresh and reported that it would affect an estimated 2-3% of searches.
The Quality Update was a change to Google’s ranking algorithm and focused on quality signals. Google did not provide specifics on which signals they were referring to.
Google rarely announces updates before they occur, but that trend changed with the mobile algorithm update in April 2015. Google announced that this update would impact mobile rankings and that the rankings could ebb and flow depending on a specific page’s mobile-friendliness. Pages that were not optimized for mobile saw a considerable dip in traffic and were encouraged to get on board with the mobile-first movement.
While unconfirmed by Google, many webmasters noted a significant change in rankings during this update. Many thought this change targeted ecommerce websites.
Google announced that the Pigeon Update, first launched in the United States, recently went live in the UK, Canada, and Australia.
Google announced that Penguin would now be updated continuously with the goal of optimizing as they go.
After the original Pirate Update kicked off in 2012, Google launched an additional update focused on piracy. This update once again targeted sites that received a violation from DMCA (Digital Millennium Copyright Act). Sites that violated copyright infringement saw a dramatic decline in rankings during this update.
In October 2014, Google launched a Penguin refresh that reportedly affected less than 1% of English search queries. Many thought that this update was data-focused as opposed to a total algorithmic change.
During this update, Google updated their “In the News Box” found on SERPs. Now, the box would show a variety of news sites and mediums including videos, press releases, images, and more. Google’s goal was to enhance diversity when it came to news-related topics.
A larger Panda update rolled out in September 2014. This update included an algorithm change that affected around 3-5% of search queries.
During this update, Google announced that after they removed the authorship photo, they now decided to remove all authorship mark-ups. The day after this announcement, author bylines no longer appeared on SERPs.
Google announced that they would now use HTTPS as a ranking signal, making security their number one priority. This update affected less than 1% of global queries and was initially a lightweight signal, but Google noted that over time they would plan on strengthening it.
Google’s Pigeon Algorithm Update launched in 2014 with an aim to provide users with more relevant results when it came to local searches. The update improved Google’s distance and location ranking perimeters. The Pigeon Update helped local businesses better reach their audience and improved their chances of ranking if they followed general SEO best practices.
With the goal of cleaning up the visual design on SERPs, Google’s John Mueller announced the search engine dropped author images with this update.
Google announced another change to the Payday Loan update. Matt Cutts explained that the most recent update was aimed at spammy queries while this update focused on spammy sites.
Google rolled out a larger Panda update which included both an algorithm change and data refresh. The combination affected 7.5% of English search queries.
Almost a year after the original Payday Loan Update, Google launched a new update that targeted spammy queries. Effects of the update were difficult to pinpoint as Google was consistently refreshing Panda during the same time period.
Google announced there would be an additional refresh of the Page Layout update. No major changes to the algorithm were reported.
During this update, Google confirmed that there was a 15% reduction in authorship mark-up appealing on SERPs.
Google confirmed Penguin was going through a data refresh that affected less than 1% of searches.
Hummingbird was a significant Google algorithm update that anchored itself around speed and precision, much like an actual hummingbird. This update was aimed at giving users more accurate and personalized answers to search queries. In the past, Google relied on keyword matching to provide results, but with Hummingbird, the search engine was able to take user intent into consideration to provide even better results.
The goal of this update was for Google to better answer longer and more complex search queries that are phrased in natural language. It shifted many marketers’ priorities to focus on long-tail keywords as well as the quality and context of the content on their sites. High-quality content was, and still is, a key to rank on SERPs.
Google introduced a new set of search results to help users find in-depth articles. The new signals would look for high-quality, in-depth content and rank accordingly.
While details were kept under wraps, many webmasters thought this update “softened” some of Panda’s previous penalties.
According to a tweet from Matt Cutts, Google was releasing a multi-week algorithm update, but further details were limited.
The “Payday Loan” Google algorithm update launched in 2013 with a mission to target spammy sites and spammy search queries. The goal of this update was to enhance the quality of search queries that garner relatively high spam rates. Some of the industries that felt the largest impacts were high-interest loans, gambling, pharmaceuticals, and insurance websites, among others.
During this fourth Penguin update, Matt Cutts reported that about 2.3% of English queries would be affected. Google did not release any additional details.
The Domain Crowding Update promoted more diversity when it came to domains on pages deeper in the SERPs.
While this update was unconfirmed by Google, many webmasters saw fluctuations in ranking and traffic during this time period.
A new Panda data refresh went live on January 22, 2013 and affected 1.2% of English search queries.
In December 2012, another Panda update was announced. Google noted that this refresh would impact less than 1.3% of English queries.
This update was the rollout of Knowledge Graph to non-English searches. The Knowledge Graph Expansion included the following languages: Spanish, French, German, Portuguese, Japanese, Russian, and Italian.
Google confirmed that Panda had yet another small refresh on November 21, 2012. Additional details were not provided.
Another Panda update rolled out in November 2012 affecting just 1.1% of queries.
In January, Google announced the page layout algorithm update that affected sites with too many ads at the top of their pages AKA above the fold. Google gave these sites a chance to update their page layouts to recover in the rankings if they made necessary updates.
This Penguin update only affected 0.3% of search queries and additional details were limited as the impact was fairly minimal.
This update was the last of Google’s monthly search-quality highlights and included recent updates from both August and September. Some of the updates included updated term-proximity scoring, refreshed data used to generate site links, and more.
The Panda 20 update was a larger algorithm and data change that took roughly a week to roll out. This update impacted 2.4% of English search queries. If you noticed a change to the version number to this update, you weren’t alone. Google stated they’d rather number them based on the actual number of updates that have occurred and not the series number.
Google’s Exact-Match Domain (EMD) update launched a filter that would prevent low-quality websites from ranking well solely because their domain name exactly matched keywords users were commonly searching for. This new filter removed any authority low-quality EMD websites once had. This update impacted 0.6% of all English U.S based search queries with a noticeable effect.
Google announced there would be some flux over the coming days with the Panda 3.2.9 update. The refresh impacted less than 0.7% of searches.
Google announced yet another Panda refresh. This update impacted less than 1% of search queries and additional details were not reported.
The Pirate Update alerted site owners that Google would be taking into account new signals in their rankings. The new signal included the number of valid copyright removal notices Google received from any given site. Sites with higher numbers of notices began to appear lower in the search results or would eventually be removed altogether. Sites that were largely affected were ones that focused on the promotion of pirated content like videos, movies, and music.
During their recap of June and July, Google released a whopping 86 search-quality highlights. Some of the updates included helping users find high-quality content from trusted sources, the improvement of natural language processing, and more.
During this Panda refresh, Google stated that roughly 1% of searches were affected. Some SEOs noticed fluctuations during this time period, but the impact was small.
Google had been warning site owners about the effects of bad links for months. They let webmasters know these links needed to be addressed to avoid penalties. Google then sent out an additional update stating that the previous warnings could be ignored.
Google announced they were pushing another Panda data refresh for the month of June that affected less than 1% of search queries worldwide.
Google tweeted that another Panda refresh was rolling out during this time period and that less than 1% of queries would be noticeably affected.
Google released their monthly search-quality highlights and the month of May garnered 39 updates. The updates ranged from deeper detection of hacked pages to improvements to ranking for news results.
Shortly after Penguin’s release, Google made the first data update to this algorithm change. The impact was small, affecting less than 0.1% of English searches.
Google launched Knowledge Graph with the goal of helping users find new information quickly and easily. Knowledge Graph enabled users to search for a person, place, or thing and instantly obtain relevant, deeper information on the topic at hand. Google had three top goals in mind for users including allowing them to find the right thing, get the best summary, and to go deeper and broader in their search.
Google continued to roll out their monthly search-quality highlights and the month of April contained a breakdown of 52 updates. Some of the updates included more domain diversity, improvements to how search terms are scored in ranking, and more.
Google launched another Panda update in the month of April and again, further details were not reported. The impact was estimated to be relatively minimal.
The Penguin update, once known as the webspam algorithm update, took on the issue of black-hat SEO techniques like link schemes and keyword stuffing. The main goal of this update was to penalize websites that were using or buying spammy links to raise their sites on SERPs. This update was reported to affect 3.1% of searches.
Google launched another routine Panda refresh in April 2012. Further details were not reported.
Many site owners saw a shift in ranking during the Parked Domain Bug. Google announced that this bug classified some sites as parked domains when they weren’t. Google fixed the issue promptly and said they were looking at how to prevent this from happening again in the future.
Google unveiled another set of 50 search-quality highlights including a data refresh, better indexing of profile pages, fresher image predictions, and more.
Google announced an additional update to Panda on March 23, 2012. The refresh affected around 1.6% of search queries.
The Venice Update launched in February 2012 and made significant improvements to ranking for local search results. According to Google, this update “improves the triggering of Local Universal results by relying more on the ranking of our main search results as a signal.”
Google announced a record-breaking 40 updates for their monthly series concerning search quality. The updates focused on topics like more coverage for related searches, less duplication in expanded site links, improved foreign language synonyms, and more.
This update was focused on refreshing Panda’s data in order to make it more accurate. Further details were not listed.
In February 2012, Google released another set of search-quality highlights including short summaries of recent algorithm changes. Some of the changes included a focus on fresher results, faster autocomplete, better spelling corrections, and more.
The Google Page Layout Algorithm Update took a deeper look at the layouts of web pages and the amount of content a user immediately sees on the page once clicked. To put it simply, users were getting frustrated when they would go to click on a website and couldn’t easily find the content they were looking for and Google took note.
This Google algorithm update largely impacted sites that did not include relevant content “above-the-fold” and pushed them down in the search results. Google encouraged these types of sites to consider how they used their area “above-the-fold” (ie: advertisements) and determine if it’s taking users too long to find the content they’re after.
Google confirmed there was a Panda update during this time period, but did not release specific details.
Google focused on building more personalized results in the SERPs through the Search + Your World Update. This update merged content users have been sent personally with relevant public access content, all in one set of listings. This update connected to user’s Google+ social accounts to increase personalization. Once this update went live, Google did give users the ability to toggle this feature on and off as they pleased.
As promised, Google released another blog post covering a whopping 30 recent updates. They referred to these updates as search quality highlights and they covered everything from relevant site links to richer snippets.
Google’s previous ten pack of algorithm updates was well received and the search engine released an additional blog post highlighting ten additional algorithm updates. The post covered topics like image result freshness, original content, and more. Google also announced that they would continue to publish these posts on a monthly schedule.
Google reported a “tiny” algorithm data refresh that affected less than 1% of searches. Limited details were reported and the impact was minimal.
In a break from tradition, Matt Cutts shared a blog post highlighting ten recent Google algorithm changes to give webmasters deeper insights into the 500+ the search engine makes per year. The post highlighted everything from extending application-rich snippets to retiring a signal in image search.
Google made a significant improvement to its ranking algorithm to provide users with the most timely and “fresh” results when they plug in a search query. The freshness update affected 35% of searches and focused on recent or recurring events, frequent updates, and hot topics.
Google announced that they would be making search more secure by encrypting user’s search queries and Google’s results page for privacy reasons.
Matt Cutts tweeted to “expect some Panda-related flux in the next few weeks.” These updates were relatively minor and Google did not elaborate on the changes.
During this time period, there were reports of ranking fluctuation, but the specifics of this update were kept under wraps.
During this update, the rel=”next” and rel=”prev” link attributes were introduced in order to combat duplication and crawl issues brought on by pagination.
During this update, Google expanded the number of site links in the search results. They would now include full-sized links with the inclusion of snippet text. With the update, Google noted it would be easier to find the specific section of the site you’re looking for.
Google announced that Panda was officially rolled out worldwide in most languages (excluding Chinese, Japanese, or Korean for the time being). This was a significant update that impacted 6-9% of search queries.
Limited details were released concerning the Panda 2.3 update, but small changes were made to improve the quality of search results.
An additional Panda update went live in June 2011. Google confirmed the Panda update was now running every few weeks, and this particular update largely targeted site scrapers.
Google, Bing, and Yahoo joined forces to launch schema.org. Google announced this new initiative was designed to “create and support a common vocabulary for structured data markup on web pages.” Schema.org allowed site owners to gain valuable insights on structured data and information on how to improve search rankings on major search engines.
Google announced that small changes were made during this Panda update. Many SEOs thought this would be a major update, but it turns out that only a few tweaks were made and the impact wasn’t significant.
After Panda’s initial release, Google launched the 2.0 update to include all English search results across the globe. This launch brought on a few additional feedback signals including incorporating data concerning sites that users blocked.
Google took a note from Facebook’s like buttons by adding a +1 option of their own. The +1 button allowed users to “like” specific search results or ads which promoted optimization through recommendations.
The Panda update launched in 2011, but has since had additional updates. This algorithm update focused largely on websites providing quality content for users. The search filter’s goal was to lower the rankings of low-quality websites AKA thin sites and reward high-quality sites. Low-quality content or thin sites were considered websites that lacked substantial or relevant content, had minimal sentences, and generally omitted in-depth information.
Websites that had duplicate content or poor user metrics took a large hit from this update and many are still feeling the effects today. In total, this update impacted up to 12% of all search results. Google referred many sites that struggled with the Panda update to their guide on building high-quality sites and encouraged users to ask themselves questions like:
Google’s Matt Cutts announced an update that would target sites with low levels of original content. Searchers would now see more sites on SERPs that wrote their own content rather than scraping it off of another site. Cutts Reported that this update affected 2% of overall search queries.
The New York Times brought to light a very interesting tactic by the ecommerce site, DecorMyEyes. The site ranked in SERPs based on their negative reviews. Once Google found out, they updated their algorithm honing in on sites that were using similar methods.
While this was not an official algorithm update, both Google and Bing announced that they use a variety of social signs when ranking search results.
The Instant Previews Update allowed users to preview pages on SERPs without even clicking on the direct link to navigate to the page. They could simply hover over the new magnifying glass icon and quickly check to see if the page was relevant to their search.
With Google Instant, users were able to view search results as soon as they began typing in a specific search query. The core features of Google Instant were providing dynamic results, predictions, and a new scroll to search feature allowing users to scroll through predictions to see immediate results. While webmasters were concerned about how this update would affect SEO, little impact was shown.
The Caffeine Update launched in June of 2010 was a significant change aimed to completely revitalize Google’s index. According to Google, the rebuild provided 50% fresher search results than their previous index. The search engine noted that expectations for relevant and efficient search results were higher than ever before and that this new index would help improve the overall user experience.
The May Day Google algorithm update focused largely on long-tail keywords. The changes were implemented between the dates of April 28 through May 3, hence the name “May Day”. Google’s goal with this change was to help users find the best quality sites that matched up with specified long-tail queries.
During this update, Google’s previous Local Business Center became Google Places. Google’s goal with the change was to help people easily find local businesses within their communities. Today, Google Places are now known as Google Business Profiles.
When the update rolled out, so did a few additional changes like allowing businesses to show their service areas, giving business owners new options for advertising, and even providing companies with the option of scheduling storefront photoshoots.
In December 2009, Google announced the addition of real-time search. This change meant that when you typed in your search, your results would now include some of the most real-time updates. The Real-Time Search Update included a feed of Google articles, social media posts, news articles, and more designed to give the most up-to-date information within SERPs.
Big brands won even bigger when the Vince Update launched in February 2009. This update focused largely on the trustworthiness of various sites. Google noted that this was a minor update, but many SEOs and web experts thought it was a bit more substantial than what they led on.
Gone were the worries of duplicate content when the rel-canonical tag was announced. This new tag allowed site owners to canonicalize URLs AKA let crawlers know the preferred version of a web page.
Google Suggest launched in August 2008. With this update, when a user is typing in a search query, a drop-down would now appear with suggestions for their potential search. This update helped streamline the search process even further.
The Dewey Update caused significant changes in search results, but specifics concerning the update were kept under wraps.
According to Google’s Matt Cutts, this minor update only affected a few one-word queries and was largely insignificant.
The Universal Search update was a big update that shook things up in the search space. Now, when users submit a query, they would see a blend of results including images, video, news, and more in their traditional search results. Previously, Google only provided a 10-link results page, but with this update, search results became more diverse and robust.
Many marketers saw fluctuations in page rankings during this time, but Google denied any updates.
While unconfirmed by Google, many SEOs saw changes in the supplemental index during this time period.
The Big Daddy Update was considered a large infrastructure update. While the update started in 2005, it wasn’t complete until March 2006. Despite the name, the Big Daddy Update didn’t have significant impacts on overall search results. The update focused on URL canonicalization as well as redirects.
Google announced the official launch of Google Local which merged the technologies of Google Local and Google Maps. This new launch allowed users to find local search and map information all in one place.
The Jagger Update rolled out in three different stages that began with back-link updates and focused on low-quality links.
While many site owners saw significant changes, Google stated that no update actually occurred. This “update” is often referred to as the false update.
Webmasters rejoiced when Google announced the XML Sitemaps update. This update allowed webmasters the freedom to submit XML sitemaps directly to Google’s web index. Although inclusion wasn’t guaranteed, Google’s goal with this update was to better gather pages and that site owners could have better control of how and when their pages should be changed or revisited.
Google’s previous methods for personalization required custom settings, but with the Personalized Search Update, the search engine could take a deeper look into search histories and habits to provide better results.
Back in 2005 Google’s Matt Cutts announced that the Bourbon update would include 3.5 improvements in search quality. Additional details were limited but many other experts believed the update also affected duplicate content.
Ranking changes were noticed at this time, but there was limited information on this update. Many believed that Allegra affected the Google “sandbox”, a metaphor referring to a rumored filter that prevents brand new websites from ranking on SERPs. Other experts thought this update changed the latest LSI regulations.
Google, Microsoft, and Yahoo implemented the nofollow attribute at the same time with the intention of fighting spam. Google noted that when they see the rel=”nofollow” attribute on a hyperlink, those links won’t get any credit when they rank websites in their search results.
Many sites that were affected by the Austin update were not actually using the manipulative techniques Google was on the hunt for. The Brandy update was seen as a correction of the Austin update. The Brandy update also focused on a new index expansion, Latent Semantic Indexing (LSI), which expanded the search engine’s ability to understand synonyms.
While the Florida update focused on keyword stuffing, the Austin update cracked down on invisible text and meta-tag stuffing. It also penalizes sites that hosted spam or gained strength from link farms.
The Florida update was Google’s most significant change to date and largely impacted websites participating in keyword stuffing to gain higher placements on SERPs. Google penalized a large number of sites for unethical practices and many businesses fell dramatically in the overall search rankings.
Google’s page counts were on the rise and the search engine moved select pages into a supplemental index so they could have the ability to index more without sacrificing overall performance.
“Google Dance” (AKA Google’s monthly index updates) officially ended with the Fritz update. With Fritz, updates were now an almost daily occurrence.
The Esmeralda update was the last of Google’s planned monthly updates as the search engine moved to more frequent changes. While unconfirmed, the update was reported to make major infrastructure changes at Google.
In May 2003, marketers took notice when Google’s bots named Deepcrawler and Freshbot began searching sites. Many from the webmaster community believed that there was now a change in how backlinks were counted and reported.
This update focused on link-quality issues like linking from co-owned domains.
Boston was the first announced and named Google algorithm update released at SES Boston, hence the name. The update included algorithm changes as well as index refreshes which were previously known as the “Google Dance.”
While the first documented Google algorithm update was unconfirmed by the search engine, many SEOs noticed a significant difference in rankings on this date. Many marketers were confused as there were few details presented by Google. Little did they know, more consistent changes were to come.
Google announced the availability of Google Toolbar which allowed users to search for information from any page on the Internet, even if the site didn’t have their own search capabilities. The addition made placing a search query easier than ever before. It also allowed users to view a site’s PageRank, one of the search engine’s first major ranking signals.
As you can see, Google goes through A LOT of updates each year. Let’s answer some common questions about these updates and how they can affect your search engine rankings.
Google updates its algorithm on a regular basis, with minor updates occurring frequently and core updates being released several times a year.
Google updates its algorithm frequently to improve the quality and relevance of search results. The internet is constantly evolving, with new websites, content, and user behaviors evolving over time. By updating the algorithm regularly, Google can adapt to these changes, refine its ranking criteria, and deliver the most accurate and helpful search results to users. The updates also help Google fight spam, address emerging issues, and incorporate new technologies or features that enhance the search experience. Ultimately, the aim is to ensure that users find the most relevant and trustworthy information.
Determining if a Google algorithm update has impacted your website’s performance requires monitoring changes in your organic search traffic, rankings, and overall visibility. We recommend checking the following:
As we mentioned, with Google, the only constant is change. But what’s next for Google’s Algorithm? Let’s hear from a Tinuiti expert on what marketers can expect…
“Google will continue to tweak its algorithm daily, but as far as bigger updates are concerned, we should continue to expect 2-3 core algorithm updates per year. We should expect updates related to recent themes such as helpful content, reviews, and user experience signals. Finally, with the recent proliferation of enhanced generative AI capabilities and access, we wouldn’t be surprised for Google to have an update specific to AI content standards.”
— Jamie Schleicher, Senior Manager, SEO at Tinuiti
Google’s constantly changing and evolving its algorithm (as you can see) to better help users find what they need, but it can be overwhelming to site owners who feel those effects whenever a new change drops. While you won’t always be able to precisely predict the exact impact of algorithm updates, it’s critical for you to develop quality content and focus on the technical health of your site so you can be better prepared.
Incorporating targeted keywords throughout your content, building relevant links, and optimizing your overall site experience are great places to start as they are keys to ranking. But what additional steps can you take to stay ahead of the game?
While there’s no exact way to “beat” the algorithm, Jasmin Bretaña, SEO Coordinator at Tinuiti, shared three keys to preparing for future algorithm changes and highlighted what to do if your site is impacted.
Audit your site regularly
Combing through your site for areas of opportunity and performing actionable audits across various site sections is a necessity to stay ahead of the updates. If you’re consistently reviewing your site to make sure that it follows the most current best practices, there shouldn’t be a high level of fluctuation during most of Google’s updates.
Keep tabs on your analytical data
If you’ve been hit by a recent algorithm update, it’s important to find the source via analytical data first. Typically, there are strong signals within the data that hold the answer to the origin of the volatile point(s). Once the source is known, you’re able to review it to see if SEO best practices are in line with current references and make the needed changes in order to begin to trend upward once more.
Have a strong SEO partner
Having a strong SEO partner that can break down each update from Google is key to prepare your site for algorithm updates. Working alongside industry experts like the Tinuiti SEO team ensures your site is consistently monitored and reported on for any changes. We are consistently staying up-to-date with the latest from Google, and work with our client partners to not only keep a close eye across all organic metrics, but also offer our perspective on how to stay ahead of Google search updates that can affect a site adversely.
Ready to take your search strategy to the next level? If so, take a look at our top-notch SEO services or contact us today!