Amazon
What is Amazon Brand Analytics (formerly Amazon Retail Analytics) Premium?
Amazon Brand Analytics (formerly known as Amazon Retail Analytics) Premium is an add-on suite of additional reports which Vendors have access to through Vendor Central.
These reports provide information regarding:
-
- Customer Behavior
- Sales
- Geographic Performance
- Operations
- Market Trends
- Customer Reviews
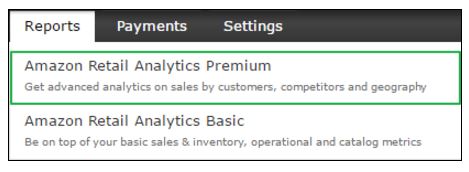
As seen below, ARA Premium can be found within Vendor Central under Reports -> Amazon Brand Analytics Premium.
Pro-Tip: If you do not see this option, it is because the Vendor does not have access to the reports.

How does a Vendor get access to Amazon Brand Analytics Premium?
There are two paths to gaining access to ARA Premium. The first is through subscribing to Amazon’s Vendor Premium Services package, which starts at approximetly $30k/yr.
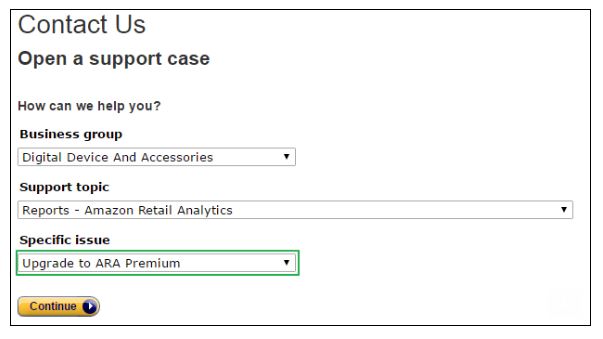
The second is through a support case in Vendor Central, as seen in the example below:

What is the value of Amazon Brand Analytics Premium?
ARA Premium provides additional data and reports for a Vendor to evaluate their performance and use as business intelligence in the decision making process. These reports are downloadable as .csv files.
While ARA Premium does return the top 100 search terms in each department on Amazon, it does not provide volume in terms of sessions and page views. The terms are ranked in popularity of search.
ARA Premium Reporting
ARA Premium reports are organized into a series of documents including:
-
- Sales
- Marketing
- Customer Behavior
- Operations
- Trends
- Sales
- Inventory
There are more than 20 reports pre-formatted for you based upon the product category including:
Amazon Top 100 Search Terms:
-
- View the top 100 search terms by Amazon category worldwide.
Amazon Search Terms:
-
- Test search terms for your paid search portfolio. What terms do customers use when they click on and buy products on Amazon?
- Identify new search terms that will be strong candidates for your paid search terms portfolio.
- Evaluate search terms for seasonality and trends analysis.
- Evaluate search terms effectiveness across geographies.
- Discover which search terms are effective for your products, as well as for competitive and complementary products.
Sales Summary:
-
- Pull pre-orders (NYP), orders, and shipments of individual products for specific time periods.
- Download the reports to inject into your sales data directly into your data warehouse or data stores.
- Track the sales of a focus group of your products that you have just launched or are currently promoting.
- Track the sales of a particular author, artist, or products in one category.
- Books publishers can track their sales after a customer uses the Search Inside the Book feature.
Category Sales:
-
- Track performance by category and identify unique number of titles.
- Track performance and growth by looking at older items versus newer items.
- Click on a specific category to view your top 100 products in that category by sales and units.
Sales History by Week:
-
- Benchmark sales of items against each other over time.
- Track sales of items which drive performance for category.
- Perform marketing campaign post-mortem and ROI analysis by examining performance during a given period.
Geographic Sales:
-
- See where your customers live, down to zip code level.
- Benchmark performance by state to other vendors on Amazon.
- Measure response to geographic marketing and advertising campaigns.
- Measure penetration of your sales on Amazon by geography compared to other channels in which you sale your products.
Category Share:
-
- Benchmark your share rank of a category and subcategories on Amazon.
- Measure your category and subcategory growth performance vs. Amazon.
- Identify fast growing categories ripe for new content.
Page Views and Conversion:
-
- Use the Page Views Index which can be used to understand how much awareness you are generating.
- View conversion rate percentile to understand how well you are turning browsers into buyers for each item.
- You can then see if your marketing efforts in terms of detail page content for an item stacks up to those of all vendors on Amazon in aggregate.
Category Conversion Comparison:
-
- Benchmark average category conversion rate versus Amazon
- Benchmark item level conversion performance versus category and Amazon
- Combine with Page Views and Conversions to look at performance of items by availability date for each category
Competitive Category Comparison:
-
- Benchmark average category conversion rate versus Amazon.
- Benchmark item level conversion performance versus category and Amazon.
- Combine with Page Views and Conversions to look at performance of items by availability date for each category.
Competitive Title Comparison:
-
- Benchmark item level performance against any other item on a unit volume basis.
- Compare sales decay characteristics of competing items on a pre-order, post-release, and recent trailing week basis.
- Use competitive titles for sales decay characteristics to help estimate initial manufacturing levels for items in the product development pipeline.
Customer Reviews:
-
- View the number of customer reviews received by an item over its lifetime, the average rating over its lifetime, and by the number of stars it has received (out of a possible 5).
- Compare lifetime data to the customer reviews received during the reporting period.
Market Basket Analysis:
- See what customers are purchasing with your titles to identify cross-marketing opportunities online and offline.
- Maximize sales potential with product bundles by grouping items that are highly complementary.
Item Viewing Pre-Purchase:
- Use in conjunction with Market Basket Analysis to Identify competitive versus complimentary items based on customer browsing patterns.
- Understand how customers are getting to your detail page and identify cross marketing opportunities.
Franchise Buying:
- Benchmark average category conversion rate versus Amazon.
- Benchmark item level conversion performance versus category and Amazon.
- Combine with Page Views and Conversions to look at performance of items by availability date for each category.
Stock and Forecast:
- View Open confirmed POs, forecasted demand for product, and inventory levels.
- Track estimated weeks of cover based on forecast and actual shipments.
- Use weeks of cover as a proxy for inventory levels in other channels.
Category Market Basket Analysis:
- This report shows popular combinations of items being bought together at the category level.
- This is intended to provide support for finding new cross marketing ideas to marketing teams.
Category Market Basket Analysis:
- This report shows popular combinations of items being bought together at the category level.
- This is intended to provide support for finding new cross marketing ideas to marketing teams.
Top Amazon Items in Growth:
- Users can see what the fastest selling items are in any product group sold on an Amazon web site.
- They will be able to view rank by units and percentage unit growth over a selected period of time for those items.
Examples of How to Use ARA Premium Reports
The most useful ARA Premium Reports are the Amazon Top 100 Search Terms Report, which allows vendors to view the top 100 search terms by Amazon category worldwide. These terms are ranked in order of popularity.
The Amazon Search Terms Report is also extremely useful because it allows the advertiser to look up search terms to discover the top 3 clicked on ASINs for that term or look up ASINs to discover all of the search terms where that ASIN is one of the top 3 clicked on products.
If a Vendor has access to ARA Premium, there are a number of ways sellers can use the available data to inform engagement.
Below we outline different use cases for each of the following 3 reports:
Example 1: Amazon Top 100 Search Terms Report
From an advertising perspective these are terms vendors will want to be aware of and likely target. I can see this benefiting both side of the equation – sellers with big budgets will want to try and claim space on these words and sellers with smaller budgets will likely want to long tail these keywords or use more restrictive match criteria (exact and phrase).
This data also helps to show seasonality of products and search terms. In many cases this data can help support why a vendor might be seeing a spike in sales.
Example 2: Amazon Search Terms Report
Since the search terms in this report are terms where this ASIN is already among the top 3 clicked results, it doesn’t help advertisers much to track target search terms where they ambition to get into the top 3.
However, it does help to set a benchmark for high performing search terms to make sure we protect that turf and from a perception standpoint – it’s nice to point to a few search terms where this ASIN is “winning” to show that we are successfully ranking for some search terms.
This report also helps to discover which search terms are effective for your products, as well as for competitive and complementary products and evaluate search terms for seasonality and trends analysis.
Example 3: All Geographic Data Report
This report allows advertisers to see where their customers live, down to zip code level. It also can be used to provide a benchmark performance by state to other vendors on Amazon.
The geographic data report can also measure response to geographic marketing and advertising campaigns and measure penetration of your sales on Amazon by geography compared to other channels in which you sale your products.
For more on ARA Premium, email [email protected]


