Expectations for Cyber Five 2024 Across Google, Amazon, Meta, and More


It’s already November but Cyber Monday is still nearly a month away, as the 2024 calendar pushed Thanksgiving to November 28 from November 23 a year prior. This makes for the shortest stretch between Thanksgiving and Christmas Day since 2019, and while it should go without saying, a lot has happened since then.
Here we’ll unpack some of the trends we saw last year to build our expectations for the upcoming Cyber Five, which refers to the five-day period from Thanksgiving through Cyber Monday, taking the shortened holiday season and recent economic and consumer trends into account.
As brands make their final preparations for Cyber Week they will need to plan for how the change in the timing of Thanksgiving might impact the expected performance of their digital ads.
In 2023, brands saw relatively weak growth in sales generated by Google search ads in the runup to an early Thanksgiving, both in the first half of November and during the week before Thanksgiving. Sales growth did pick up on Thanksgiving but growth peaked over the weekend between Black Friday and Cyber Monday.

With Thanksgiving coming late in 2024, holiday shoppers may be less inclined than in 2023 to wait for Cyber Week promotions to kick in before making a significant share of their purchases.
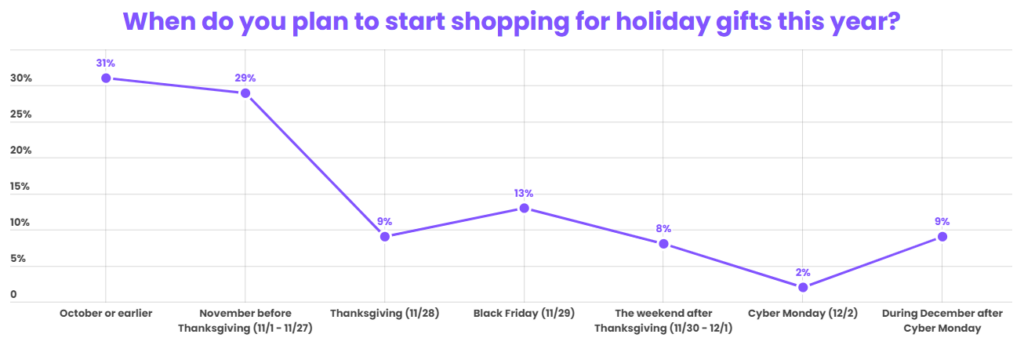
In a Tinuiti survey of over 1000 holiday shoppers conducted in Q3 2024, 60% said they plan to start their shopping for holiday gifts this year before Thanksgiving, up from 55% in Tinuiti’s 2023 holiday shopper survey.
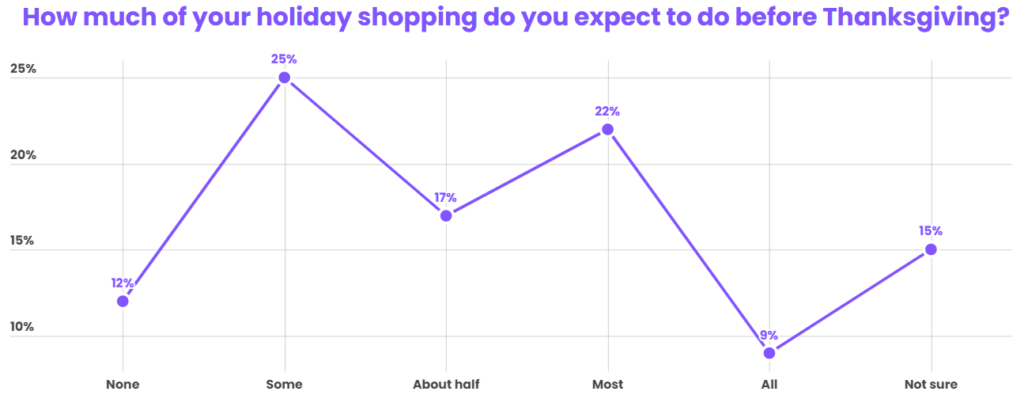
Shoppers also expect to complete a large chunk of their purchases before Thanksgiving with 48% of respondents saying they expect to complete about half or more of their shopping before the big day.
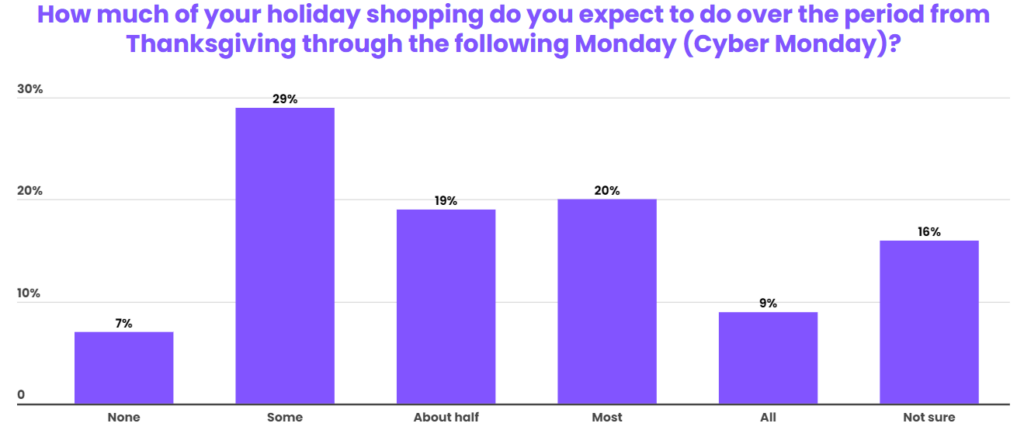
As a result, fewer respondents expect to do the majority of their holiday shopping over the Cyber Five period from Thanksgiving through Cyber Monday. In 2023, 41% of Tinuiti survey respondents said they expected to do most or all of their shopping over this period, but that rate dropped to 29% in 2024.
After it made a tentative entry into the US digital ads space in Q4 2022, Temu had a breakout year in the landscape for ad impressions in 2023, becoming one of the retail industry’s biggest competitors across search, social, and display ads.
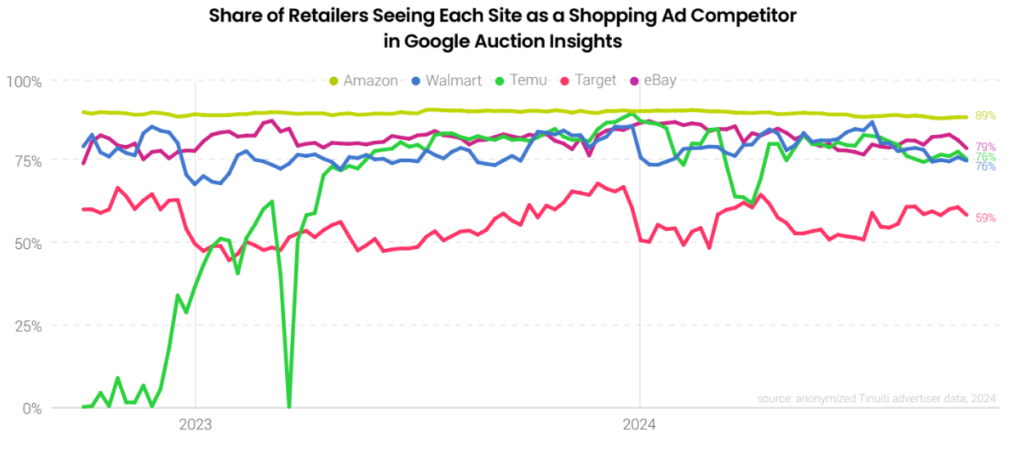
In the competition for Google shopping ad impressions, Temu briefly matched Amazon in Q4 2023 as the most commonly seen competitor in retailers’ Google’s auction insights report, an indicator of the breadth of product categories that Temu was running ads on.
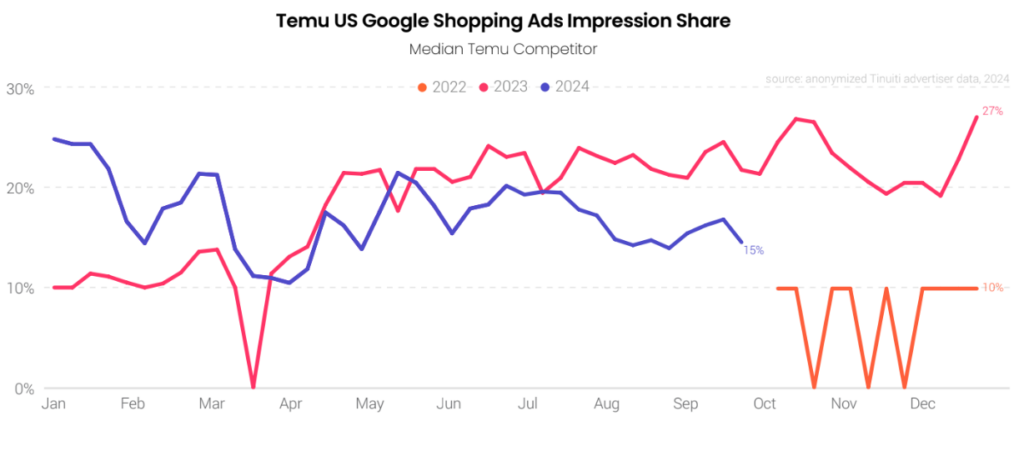
Over 2024, however, Temu dialed back its presence in Google auctions. Heading into Q4, fewer brands saw Temu in their Google auction insights reports as a top competitor, while Temu’s average share of impressions against the brands it is still competing against has run lower than in 2023.
Possibly in response to the waves Temu made over 2023, Amazon appeared to take a particularly aggressive stance in Google shopping auctions to begin 2024, but Amazon’s presence wavered in Q3, including an unusually large drop in impression share in September, which was followed by a rebound to close out the quarter.
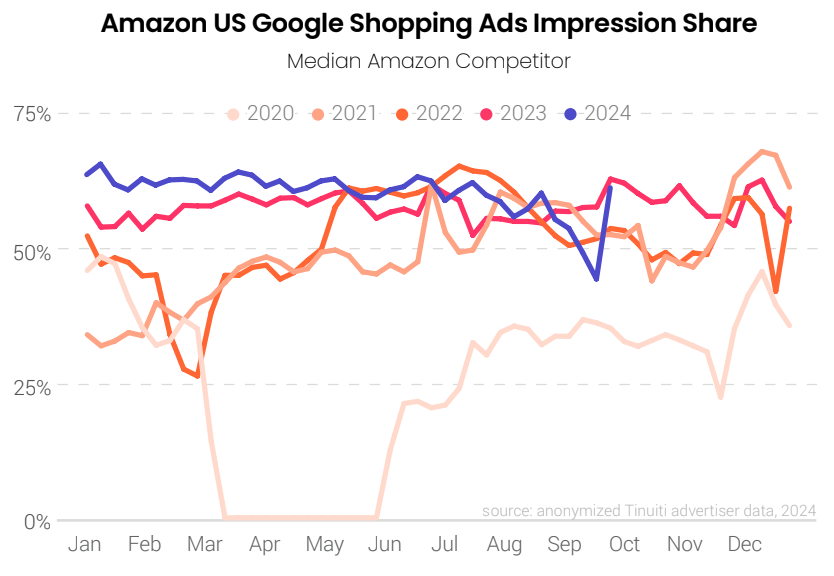
Ultimately, Amazon headed into Q4 at a similar share of Google shopping impressions as it did in 2023. In 2023, Amazon remained relatively aggressive in running Google shopping ads from the start of Q4 through the end of the year.
Speaking of Amazon…
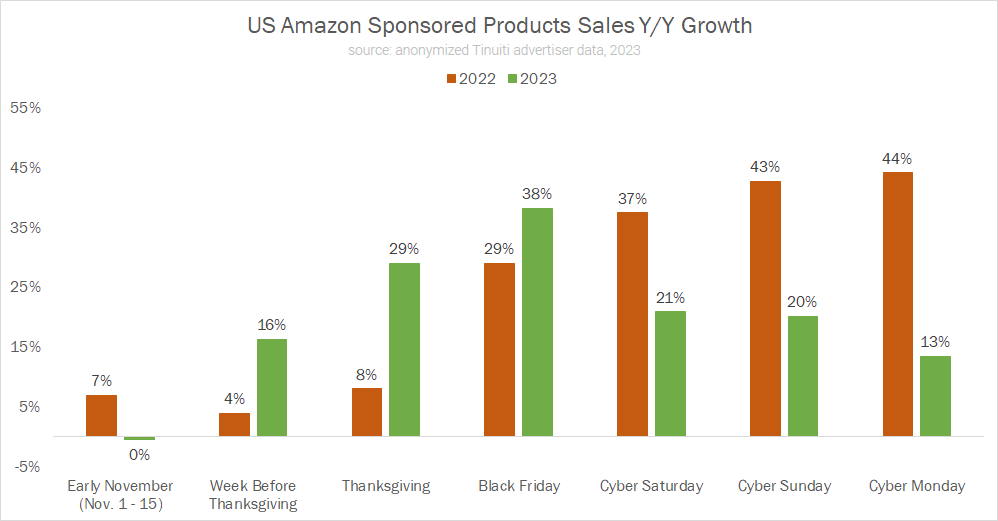
In 2023, Amazon extended its Cyber Five sales event to eleven days and kicked off promotional efforts well in advance of Thanksgiving. The move appeared to pay off, as Amazon advertisers saw 16% year-over-year growth in the sales attributed to Sponsored Products the week before Thanksgiving.
That eclipsed the increase observed on Cyber Monday and far outpaced the paltry 4% growth for the week before Thanksgiving in 2022. It was also stronger than the 7% increase in sales Google search advertisers saw attributed to that channel in the week before Thanksgiving 2023.
Amazon will once again be promoting Cyber Five-style deals in advance of Thanksgiving, and with the late timing of the holiday it’s possible we’ll see even more consumer response to these promotional efforts.
Facebook and Instagram are major recipients of the ad dollars flowing from political campaigns and organizations, and many in the digital marketing world questioned if this would have an impact on ad auctions heading into the November election. For Tinuiti advertisers, many of which are in the retail vertical, there was not a clear impact to pricing or volume in the third quarter at a national level, and political spend is fairly small in the bigger scheme of ad dollars flowing to platforms like Meta.
Even for the month of October, when political ad spending crested on the eve of the election, Meta CPM was flat year over year for Tinuiti advertisers.
Looking ahead to the Cyber Five, we’ll certainly see a ramp up in CPM as we draw closer to the core holiday shopping season. However, pricing firmed up significantly in the fourth quarter last year, such that year-ago comparisons are much tougher than they were in Q3 and it’s unlikely we’ll see year-over-year growth for the full quarter.
Of course, pricing can be heavily impacted by shifts in ad placements over time, and Meta advertisers have recently seen a surge in Reels inventory.
Reels video ads accounted for 6% and 12% of Facebook and Instagram ad impressions, respectively, during Cyber Five 2023. Considering the 11% share of Instagram impressions attributed to the format over the full Q4 2023, it’s clear that that share is likely to be much higher in 2024, with Reels already growing to account for 19% of all Instagram impressions in Q3 2024.

Tinuiti advertisers have also continued to ramp up TikTok ad investment, with spend up 28% year over year in Q3. With consumers increasingly exposed to vertical video ads across Meta and TikTok, as well as on YouTube through Shorts, the format is well positioned to influence holiday shopping in 2024.
Retail/ecommerce advertisers have been ramping up investment in campaign types powered by Artificial Intelligence (AI) for some time. Among Google shopping advertisers, over 90% deploy Performance Max campaigns to some extent as part of their strategy. Over on the Meta side of things, over one-third of all retail/ecommerce ad spend went to Advantage+ shopping campaigns in the third quarter.
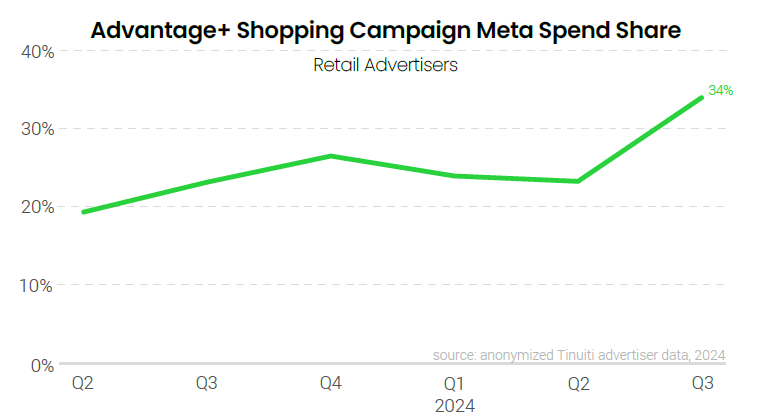
Both of these campaign types are poised to play a meaningful role for marketers looking to reach holiday shoppers during the Cyber Five and beyond.

VP, Research
Andy Taylor is the VP of Research at Tinuiti, where he leads proprietary data research that translates billions in annual ad spend into clear, actionable insights for brands. He lives in Richmond, VA, where he enjoys running, tending his yard, and binge‑watching baking shows.