Google Product Listing Ads Posts Largest Lead In Comparison Shopping Industry Since 2009

In a show of dominance over the market, Google Product Listing Ads posted the largest marginal gain against it’s competitors in the comparison shopping market during Q2 of 2013. Scoring best of class (which is normal for Google) is not the story here. The story is just how far 2nd place is to the shopping engine giant.
63.3 ahead in traffic, 79.12 ahead in revenue?
Google Shopping’s evolution is in full force.
Q4 2012:
Q1 2013:
Q2 2013:
Google Product Listing Ads (PLAs) have already matched their Q4 2012 high of 31 cents per click in Q2 of this year, arguably the slowest traffic & sales quarter for online retailers.
Google’s earnings told the same story, with CPCs down 6% YoY and 2% from the previous quarter. Why? Because Product Listing Ads are cheap traffic for retailers with a higher conversion rate than text ads.
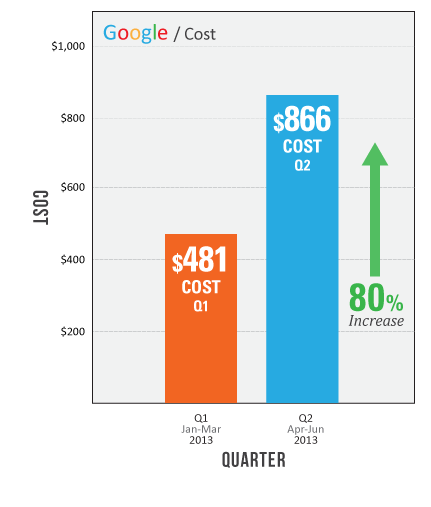
PLA revenue increased by 65.8% from Q1 to Q2, but costs increased at a higher rate (88%). Traffic was up 40.3%.
The cost for $100 in revenue generated by Product Listing Ads went from $11.69 to $12.69, a small but noticeable increase for retailers with razor sharp margins.
Note: That cost per sale ratio is still lower than the set fees for sellers listed on Amazon’s marketplace.
Note 2: The two graphs below represent weekly averages of our 200+ retail clients.

PLA CPCs won’t be this low for long as more and more advertisers become aggressive to increase revenue and market share.
Google seems to have ample room to increase the inventory for ads (see PLA 16s) and the ability to raise rates by posting solid ROIs that average less than sellers on Amazon’s Marketplace.
