Digital Ads Benchmark Report Q1 2025
Quarterly Trends Across Google, Meta, Amazon, and More
Quarterly Trends Across Google, Meta, Amazon, and More
The Tinuiti Digital Ads Benchmark Report is based on anonymized performance data from advertising programs under Tinuiti management, with annual digital ad spend under management totaling over $4 billion. Samples are restricted to those programs that have remained active and maintained a consistent strategy over the time periods studied. Unless otherwise noted, all figures are based on same-client growth. The trends and figures included are not meant to represent the official performance of any advertising platform or the experiences of every advertiser.
Note: The data below is from 2025. Head here to see our most recent report.
Tinuiti is the largest independent performance marketing firm across Streaming TV and the Triopoly of Google, Facebook, and Amazon, with $4 billion in digital media under management and over 1,000 employees.
Across Google, Meta, and Amazon, ad spend trends in the first quarter largely tracked in line with expectations prior to the quarter given year-ago comparisons. While Meta platforms bucked the Q4 deceleration trend observed across most other platforms, overall growth on the social giant slowed in Q1 as it ran into tougher year-ago comparisons, particularly on Instagram.
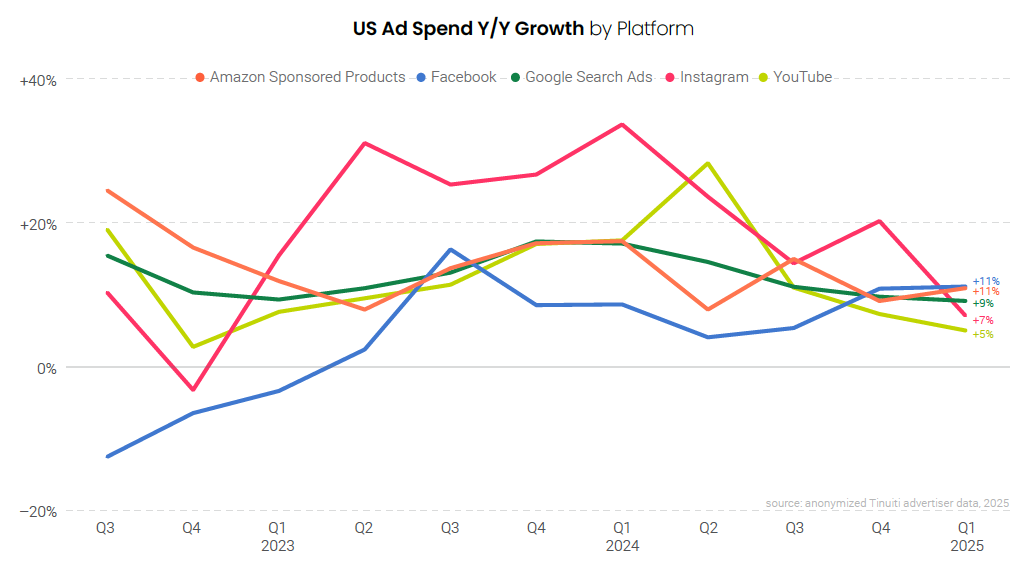
Amazon Sponsored Products spend growth ticked up to 11%, with click growth on the format growing double digits for the second straight quarter. Despite calls to boycott Amazon over concerns surrounding its rollback of diversity, equity, and inclusion (DEI) initiatives, Amazon advertisers did not see a noticeable impact from these efforts in the first quarter.
With all eyes on Google’s ability to continue to produce advertising clicks in the new world of generative AI-powered search and answer engines, Google paid search click growth accelerated from 3% in Q4 to 4% in Q1. Notably, click growth for Google Shopping ads (including Performance Max campaigns) jumped from 1% in the fourth quarter to 9% year over year growth in Q1. There has not yet been a clear and definitive impact to Google ad click volume for Tinuiti advertisers from the introduction of Google’s AI overviews or from the competition of new generative AI platforms.
The potential impact of the trade war instigated by the introduction of steep US tariffs on major trade partners looms large in the second quarter. While it remains to be seen for how long tariffs will be in place and to what extent, the current rates stand to significantly impact consumer behavior and advertiser performance in the coming months, which could impact ad spend as soon as Q2. The frequency of significant updates to US tariff policy coming from the White House makes it difficult to estimate the full impact at this time.
Uncertainty surrounding US policy has already dampened the growth of one major platform in the form of TikTok. While TikTok advertisers have not yet walked away from the platform, median same-store growth fell from 13% in Q4 to an 11% decline in Q1, and advertisers are increasingly diversifying to other social platforms in case TikTok is ultimately banned. The number of advertisers active on Reddit and Snapchat rose 66% and 33% year over year in the first quarter, respectively.
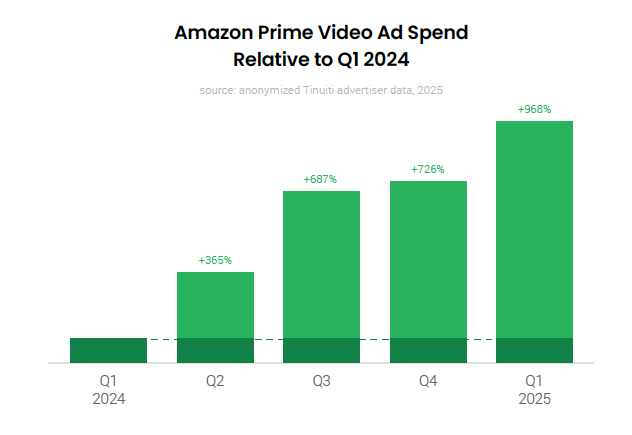
Another platform that’s grown significantly in adoption over the last year is Amazon Prime Video ads, with total (not same-store) spend up 968% from Q1 2024 to Q1 2025. The average cost of Prime Video ads fell in Q1 as Amazon continues to negotiate competitive rates in its race with other premium streaming video platforms to attract more advertisers.
Growth in the cost of Google paid search ad clicks slowed from 7% in Q4 to 5% in Q1 overall, but brand text ad CPC rose a whopping 19% year over year for the median Tinuiti advertiser. The cost of clicks on brand ads is a particularly sensitive subject for advertisers since most searchers who use a branded query are often looking to navigate to the brand’s website.
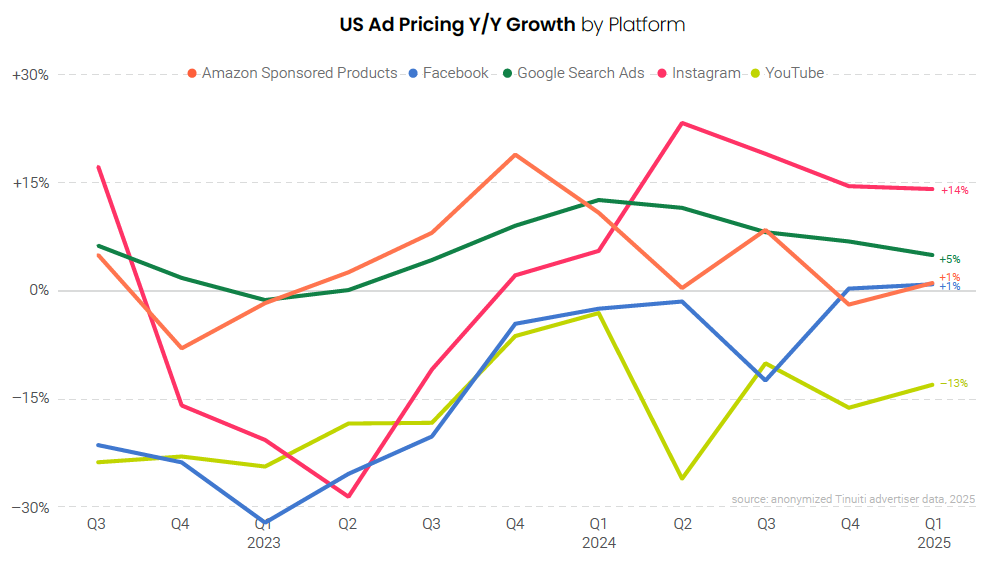
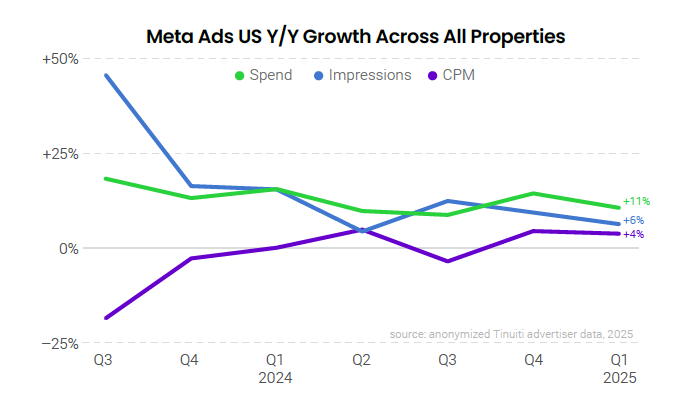
Meta CPM rose 4% in Q1, but growth was much higher for many advertisers, and over half of the brands studied saw CPM jump more than 10% year over year in Q1. Meta ads pricing increases were particularly strong on Instagram, with its 14% increase in CPM far outpacing the 1% increase observed on Facebook.
Advertisers grew investment across Meta properties by 11% year over year in Q1, a deceleration from 15% growth in Q4, as year-ago comparisons grew stronger in the first quarter. CPM rose 4% year over year, but many advertisers saw even bigger increases, with CPM up by double digits for more than 50% of the advertisers studied for this report. Impressions rose 6%, down from 9% growth in the final quarter of 2024.
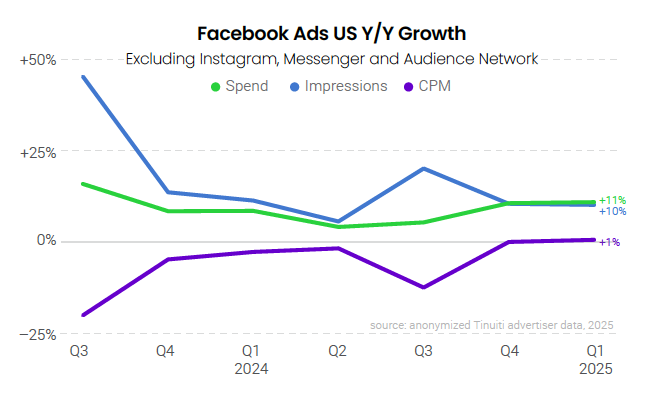
Advertisers increased spend on Facebook, excluding Instagram, Messenger, and Audience Network, by 11% year over year in Q1, the same growth observed in Q4 as impression and CPM growth held roughly steady from Q4 to Q1. Impression growth on Facebook has now outpaced that of Instagram for four straight quarters, as Reels inventory in particular has grown significantly over the past year on Facebook.
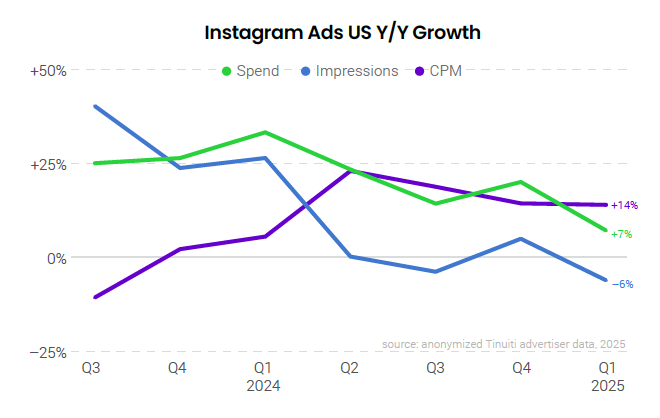
Spend growth for Instagram ads slowed from 20% in Q4 to 7% in Q1, largely owing to spend growth accelerating from 27% in Q4 2023 to 34% in Q1 2024. Impressions dipped 6% year over year, the second time in the last four quarters in which impressions fell from the year prior for Instagram advertisers. CPM rose 14% in the first quarter, the fourth straight quarter of double-digit increases.
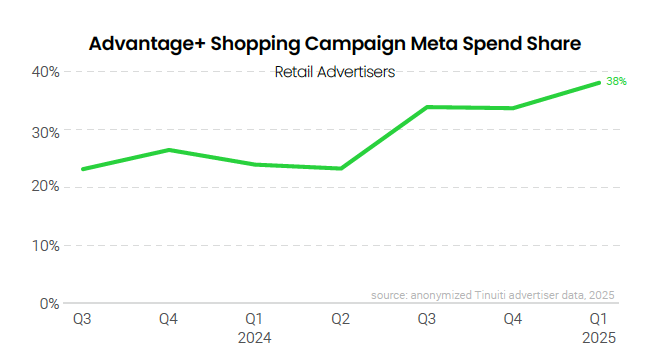
The share of total Meta investment attributed to Advantage+ shopping campaigns (ASCs) for retail advertisers rose to 38% in Q1 2025, up from 24% a year prior. While periods of under or over-delivery have frustrated advertisers in some circumstances, ASCs continue to be a valuable tool for reaching users across Meta properties and driving results for many brands.
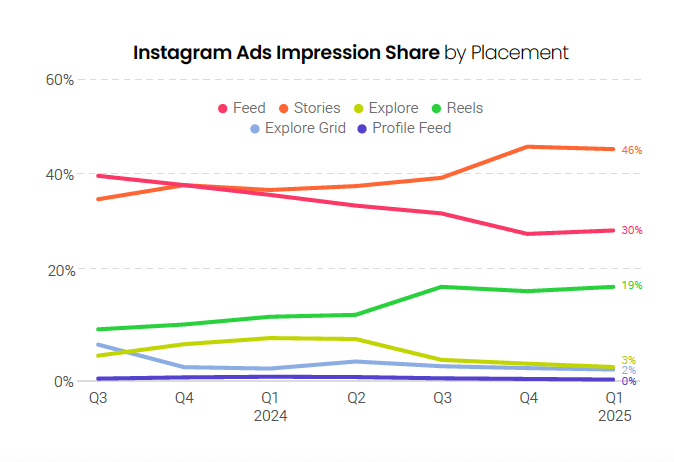
Stories eclipsed Feed ad placements in impression share for Instagram advertisers in Q1 2024 and have now accounted for the largest share of impressions on the platform for five straight quarters. Feed placements were responsible for 30% of impressions in Q1 2025, down from 37% a year prior. Reels ads accounted for 19% of ad impressions, up from 13% share last Q1. Impression share for Explore and Explore Home placements dipped from 11% combined in Q1 2024 to 5% combined in Q1 2025.
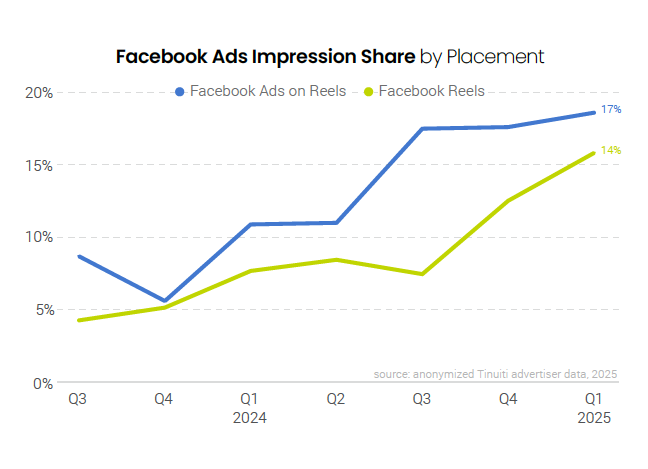
Reels video ads were responsible for 14% of all Facebook ad impressions in Q1 2025, double the 7% share observed in Q1 2024. Ads on Reels, formerly known as Reels Overlay ads, accounted for 17% of ad impressions in the first quarter, up from 10% a year prior. Combining these two placements, Reels now account for 31% of all Facebook ad impressions, compared to 27% in Q4 and 17% back in Q1 2024. This far outpaces the 19% share observed on Instagram, largely because Ads on Reels aren’t being featured on Instagram.
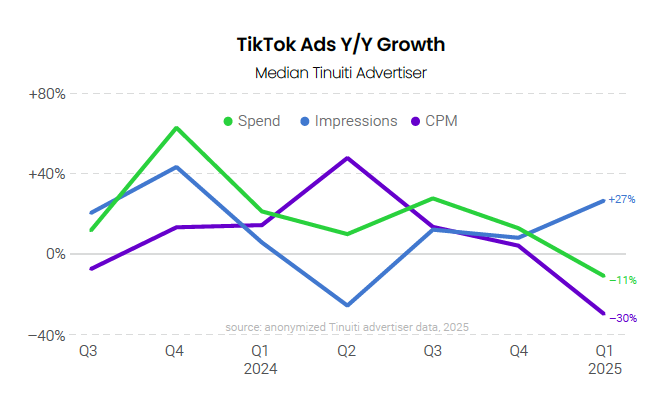
The median advertiser active on TikTok since at least Q1 2024 reduced spend 11% year over year in the first quarter of 2025. Impressions rose 27%, but the cost of ad impressions fell 30% year over year, the biggest decline ever observed for Tinuiti advertisers. While advertisers have not yet walked away from TikTok as an advertising platform, continued uncertainty regarding its future in the US is leading brands to explore other platforms in order to diversify social investment.
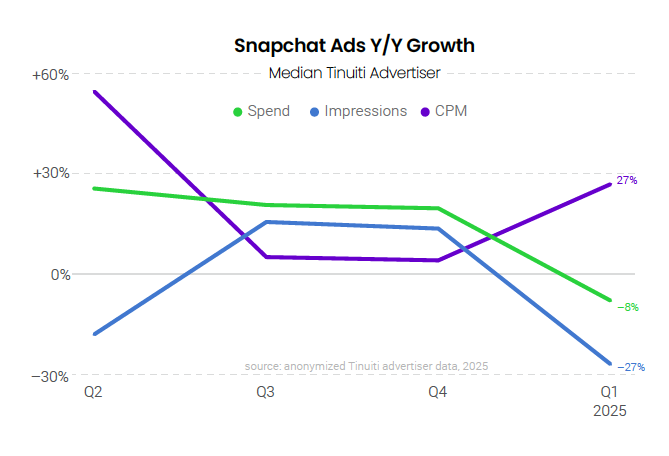
Spend growth slowed from a 20% increase to an 8% decline year over year for the median Snapchat advertiser active on the platform since as least Q1 2024. However, the total number of social advertisers active on Snapchat rose 33% from Q1 2024 to Q1 2025, as more brands are folding Snapchat into their marketing strategy over time. This trend was recently bolstered by advertisers looking to diversify social media investment given TikTok’s uncertain future in the US.
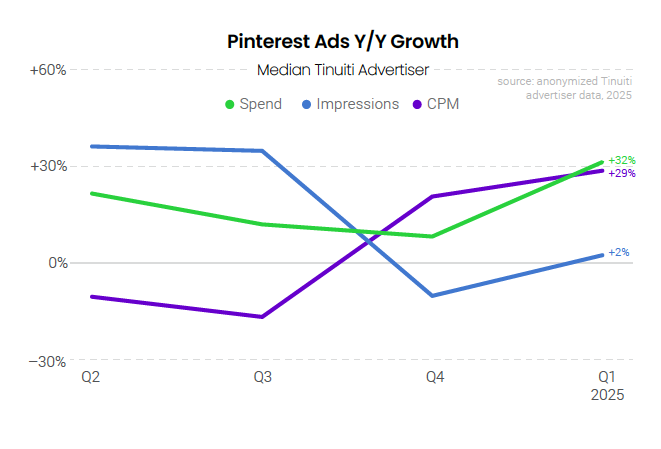
The median Pinterest advertiser active on the platform since at least Q1 2024 increased spend 32% year over year, with a 2% increase in impressions and 29% increase in CPM, marking the second straight quarter of CPM growth over 20%. Pinterest advertisers are increasingly leaning into the Performance+ suite of AI and automation tools, with features like the Performance+ ROAS bidding tool and Performance+ creative proving effective at driving results for early adopters.
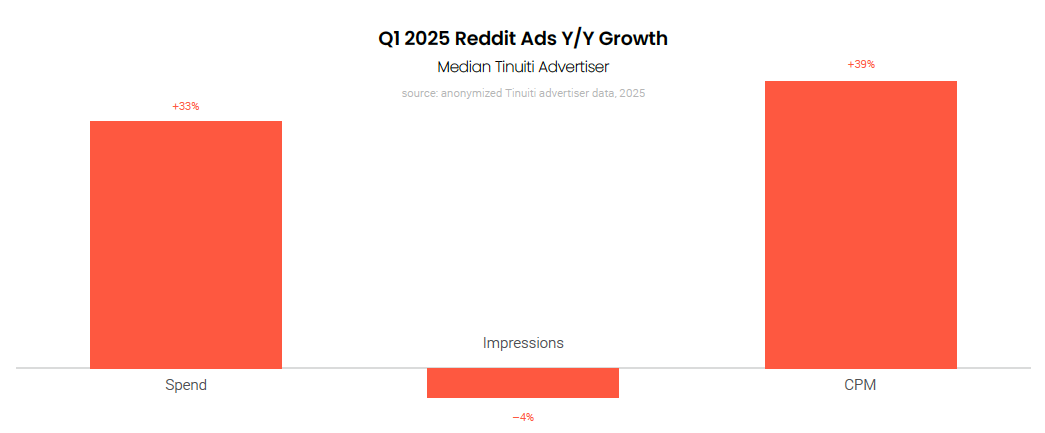
Advertising spend on Reddit rose 33% year over year for the median advertiser active on the platform since at least Q1 2024, with a 4% decline in impressions and 39% increase in CPM. In addition to strong same-store growth, the number of brands active in Reddit ads has grown markedly over the last year, with 66% more active advertisers in Q1 2025 than in Q1 2024 among Tinuiti clients. The uncertainty around the future of TikTok in the US is helping to push more advertisers to platforms like Reddit in hopes of diversifying social spend.
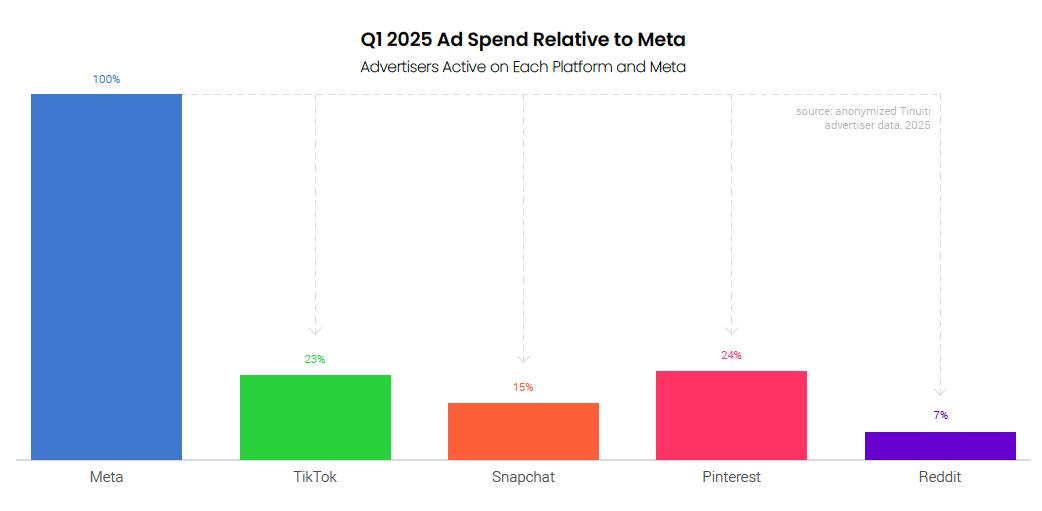
Meta continues to account for the lion’s share of most social budgets, but advertisers are steadily diversifying social investment over time. In Q1 2025, advertisers active on both Pinterest and Meta spent 24% as much on Pinterest as on Meta. The equivalent figure is 23% for TikTok, 15% for Snapchat, and 7% for Reddit. Important to note is that the number of advertisers active on these platforms is much lower than Meta and varies between them.
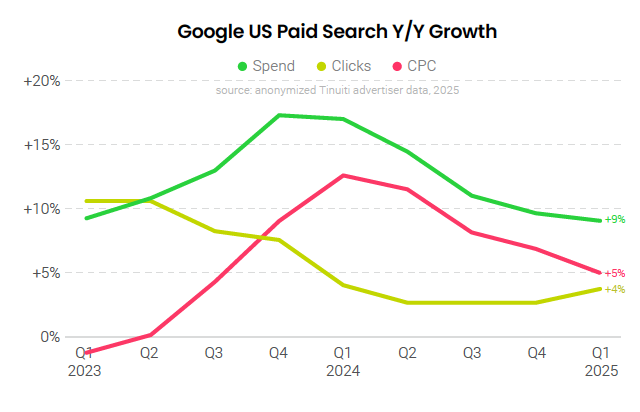
Spending on Google search ads grew 9% year over year in Q1 2025, which was down slightly from 10% growth a quarter earlier. Click growth accelerated modestly to 4% year over year, but spending growth remained driven primarily by higher click costs, with average CPC rising 5%. CPC growth was particularly high for branded text search ads, while shopping search ad CPCs fell slightly in Q1.
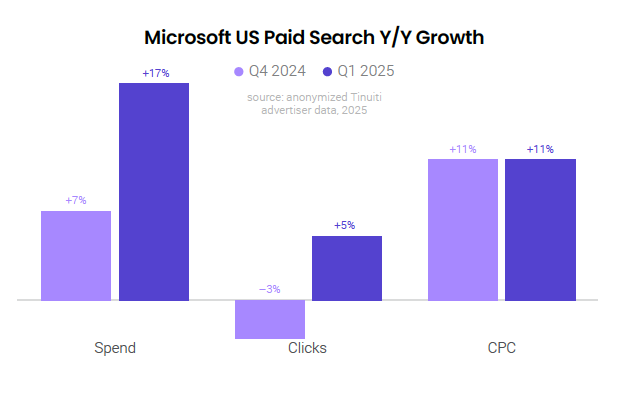
Microsoft search ad spending grew 17% year over year in Q1 2025, up from 7% growth in Q4 2024 for Tinuiti clients. Across text, shopping, and Performance Max formats, Microsoft search ad clicks grew 5% year over year in Q1, up from a 3% decline in Q4. Similar to Google, Microsoft search ad spending was driven mostly by increases in click costs in Q1 as average CPC rose 11% year over year, which was steady with Q4.
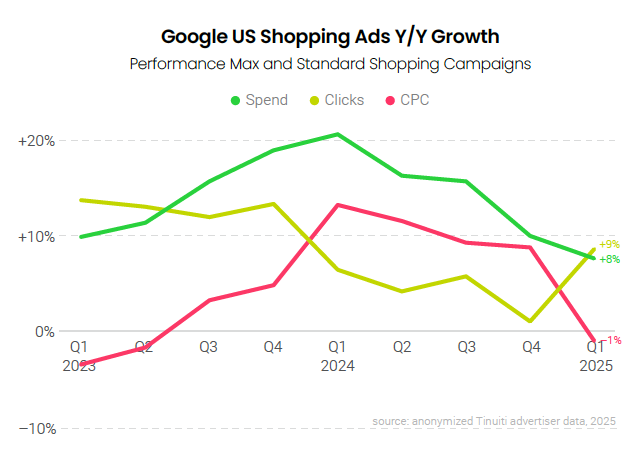
Spending on Google shopping ads, including both Performance Max (PMax) and standard Shopping campaigns (SSCs), was up 8% year over year in Q1 2025, down from 10% growth in Q4 2024. Advertisers did see better click growth from Google shopping formats in Q1 as clicks rose 9% year over year, compared to just a 1% increase a quarter earlier. At the same time, the average CPC for Google shopping ads fell 1% year over year in Q1, compared to a 9% increase in Q4.
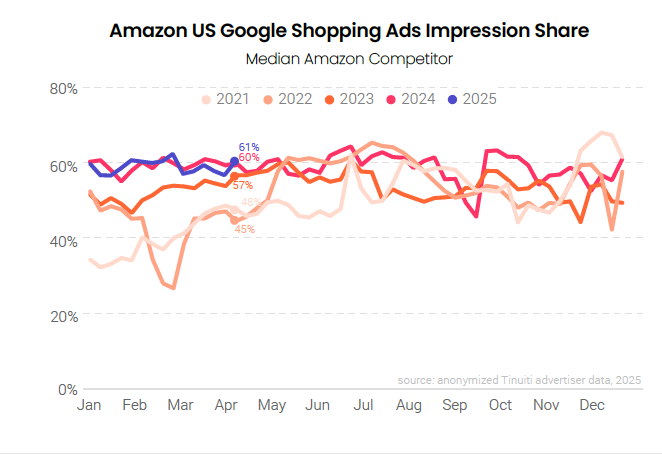
Amazon’s presence in Google shopping ad auctions over the course of Q1 2025 was very similar to a year earlier as its impression share against the median retailer trended close to 60% throughout Q1 2025 just as it did in Q1 2024. In earlier years, Amazon typically ramped up its presence in Google auctions over the first half of the year, but it now appears to be maintaining a more consistent level of aggressiveness throughout the year.
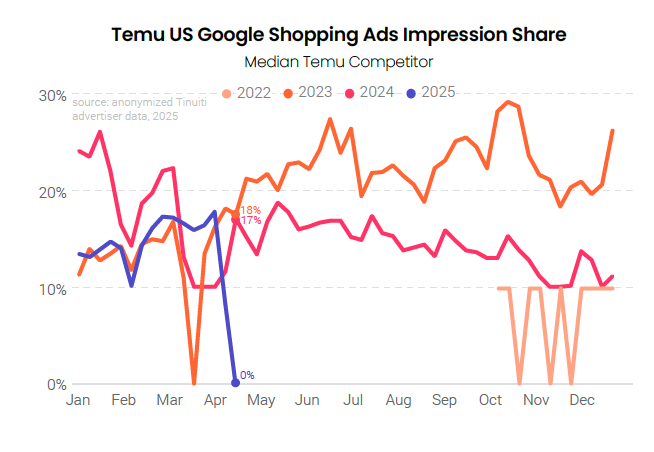
Although its share of Google shopping impressions ramped up over Q1 2025, Temu’s presence in Google auctions fell precipitously over April 9th through 12th as it became clearer that US plans to eliminate the de minimis tariff exemption in early May and to institute other hefty tariff hikes on Chinese goods were not likely to be quickly reversed. To begin the week of April 14th, Temu’s share of Google shopping ad impressions had fallen to zero against the median retail brand.
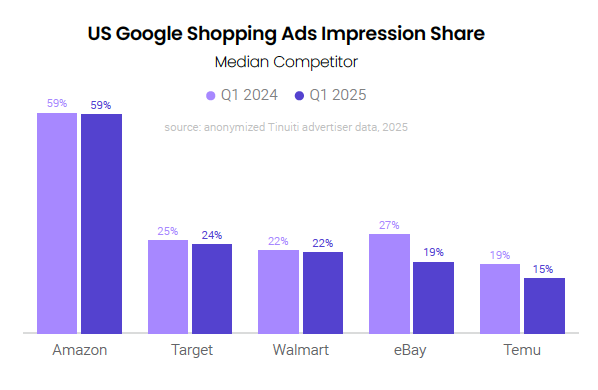
Although Temu increased its share of Google shopping impressions from Q4 2024 to Q1 2025, it still saw a lower share of impressions than in Q1 2024. Among top retail brands, eBay saw the biggest decline in Google shopping ad impression share from Q1 2024 to Q1 2025, though, while Amazon, Target, and Walmart saw just minor declines.
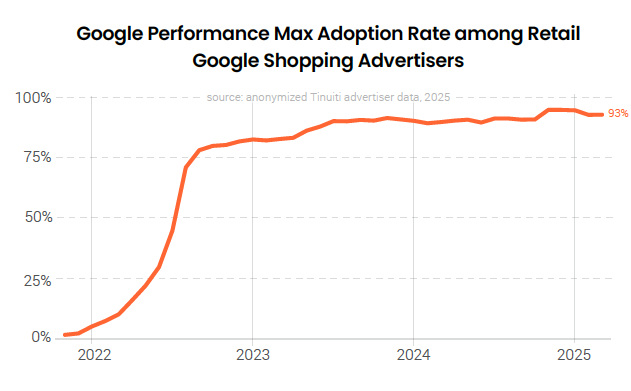
The adoption rate of Performance Max campaigns among retailers running shopping ad listings with Google stood at 93% to close out Q1 2025. That was down two points from the end of 2024, but up three points from March 2024. The widespread adoption of PMax campaigns speaks to their importance as brands look to expand their reach across Google properties and placements.
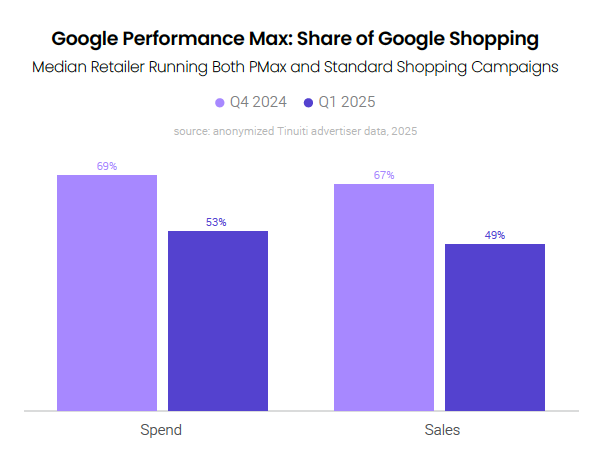
Across retail brands running both Performance Max and standard Shopping campaigns, PMax campaigns accounted for 53% of Google shopping ad spending for the median retailer and generated 49% of sales revenue. Over the Q4 holiday season, the typical retailer leaned more heavily into Performance Max which saw its spend share hit 69%. In early 2025, some advertisers have looked to shift spend back to standard Shopping campaigns, in part for the additional controls they provide.
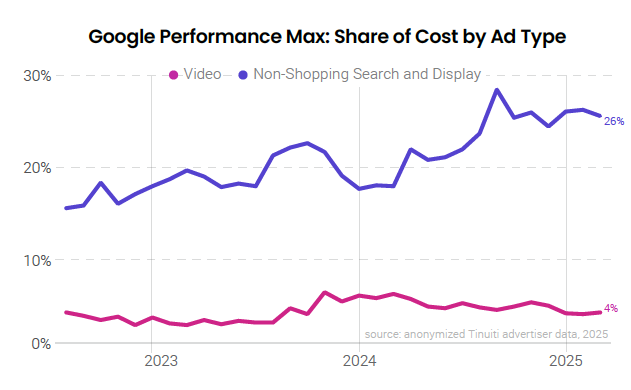
After rising appreciably over the first three quarters of 2024, the share of PMax costs generated by video and other non-shopping search and display inventory has largely held steady since October 2024. Video share of PMax spending averaged 3% over Q1 2025, down a point from Q4 2024. Other non-shopping search and display inventory accounted for 26% of PMax spending in Q1 2025, which was up a point from Q4.
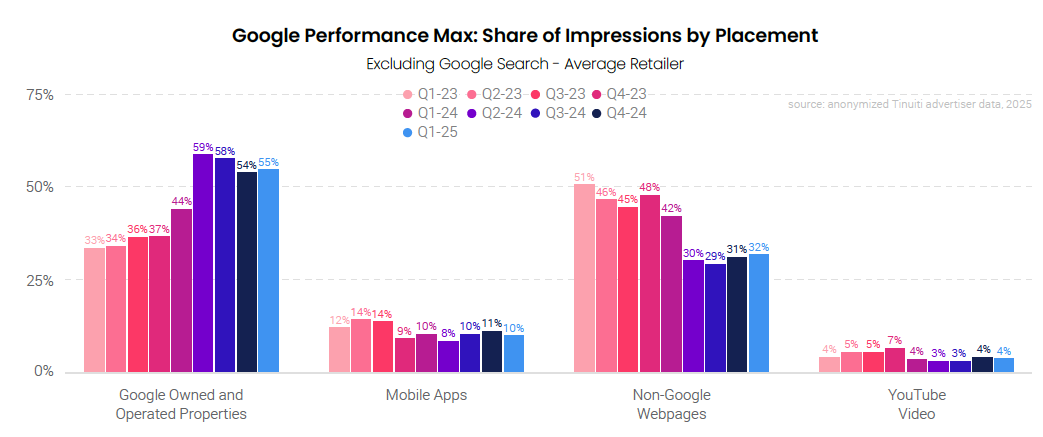
Excluding Google search and YouTube video, other Google owned and operated properties accounted for 55% of PMax impressions in Q1 2025, up from 44% a year earlier. In March 2024, Google began applying account level placement exclusions to the Search partner network, which led to a decline in impression share for non-Google placements. Non-Google webpages generated 32% of PMax placement impressions in Q1 2025, down from 42% a year earlier. YouTube video placements accounted for 4% of PMax impressions in Q1.
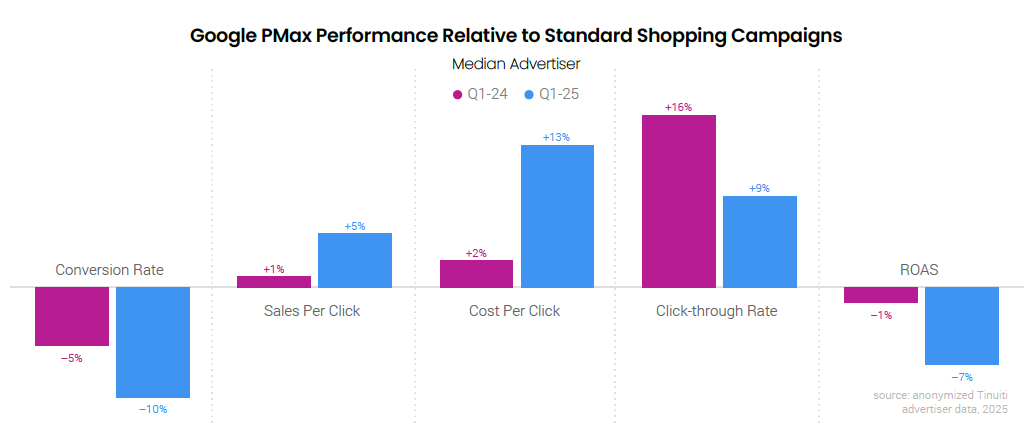
Performance Max campaigns have done well to live up to their moniker, with key metrics generally comparing well to standard Shopping campaigns even as PMax draws in inventory from more disparate sources. In Q1 2025, the median advertiser saw PMax generate a 5% higher sales per click than SSCs despite conversion rates running 10% lower. With CPC running 13% higher for PMax campaigns, advertisers did generate a 7% lower return on ad spend for PMax, a gap that widened compared to a year earlier.
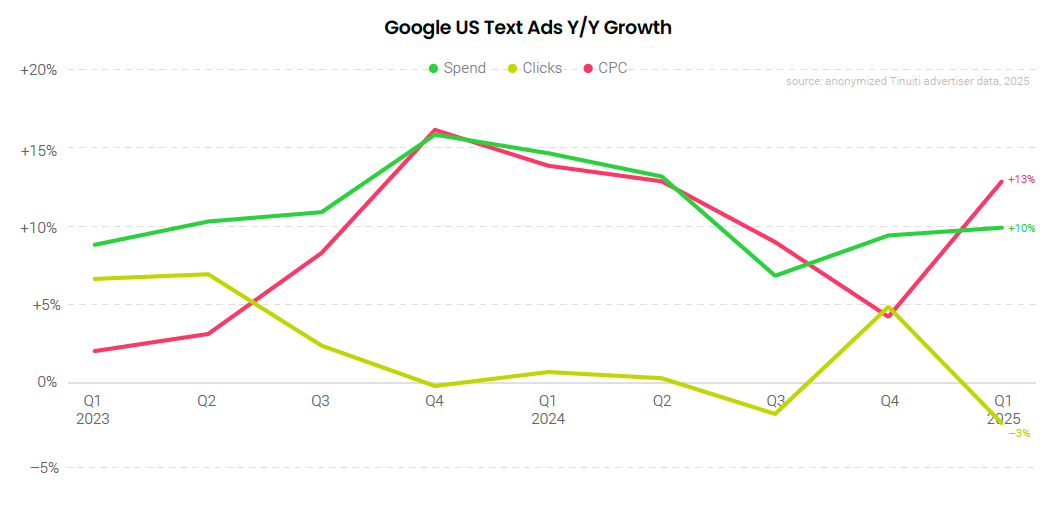
Since 2020, Google text ad CPC growth has outpaced that for Google shopping ads in all but three quarters. Two of those three quarters were over the back half of 2024, but that trend proved to be short-lived as advertisers saw a significant spike in text ad CPCs to start 2025. All told, Google text ad spending was up 10% year over year in Q1 2025 as CPCs rose 13% and clicks fell 3%.
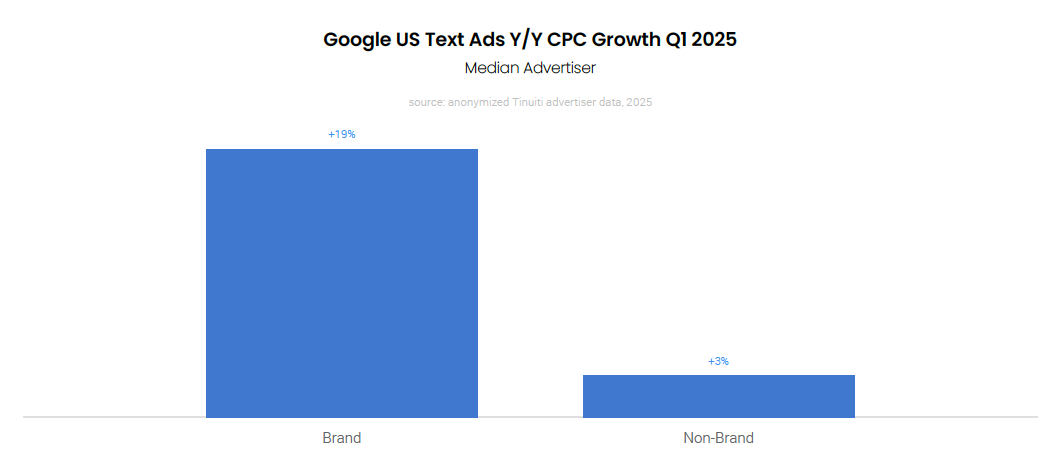
Breaking down Google text ad CPC growth trends by keyword type, targeted keywords containing the advertiser’s own brand name saw much higher CPC growth in Q1 2025 than non-brand keywords. Brand text ad CPCs rose 19% year over year in Q1 for the median advertiser compared to just 3% for non-brand keywords. While some advertisers saw spikes in brand CPC in February, growth was elevated throughout the entire quarter for the typical advertiser.
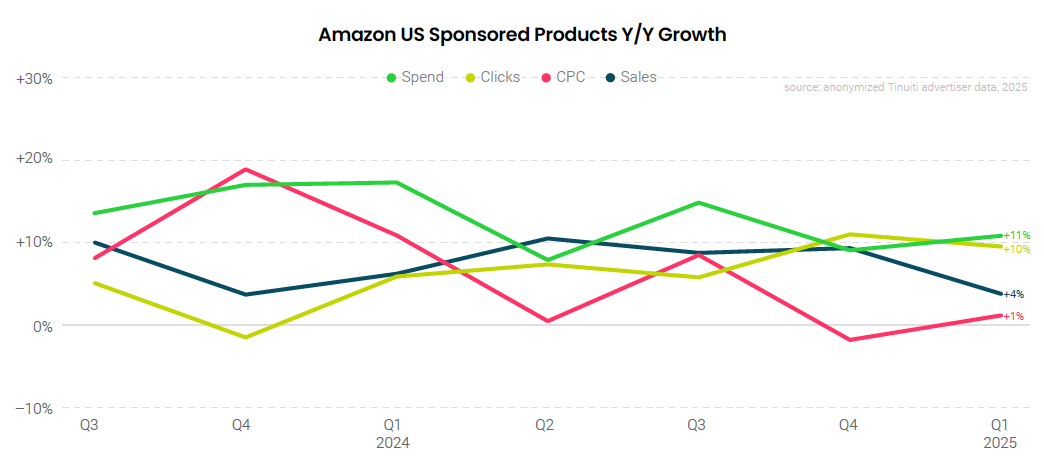
The cost of Sponsored Products clicks jumped 19% year over year in Q4 2023, but pricing growth has since slowed, with CPC up just 1% year over year in Q1 2025. Spend on Sponsored Products increased 11% in the first quarter, accelerating from 9% growth in Q4, as clicks rose 10%. Newer Sponsored Products inventory sources such as placements on partners like Pinterest have yet to produce meaningful click volume for Amazon advertisers.
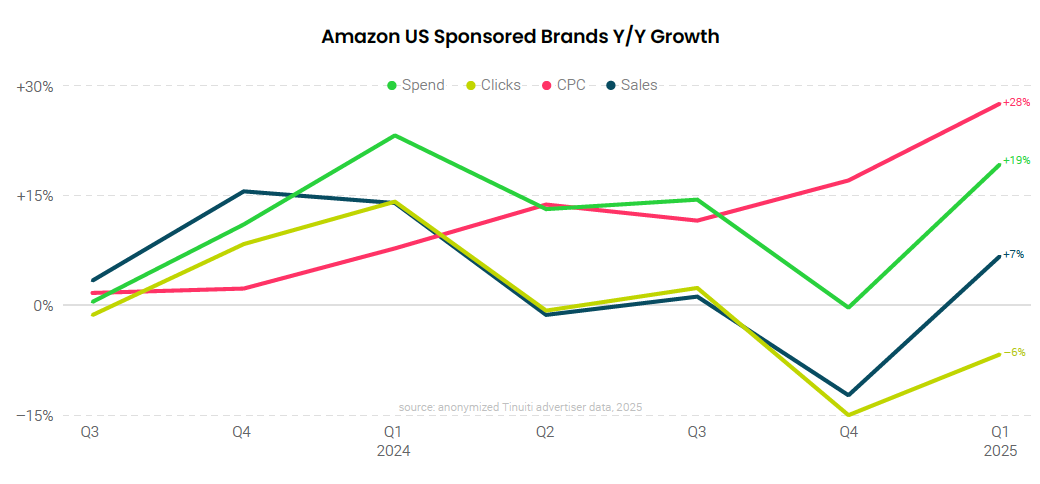
Sponsored Brands spend rose 19% year over year in the first quarter, the strongest growth observed since last Q1 and a significant rebound from flat growth in Q4 2024. Clicks fell 6% year over year, the third time in the last four quarters that clicks for the format have fallen. CPC rose 28% year over year, the fourth straight quarter of double-digit growth in the cost of Sponsored Brands clicks.
Sponsored Brands spend rose 19% year over year in the first quarter, the strongest growth observed since last Q1 and a significant rebound from flat growth in Q4 2024. Clicks fell 6% year over year, the third time in the last four quarters that clicks for the format have fallen. CPC rose 28% year over year, the fourth straight quarter of double-digit growth in the cost of Sponsored Brands clicks.
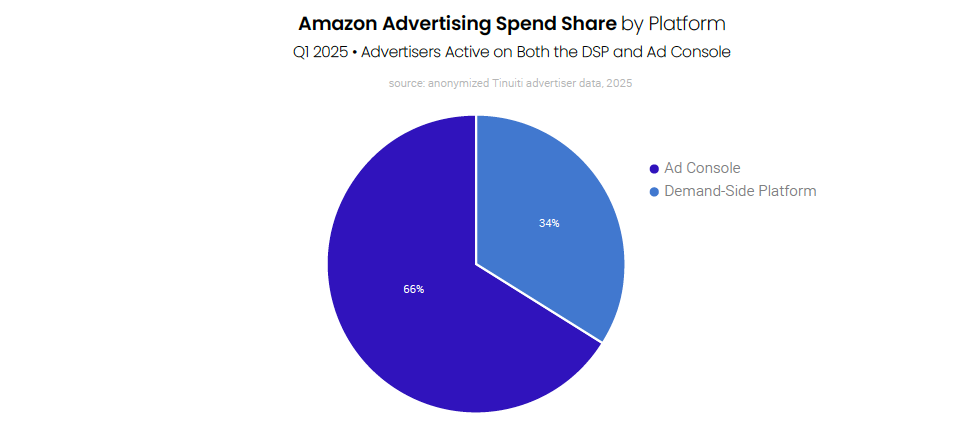
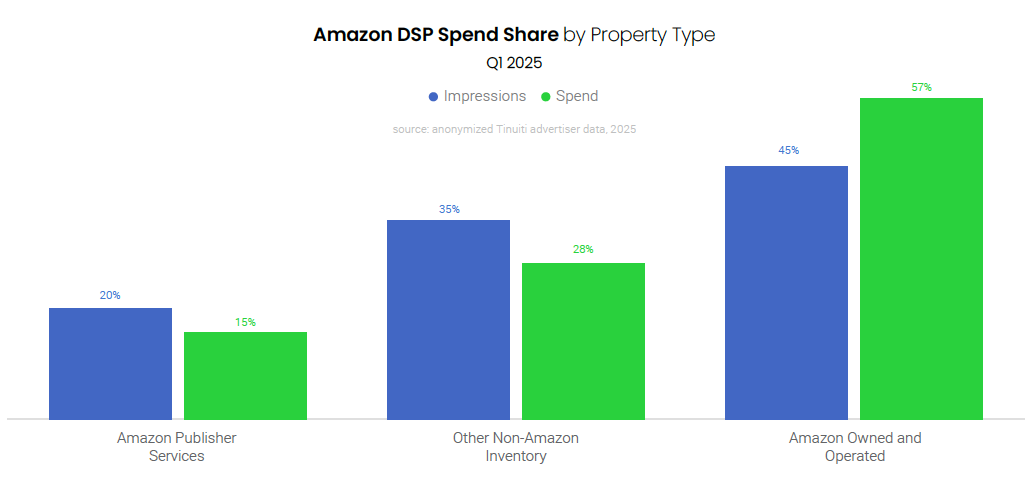
Endemic advertisers targeting inventory through the Amazon DSP spent 34% of total Amazon investment on the DSP, with the remaining 2/3 attributed to Sponsored Products, Sponsored Brands, and Sponsored Display campaigns targeted through the Ad Console. This figure does not include non-endemic advertisers (brands that don’t sell products on Amazon but do advertise through the DSP), which have grown in numbers since the introduction of Prime Video ads in January 2024.
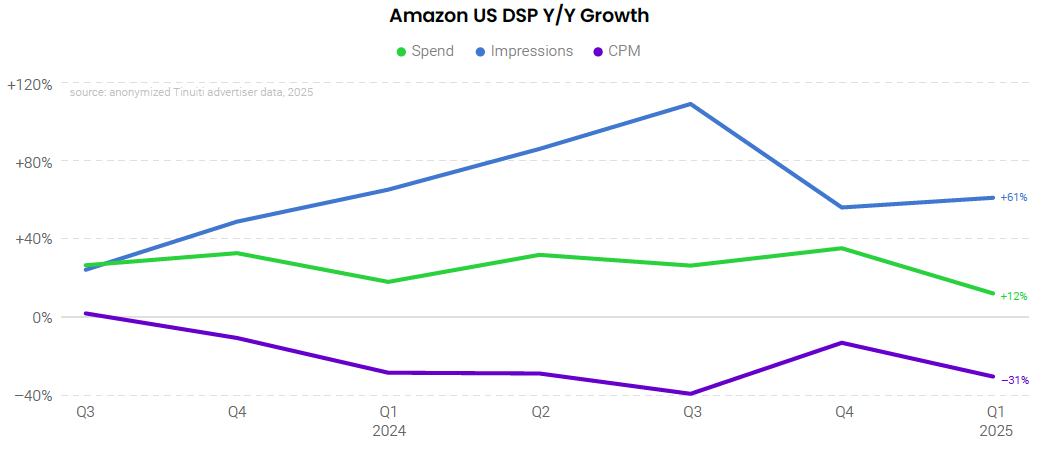
Spend on the Amazon DSP rose 12% year over year for advertisers active throughout Q1 2024 and Q1 2025. Importantly, this figure does not include those advertisers who only just became active on the DSP in order to target Prime Video inventory in late Q1 2024, as those brands were not active throughout the full quarter. It does include those brands that were already active on the DSP prior to the January 29, 2024 launch of Prime Video ads and incorporated Prime Video as part of their strategy following the launch.
Fully 57% of all Amazon DSP spend went to inventory on pages owned and operated by Amazon, including the Amazon website and app as well as other websites and apps like IMDb. This inventory accounted for just 45% of impressions, as the cost of Amazon owned and operated inventory continues to outpace that of other sources. Amazon Publisher Services sites accounted for 15% of DSP spend, while other non-Amazon inventory accounted for 28% of investment.
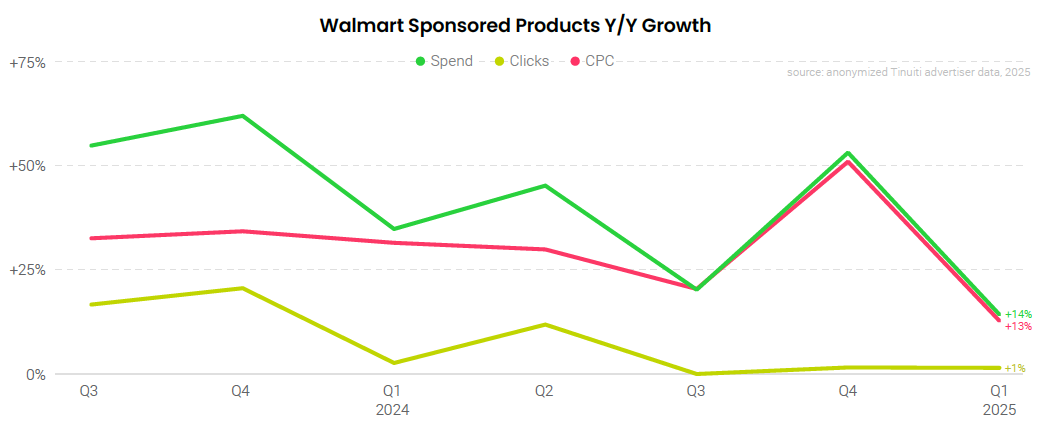
Spend on Walmart Sponsored Products rose 14% in the first quarter, slowing from a torrid 53% increase in Q4. Year-over-year click growth held steady at 1% from Q4 to Q1, but CPC rose just 13% in the first quarter compared to a 51% jump in Q4. Despite recent increases, CPC in Q1 2025 was below where it was in Q1 2022, prior to Walmart’s June 2022 shift from a first-price to a second-price auction that sent CPC down significantly. Recent CPC growth has largely been accompanied with corresponding growth in sales per click.
Walmart advertisers spent 7% of their search advertising investment on Sponsored Brands and 6% on Sponsored Videos in Q1 2025. These campaign types accounted for just 6% of Walmart search spend combined last Q1, as they’ve become a more important part of advertising on Walmart over time. Much like they are on Amazon, Sponsored Products ads are still the most important search format on Walmart, accounting for 87% of Walmart search spend in the first quarter.

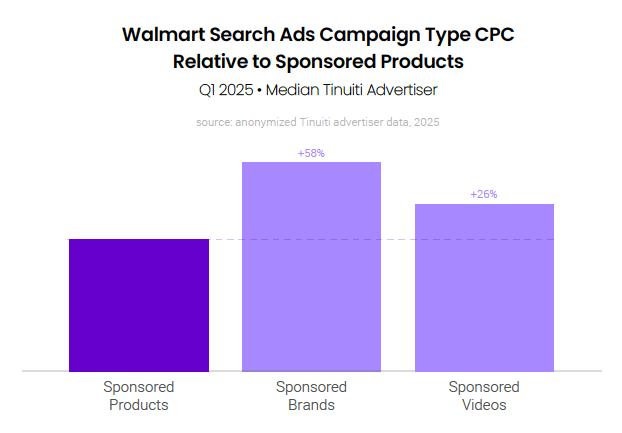
Sponsored Videos CPC was 26% higher than Sponsored Products for the median advertiser targeting both formats in the first quarter, a dip from the 35% higher CPC observed in Q4. Sponsored Videos historically had a $1.30 minimum CPC for advertisers to participate in auctions, but Walmart updated that minimum to $0.80 at the start of November 2024, making Q1 the first full quarter in which the lower minimum was in place. Sponsored Brands continue to have a minimum CPC of $1.
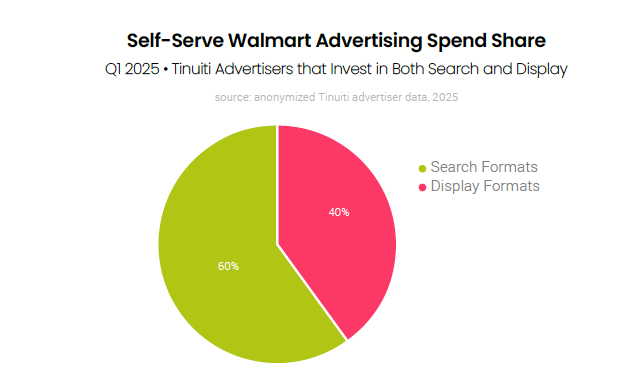
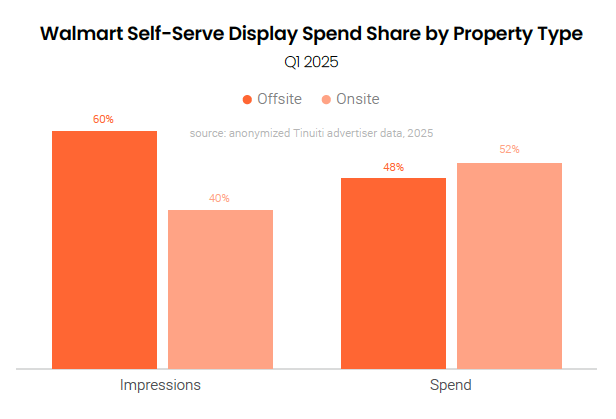
Onsite and offsite self-serve display advertising accounted for 40% of all Walmart investment in the first quarter for brands deploying both display and search advertising formats. Some managed onsite advertising packages will be sunset in July of this year, such that self-serve will grow in importance for advertisers looking to target Walmart owned and operated display inventory in the second half of the year.
Advertisers can use Walmart’s display advertising tools to target inventory both on and off of Walmart’s website and app. In the first quarter of 2025, 52% of all Walmart display advertising spend went to inventory on Walmart’s website and app, down from the 68% of spend this inventory accounted for in Q4. By comparison, offsite inventory rose from 32% of spend a quarter prior to account for 48% in Q1.
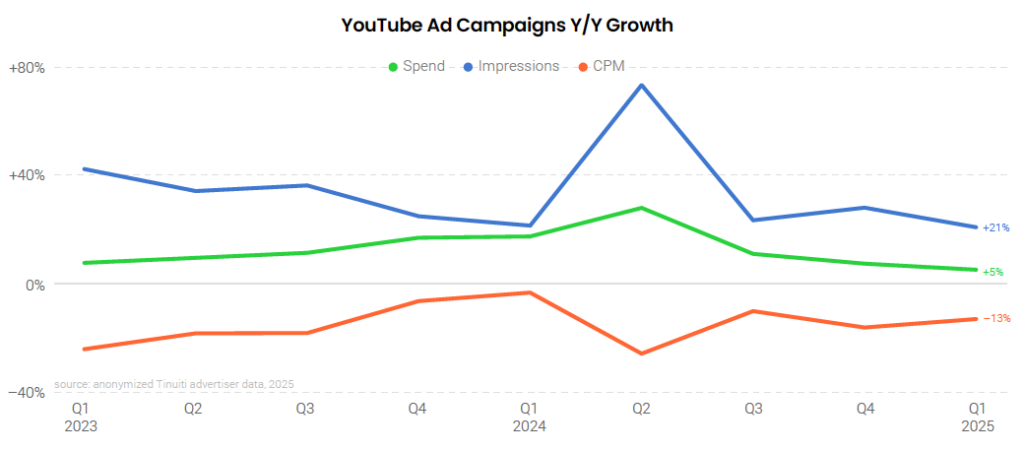
Spending on YouTube video ad campaigns was up 5% year over year in Q1 2025, down from 7% growth in Q4 2024. YouTube impression growth slowed from 28% year over year in Q4 to 21% in Q1, while average CPM declines lessened from a 16% drop in Q4 to a 13% decline in Q1. Importantly, YouTube inventory is increasingly purchased through other Google campaign types including Demand Gen campaigns. In Q3, Google will transition Video Action Campaigns to the Demand Gen model, further accelerating this trend.
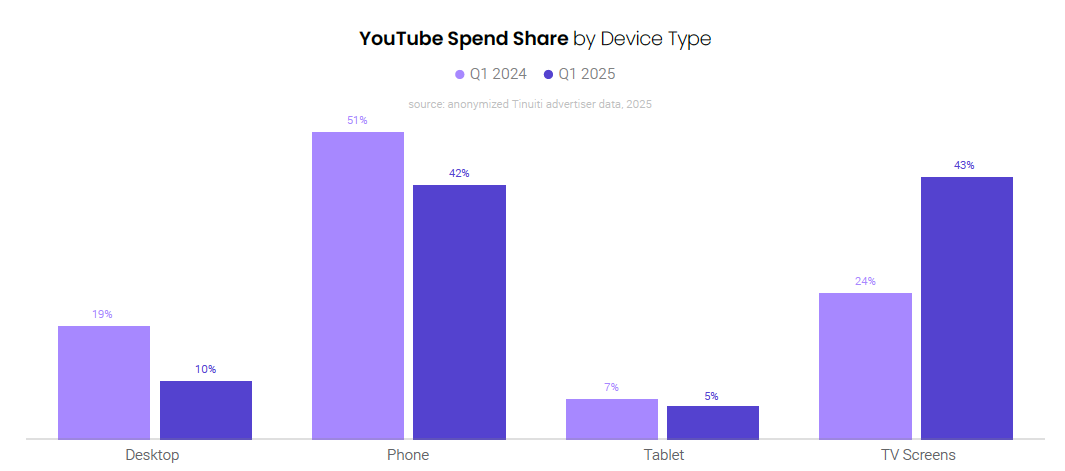
In February 2025, YouTube officially noted that television was the primary viewing device across all of its services as of the end of 2024. In terms of advertiser spending on YouTube video ad campaigns, TV screens accounted for 43% of spend in Q1 2025, just outpacing phones at 42%. Desktop contributed 10% of YouTube spending in Q1, while tablets added 5%. Total spending on YouTube ads on TV screens was up 88% year over year in Q1.
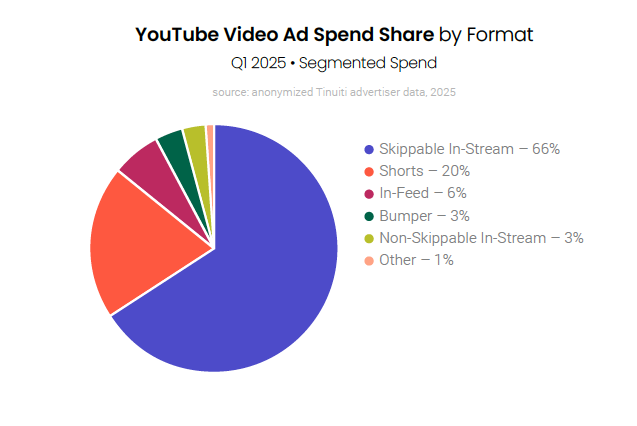
On average, about half of YouTube ad spend is reported back to the advertiser with the format being unsegmented by Google. Looking just at reportable segmented YouTube ad spend, Shorts accounted for 20% of spending in Q1 2025. At 66%, the largest share of segmented YouTube spending in Q1 went to skippable in-stream ads. In-feed ads accounted for 6% in Q1, while bumper and non-skippable in-stream ads each accounted for 3%.
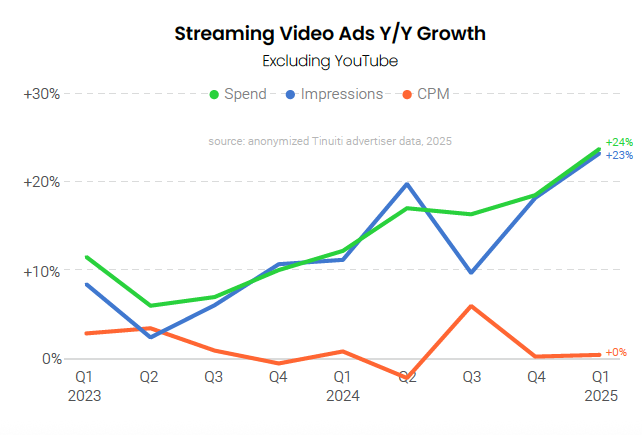
Across the major streamers and other video ad inventory sources outside of YouTube, streaming video ad spending was up 24% year over year in Q1 2025, an acceleration from 19% growth in Q4. Streaming video ad impression growth improved to 23% while CPM growth remained flat year over year. The entry of Prime Video ad inventory in Q1 2024 has provided a boost to streaming video spending and impressions in the last year, but there has been pressure across platforms to keep CPMs competitive to attract advertisers.
Amazon Prime Video ads launched near the end of January in 2024, so a full quarterly year over year comparison is still not possible, but advertiser investment has increased each of the last four quarters including from Q4 2024 to Q1 2025. Total spending on Prime Video ads was nearly 11 times as high in Q1 2025 as it was in Q1 2024, while investment increased 29% from Q4 2024 to Q1 2025.
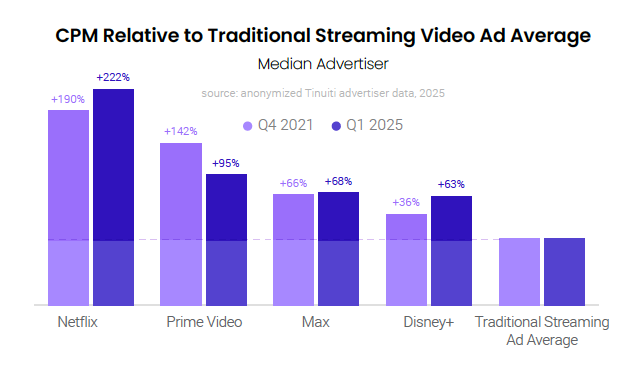
A Prime Video impression cost roughly twice as much as the traditional streaming video ad average in Q1 2025, which was down from about 2.4 times the average rate in Q4 2024. Other premium streaming video ad inventory sources saw mixed movement in CPMs relative to average with Netflix and Disney+ seeing a lift, while Max saw CPM hold roughly steady relative to average.
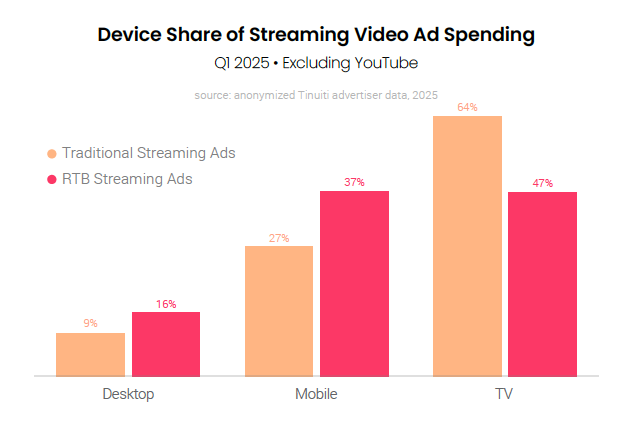
TV screens accounted for 64% of ad costs for traditionally-purchased streaming video ad inventory in Q1 2025. Mobile devices, including both phones and tablets, accounted for 27% of traditional streaming video ad spending, while computers contributed 9%. Real-time bidding (RTB) streaming video ad inventory was more mobile-focused, but TV still accounted for the largest share of spending at 47%. Mobile spending share was 37% for RTB inventory, while computer share was 16%.
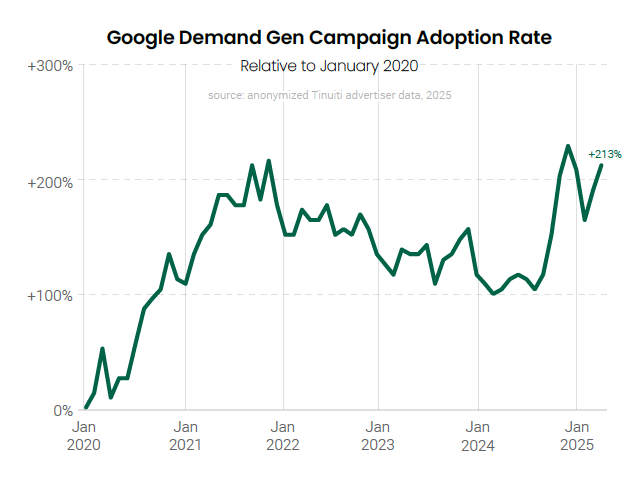
After a bit of a dip to start the year, the adoption rate of Google Demand Gen campaigns rose to close out the quarter. At the beginning of April 2025, Google removed the ability to create new Video Action Campaigns and recommended advertisers use Demand Gen campaigns instead. In July, any remaining Video Action Campaigns will be converted to Demand Gen campaigns. In anticipation of these changes, more advertisers have adopted and used Demand Gen campaigns for video reach.
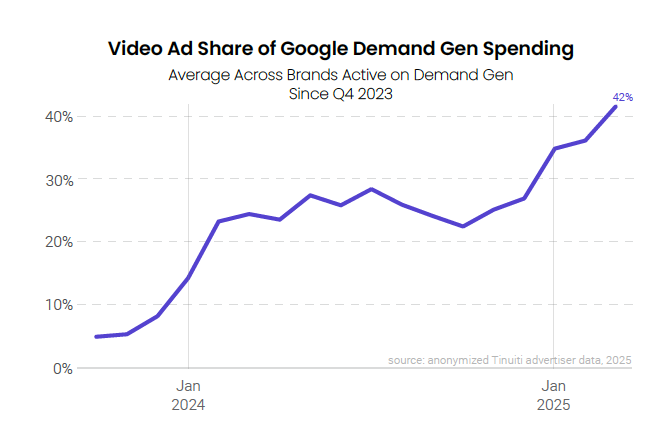
Ahead of Google’s April change to remove the ability to create Video Action Campaigns, more advertisers have been testing into Demand Gen’s video ad capabilities and inventory, and video’s share of Demand Gen spend reaching an all-time high of 42% in March 2025. Although many brands are not generating YouTube spending through Demand Gen yet, those that do are already seeing it as a significant contributor, accounting for an average of 20% of Demand Gen spending in March 2025.
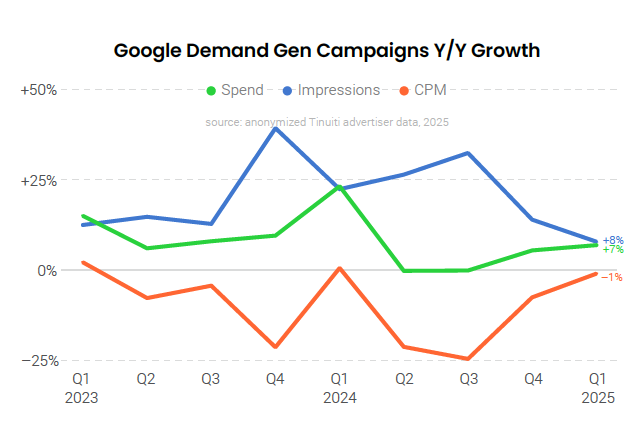
For brands that were active on Google Demand Gen campaigns over both Q1 2024 and Q1 2025, ad spending was up 7% year over year in Q1, up from 5% growth a quarter earlier. Demand Gen impression growth was 8% year over year, while average CPM fell 1% year over year. While Demand Gen spending growth has been picking up, it should receive a further boost in the months ahead from Google’s transition of Video Action Campaigns to the Demand Gen model.
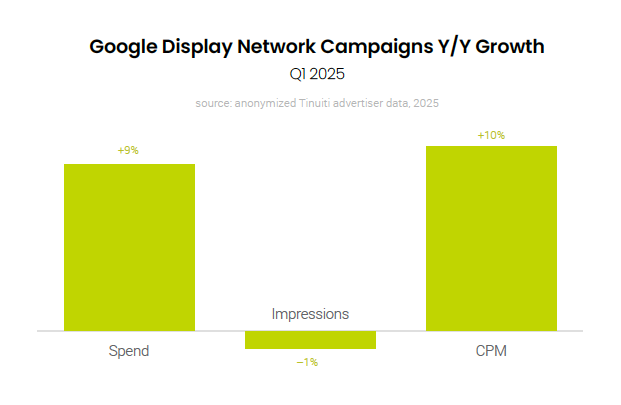
Brand spending on ads placed through the Google Display Network (GDN) was up 9% year over year in Q1 2025, which
was a slight deceleration from 11% growth a quarter earlier. GDN impressions fell
1% year over year in Q1 2025, while the average CPM rose 10%. While the GDN primarily offers display impressions, advertisers can also use it to access app
and video inventory.
Check out our most recent Digital Ads Benchmark Report for more exclusive insights.
