Amazon Attribution: Everything You Need to Know in 2023


Amazon has long been a top retail destination of choice for many US consumers. Brands selling on Amazon can benefit greatly from analyzing the effectiveness and impact that off-Amazon traffic sources have on their Amazon performance and sales. In 2020, Amazon made that clarity possible with the launch of Amazon Attribution, a free-to-use measurement solution.
“Amazon Attribution gives brands that sell on Amazon the data needed to invest more heavily in advertising off of Amazon to drive sales. It opens up the opportunity to create full funnel, multi-channel marketing campaigns to support sales goals for our clients across the board.”

— Nii Ahene, Chief Strategy Officer, Tinuiti
Amazon Attribution is a free analytics measurement solution that provides brands that sell on Amazon with sales impact analysis across media channels off Amazon. With this official solution, brands can measure the performance their display, search, social, video, and email campaigns have on consumers discovering, researching, and buying their products on Amazon.
With on-demand reporting, Amazon Attribution allows advertisers and brands to uncover the insights needed to optimize their media campaigns and grow product sales. This provides a comprehensive view into how each marketing tactic contributes to a brand’s shopping activity on Amazon.
Amazon Attribution provides a solution by allowing brands to:
Amazon Attribution is available to vendors, KDP authors, and professional sellers enrolled in Amazon Brand Registry who are advertising on channels outside of Amazon. It is also available to agencies like Tinuiti who have clients who sell products on Amazon. Amazon Attribution measurement can be accessed via the self-service console or through tool providers integrated with the Amazon Ads API.
Amazon Attribution is currently available in nearly a dozen countries, including the US, Canada, and Mexico in North America.
Amazon Attribution measures and reports both orders and revenue from traffic originating off of Amazon driven to an Amazon.com listing. Amazon Attribution reporting metrics include clicks and Amazon conversion metrics, including Impressions, Detail Page views, Add to Carts, and purchases per ad channel. Reports can be easily downloaded or accessed within the console.
The benefits Amazon Attribution offers can largely be grouped into three primary categories, enhancing: Measurement, Optimization, and Planning. Let’s see how Amazon Attribution can help you MOP up more sales!
At its core, Amazon Attribution is a measurement tool. It removes the mystery box around which non-Amazon driven traffic avenues are driving the best performance, providing the full picture that brands and advertisers need to create comprehensive, holistic, efficient campaigns. The effectiveness of each channel at achieving the desired outcomes is illustrated through Amazon sales impact analysis.
Simply put, Amazon Attribution helps eliminate trying to piece together which marketing efforts are working, which aren’t, and where you should be devoting more or less attention and ad spend in reaching your goals.
Thanks to Amazon Attribution’s on-demand reporting, in-flight optimizations can be quickly made. If certain channels stand out as top performers or low performers, you can experiment with shifting budgets, continuing to refine until every ad dollar is going where it will have the biggest impact on your bottom line.
Regularly reviewing channel performance and relevant Amazon audience segment insights helps in planning future marketing strategies that can maximize ROI. Consider every element that might have impacted your conversion metrics, including messaging style and supportive imagery or videos. With performance data that can be viewed at the ASIN, audience, creative, and keyword levels, you’ll have ample insights to work with in understanding what’s working and what isn’t.
Amazon is the number one online marketplace in the USA, so it’s only natural to question why you’d need to drive outside traffic to your listings. Let’s explore a few reasons you should consider implementing an off-Amazon advertising strategy.
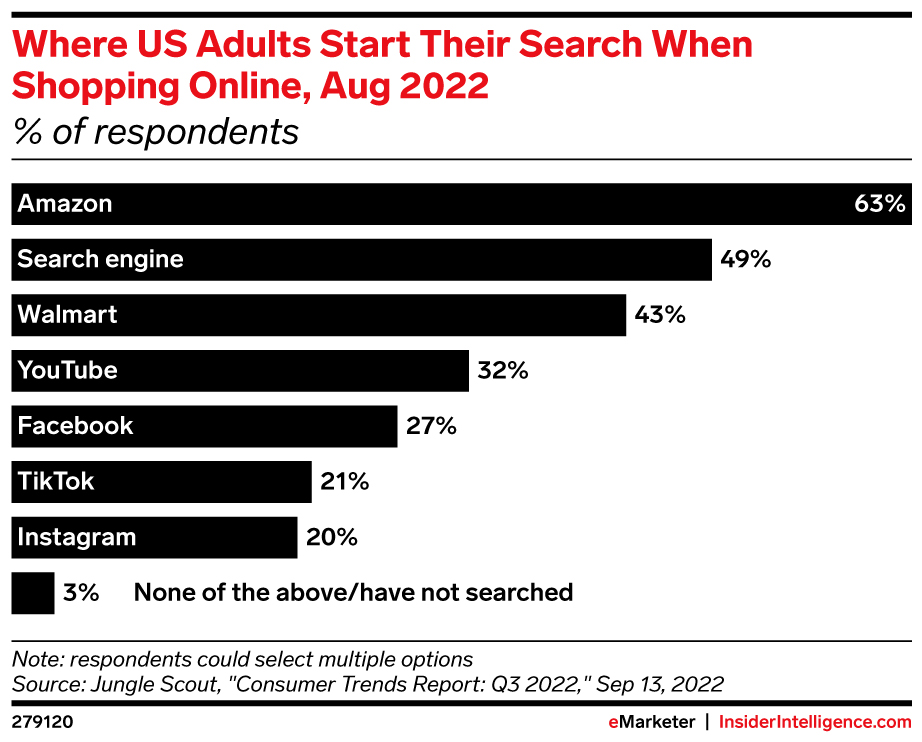
With more than 60% of surveyed US shoppers saying they begin their search on Amazon, the advantages of selling there are more than clear. However, there is still a sizable number of consumers who kick off their shopping journey on another avenue, with search engines taking a secure second place.
By utilizing channels outside of Amazon to drive traffic to your Amazon product listings, you are expanding your pool of potential customers to include nearly every shopper.
By driving external traffic to Amazon, you gain an advantage over competitors. Rather than competing for attention with other products on the Amazon SERP, you send traffic straight to your listing or Store.
Currently available to US Seller Brand Owners, Amazon offers a unique Brand Referral Bonus (BRB) program that rewards advertisers for conversions that were driven through Amazon Attribution.
By driving off-platform traffic to their Amazon listings, Brand Registered advertisers enrolled in the BRB program can earn a credit averaging 10% of the qualifying sales measured with Amazon Attribution. This bonus/incentive is awarded as a credit toward platform referral fees for that sale, thus reducing the overall cost to sell on Amazon.
Many sellers also believe that Amazon rewards sellers for driving external traffic to Amazon.com by sending sellers even more traffic. While it hasn’t been proven, it does make sense. When sellers direct outside traffic to Amazon, they are effectively advertising for themselves and Amazon. This helps Amazon gain more customers and make more money, which can potentially lead to better organic positioning for the brand / product.
Ready to start driving traffic to your Amazon listings? Here are a few best practices to get you started on the right foot:
Pro-tip: Sellers can only track a max of 1000 products per order, so if your catalog is larger, use the ‘total’ purchase metrics, which encompass the entire catalog. Or, just use this metric to start with since it doesn’t require you to stay on top of products being added or subtracted.
Attribution tags are parameterized tracking URLs that serve a similar purpose as tracking pixels. These tags are carried throughout the full shopping journey, capturing every subsequent action once a searcher clicks on your external ad. Attribution tags help you better understand not only where traffic to your Amazon products is originating, but which of those avenues most frequently leads to conversions.
To create attribution tags for your listings:
Amazon Attribution can measure traffic from nearly any source, including impressions for rich media and Paid Social channels such as Facebook and Instagram. Through creation of orders and line items, brands can create unique tracking templates, and performance can be measured to any desired level of granularity.
Beyond traffic insights, marketers can gain insight into conversion metrics including:
Note: Amazon Attribution is a 14-day last touch model (inclusive of impressions).
By integrating Amazon Attribution with Amazon’s Advertising API, brands can seamlessly access measurement capabilities within their tool provider’s familiar interface. This improves the experience for our advertisers by providing:
According to Josh Brisco, GVP, Acquisition Media at Tinuiti, the API capability eases the manner in which Amazon Attribution is set up as well as reported on by allowing users to execute Amazon Attribution tasks within the tool provider or self-built interfaces.
“This is another great update to the Amazon Attribution toolkit, and what is most exciting to me is that through API integrations, it is possible for advertisers to view data and make optimizations based on that data in one central location, vs having to create combined or custom reporting.”

— Josh Brisco, GVP, Acquisition Media at Tinuiti
Below we take a closer look at the impact Amazon Attribution had on performance for two Tinuiti clients—Verilux and MidWest Homes for Pets.

Verilux—creator of popular HappyLight light therapy products—wanted to expand their targeting to include non-branded traffic with an aim of profitably increasing brand awareness and sales volume. Historically, Verilux’s non-branded traffic to their own ecommerce website did not prove to profitably convert. The goal was to use a limited budget to test whether driving that traffic to Verilux’s Amazon listings instead would lead to more sales.
As a result of launching Amazon Attribution with Tinuiti, Verilux added incremental revenue to their overall business in Q4 2018, helping them realize the following benefits:
Learn more in Verilux’s Amazon Attribution case study.

MidWest Homes for Pets offers high-quality pet products including dog crates and carriers, exercise pens, dog and cat beds, and more.
Tinuiti’s team of Amazon experts had been working with MidWest Homes for Pets for several years before Amazon Attribution was launched. Stores Insights helped in understanding how external marketing efforts were impacting Amazon performance, but didn’t tell the full story Amazon Attribution offers. Once the program came into beta, Tinuiti worked with MidWest Homes for Pets to get them registered.
After placing Amazon Attribution tags across MidWest Homes for Pets’ key marketing channels, Tinuiti had clear insights into which external strategies were driving the highest shopper actions across Amazon. The available metrics within the console paired with MidWest Homes for Pets’ non-Amazon metrics made building a unified performance view possible.
Tinuiti’s team tagged all ad groups within publisher campaigns to gather category-level insights, with the single view helping measure cost efficiency across non-Amazon marketing initiatives. Tinuiti teams optimized publisher strategies accordingly, resulting in improved ROAS.
“Partnering with Tinuiti’s team of Amazon experts gave us the peace of mind that one of our key sales channels was in good hands. By recommending that we register for the Amazon Attribution beta, the Tinuiti team helped us access a more holistic measurement solution that ultimately has enabled us to accelerate our sales growth on Amazon.”
— Neil Smith, Director, e-Commerce at MidWest Homes for Pets
Learn more in MidWest Homes for Pets Amazon Attribution success story.
We often get questions from our clients about how Amazon Attribution works and why brands should be using it to evaluate their marketing strategy. Here are answers to a few of the most common questions from Tinuiti’s team of leading Amazon advertising experts.
Q: If I’m running paid ads to my ecomm site, why would I want to send to Amazon also, where I do not get customer data and/or the chance to re-engage?
A: While there are certainly advantages to focusing primarily on a brand’s D2C presence to own first-party customer data and increase brand LTV, there are certainly ways sending traffic to Amazon first—or in tandem with a D2C—has strategic upside.
Common reasons for buying traffic to Amazon are to:
Q: If Amazon is already bidding on ad placements to drive traffic for our clients, isn’t that essentially free traffic? Why would we want to compete with those placements? Wouldn’t we be replacing these ad spots with our own?
A: It comes down to customer experience, and mitigating demand loss to competitors’ ads. By bypassing the Amazon SERP—which is where Amazon’s own ads land—we can limit exposure to your competitors’ products and ads.
A typical Amazon text ad will land users on a results page where a competitor could own any number of ad placements, and inevitably other similar products will be shown in organic listings. In these cases, we are possibly losing out on conversions from people looking for our product that get swayed by the ads.
Purchasing this traffic is also a good way to drive traffic for non-brand terms that do not have a strong organic ranking on Amazon. Lastly, the Amazon Brand Referral program incentivizes investing in traffic from outside of Amazon, which can help drive down overall TACoS on Amazon itself.
Amazon Attribution is a crucial tool in understanding how your external advertising efforts are impacting your Amazon sales and overall performance. The holistic insights that Amazon Attribution helps in making possible are essential in crafting informed, strategic campaigns on and off the Amazon platform. To learn more, visit our Amazon Services page.
Editor’s Note: This post was originally published by Tara Johnson in September 2020 and has been updated for freshness, accuracy, and comprehensiveness.