Digital Ads Benchmark Report Q1 2023
Quarterly Trends Across Google, Meta, Amazon, and More
Quarterly Trends Across Google, Meta, Amazon, and More
The Tinuiti Digital Ads Benchmark Report is based on anonymized performance data from advertising programs under Tinuiti management, with annual digital ad spend under management totaling over $3 billion. Samples are restricted to those programs that have remained active and maintained a consistent strategy over the time periods studied. Unless otherwise noted, all figures are based on same-client growth. The trends and figures included are not meant to represent the official performance of any advertising platform or the experiences of every advertiser.
Note: The data below is from 2023. Head here to see our most recent report.
Tinuiti is the largest independent performance marketing firm across Streaming TV and the Triopoly of Google, Facebook, and Amazon, with $3 billion in digital media under management and over 1,000 employees.
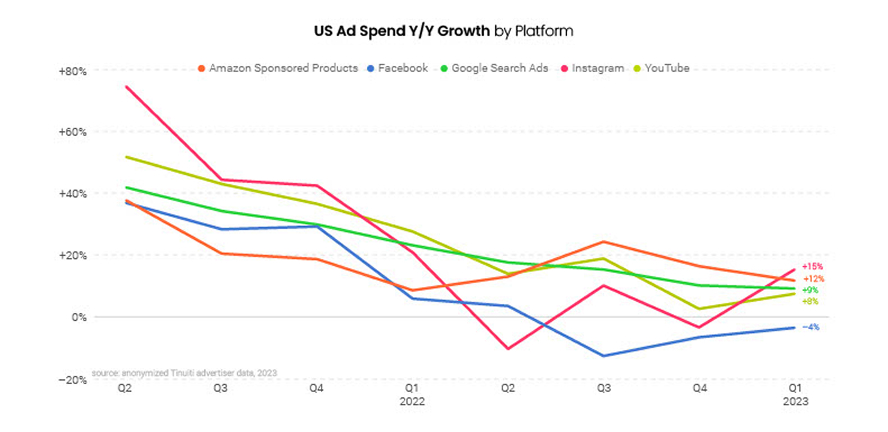
Digital ad spending rebounded across Meta platforms and YouTube in the first quarter of 2023. Amazon Sponsored Products and Google paid search slowed from the quarter prior, but continued to grow faster than YouTube or Meta platforms overall.
With economic uncertainty spurred on by questions surrounding how consumers and businesses would hold up given high interest rates and price inflation, ad investment slowed in the back half of 2022 even as year-ago comparisons got weaker. At the time, advertisers focused ad spend on those channels and formats known for bolstering bottom-of-funnel demand capture, such as Google paid search and Amazon Sponsored Products, a trend that has continued to play out in 2023 so far.
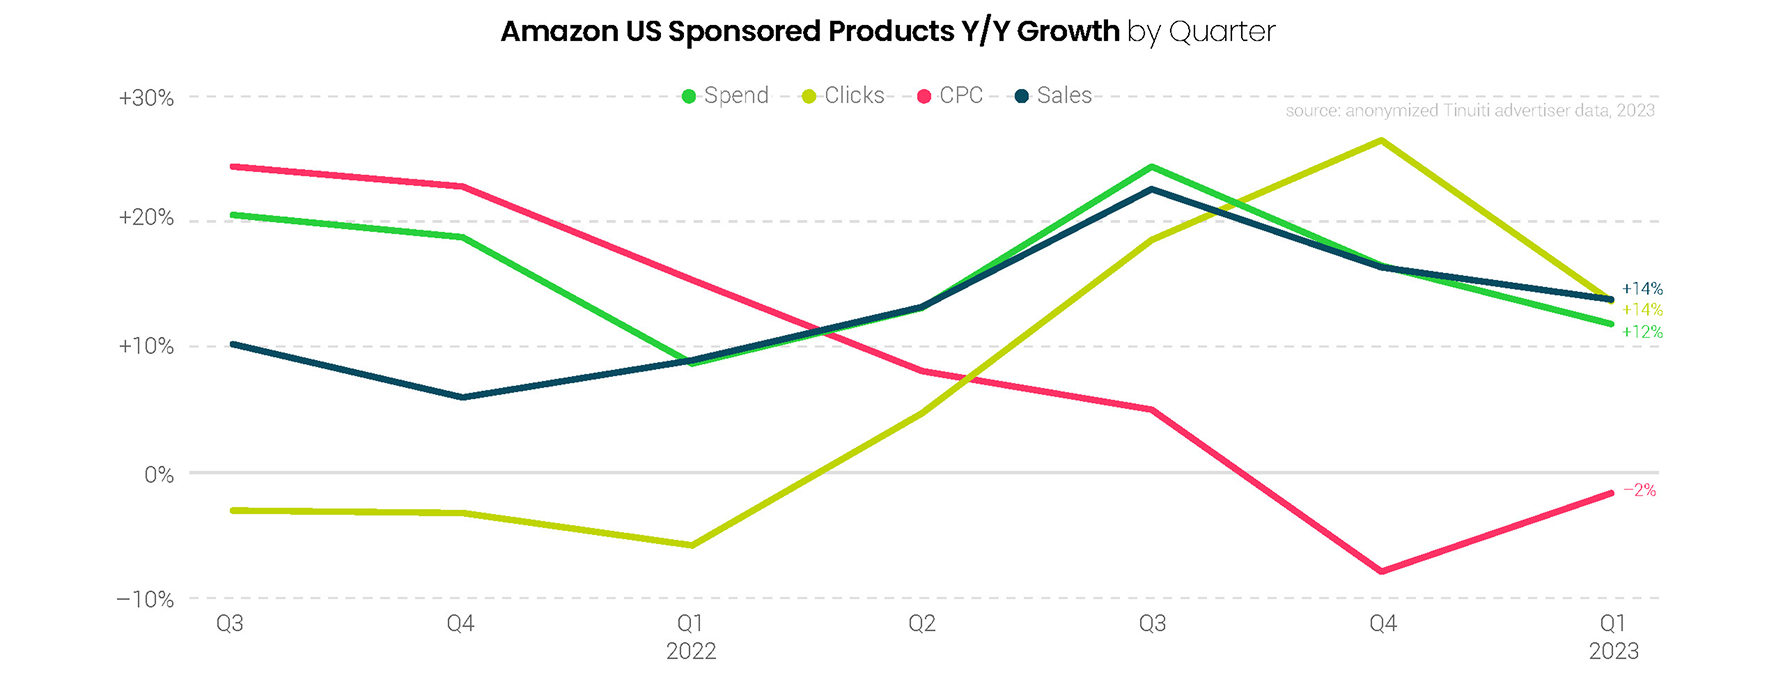
Amazon Sponsored Products growth slowed from 17% in Q4 to 12% in the first quarter. Q1 was the first quarter since Q2 2022 that Amazon did not run a major Prime member event, as it rolled out the Prime Early Access Sale in mid-October of last year to jumpstart the holiday shopping season. Assuming Amazon once again runs Prime Day in July as it did last year, Q2 will be the second straight quarter in which results aren’t bolstered by a major Prime member event.
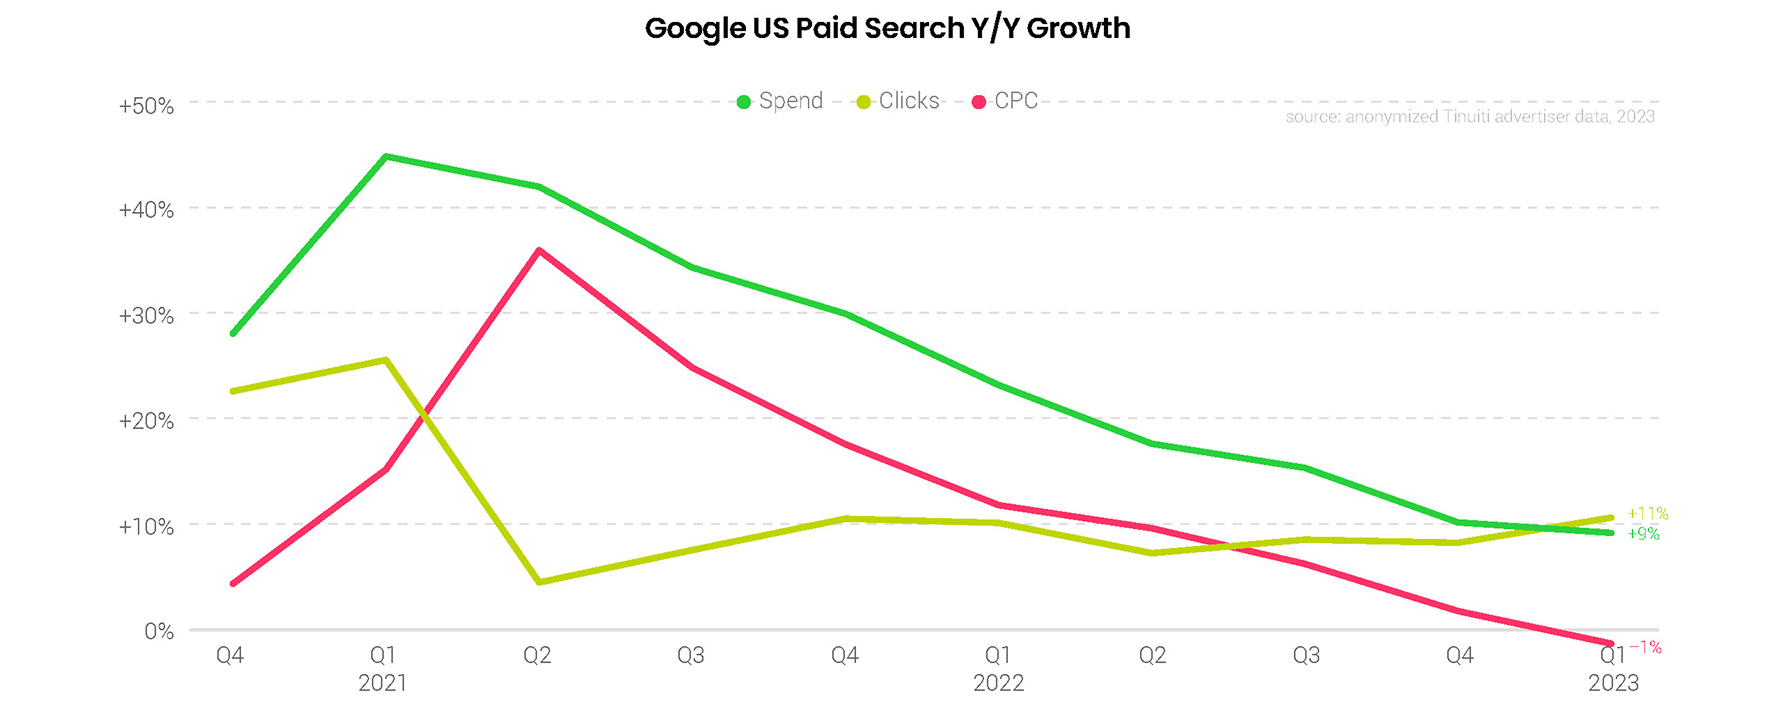
While ChatGPT has supposedly caused a “code red” at Google, it is still too early to say whether its integration with Microsoft’s Bing will cause a material shift in the search business or play out more like the hype surrounding Amazon’s Alexa and voice search. In Q1 2023, Google paid search continued to fair relatively well, but spending growth decelerated a point to 9% Y/Y. Google click growth did improve to 11%, but pricing remained weak, with CPC down 1% Y/Y.
In the third quarter since Google began its transition from Smart Shopping to Performance Max campaigns, the newer AIdriven model delivered strong results for advertisers. Average sales per click and cost per click for PMax campaigns were comparable to standard Shopping campaigns in Q1 and over 80% of Shopping advertisers employed PMax campaigns during the quarter.
Meta ad spend rebounded from three straight quarters of decline to flat year-over-year growth in Q1. Instagram in particular saw a strong 15% increase in spend for the first quarter, up from a 3% decline in Q4, as impression growth tripled over the same time frame. The Reels ad placement continues to rapidly grow, and accounted for 10.8% of all Instagram impression in Q1 2023, up from 2.5% in Q1 2022.
Also aiding the Meta rebound has been the adoption of Advantage+ shopping campaigns, which are producing strong return on ad spend for advertisers. These automated campaigns use machine learning to optimize ads across formats and audiences, and have been a boon to performance since being more broadly rolled out to advertisers in the back half of 2022.
YouTube advertisers that were active in both Q1 2022 and Q1 2023 increased their investment in the platform by 8%, up from 3% growth a quarter earlier. While YouTube pricing growth remained weak, advertisers saw impression growth improve to 42% Y/Y. Outside of YouTube, streaming video ad spending rose 12% Y/Y in Q1, and while it is still early days for Netflix ads, the streaming giant commanded strong CPMs in Q1, about 3.4 times those of other traditional streaming platforms.
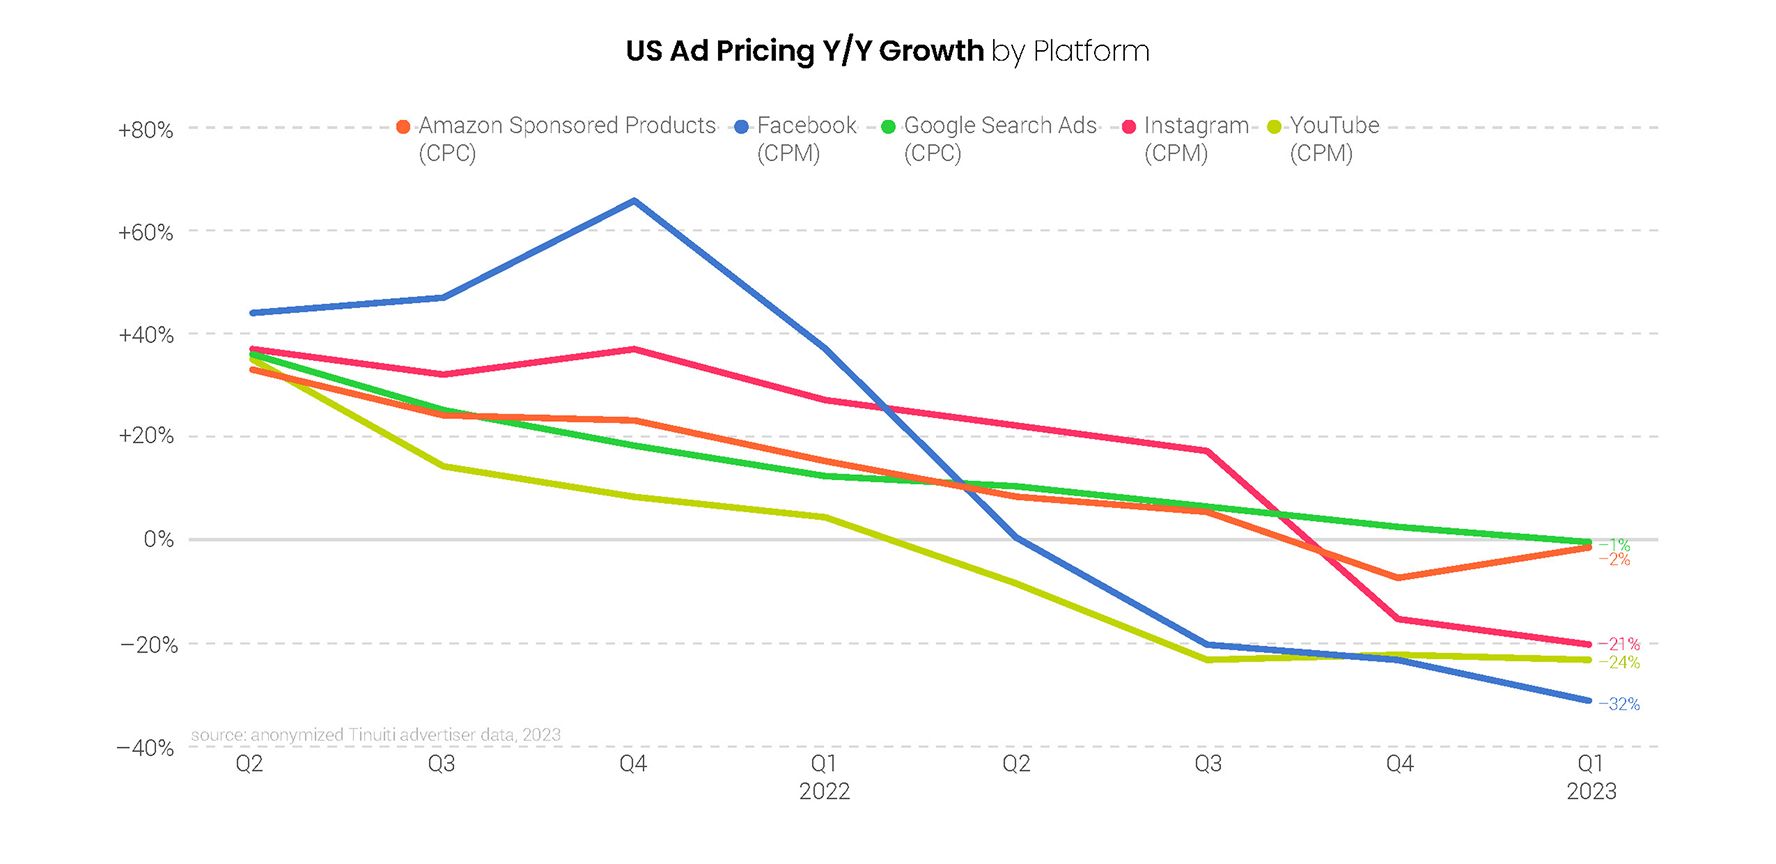
Ad pricing continued to decelerate quarter-over-quarter for many platforms, including YouTube, Instagram, Facebook and Google paid search. Amazon Sponsored Products bucked this trend, but CPC for the format still fell 2% year over year in Q1, a slightly steeper drop than that of Google paid search, and Sponsored Products CPC declined by 4% in the f inal month of the quarter.
On Instagram, CPM fell by more than 20% compared to Q1 2022, the steepest year-over-year decline ever observed for Tinuiti advertisers. Instagram CPM is now below where it was two years ago, in part due to the growth of Reels impression share since the newer format carries a much lower CPM than more established placements like Feed.
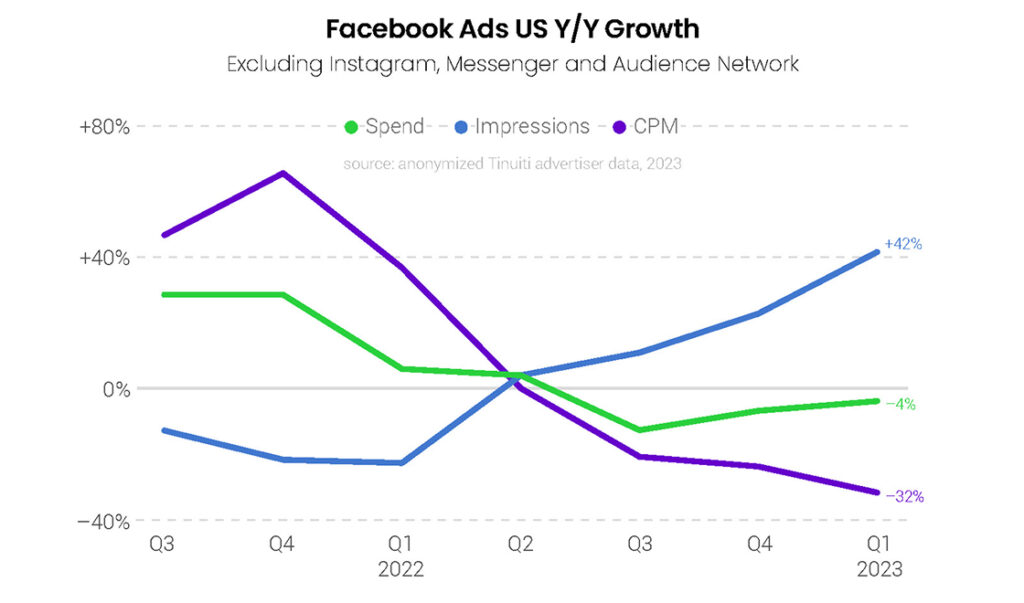
Advertisers decreased investment in Meta properties year over year for each of the last three quarters of 2022, but spend growth rebounded to hold steady year over year in the first quarter of 2023. Impressions soared 42% year over year for the quarter, as newer inventory sources like Reels are helping to drive up available ad inventory on both Instagram and Facebook. CPM fell 30% compared to Q1 2022, a deceleration from the 22% drop observed in Q4.
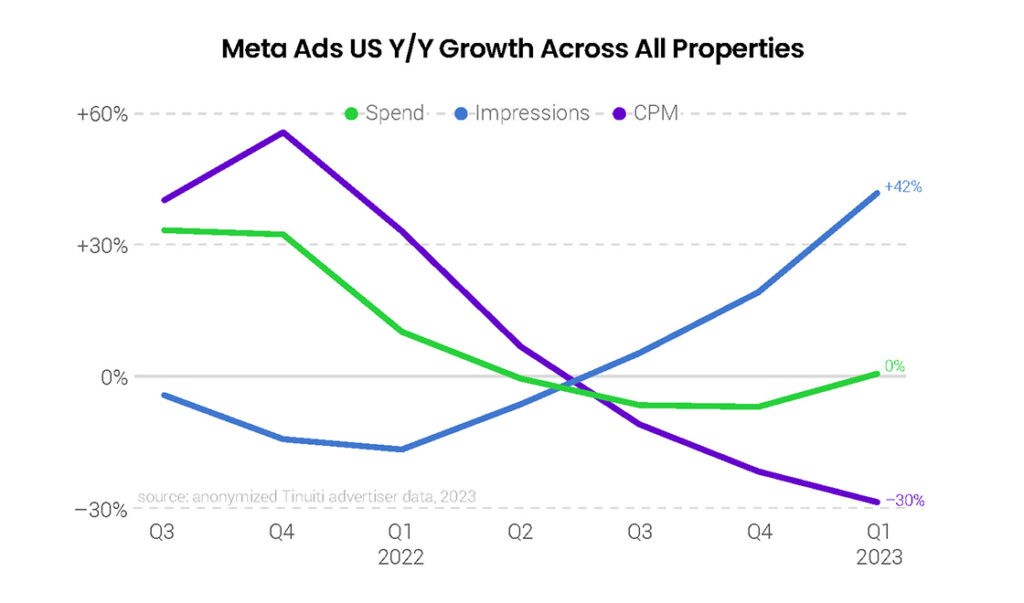
Facebook ad impression growth nearly doubled once again, rising from 23% in Q4 2022 to 42% in Q1 2023, as impression volume metrics continue to recover after large declines in Q4 2021 and Q1 2022. Spend declined 4% year over year, an improvement from the 7% decline observed in Q4, while CPM fell 32% in the first quarter of the year, the biggest decline observed in the last four years for Tinuiti advertisers.
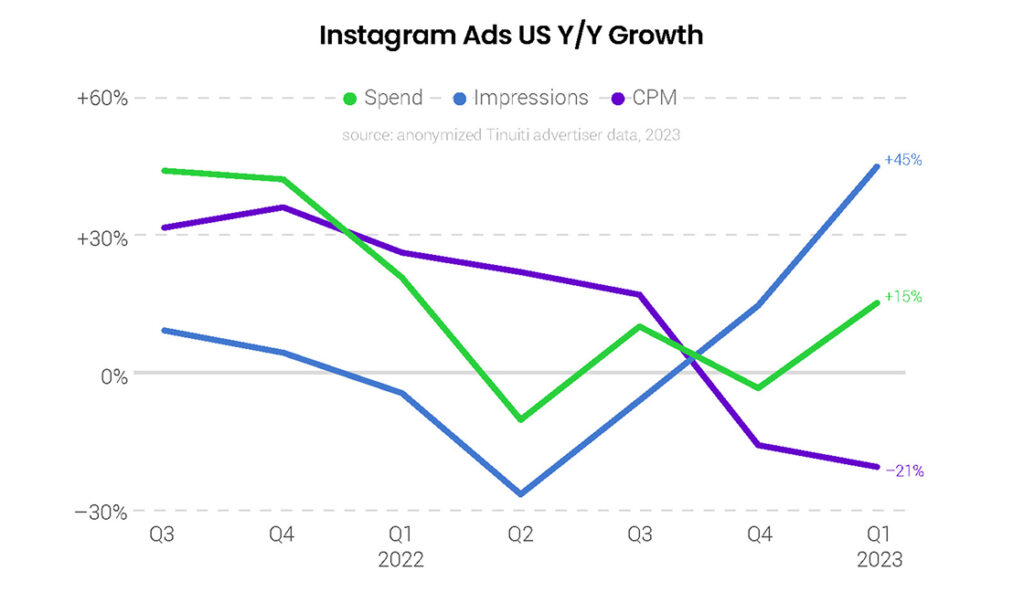
Advertisers decreased spend on Instagram 3% year over year in Q4, but growth rebounded to a 15% increase in Q1 on the strongest impression growth observed since Q2 2020. Instagram CPM declined for the second straight quarter, falling 21% year over year after a 16% decline in Q4. Recent CPM declines are at least partly the result of growth in the share of impressions coming from newer inventory sources like Instagram Reels.
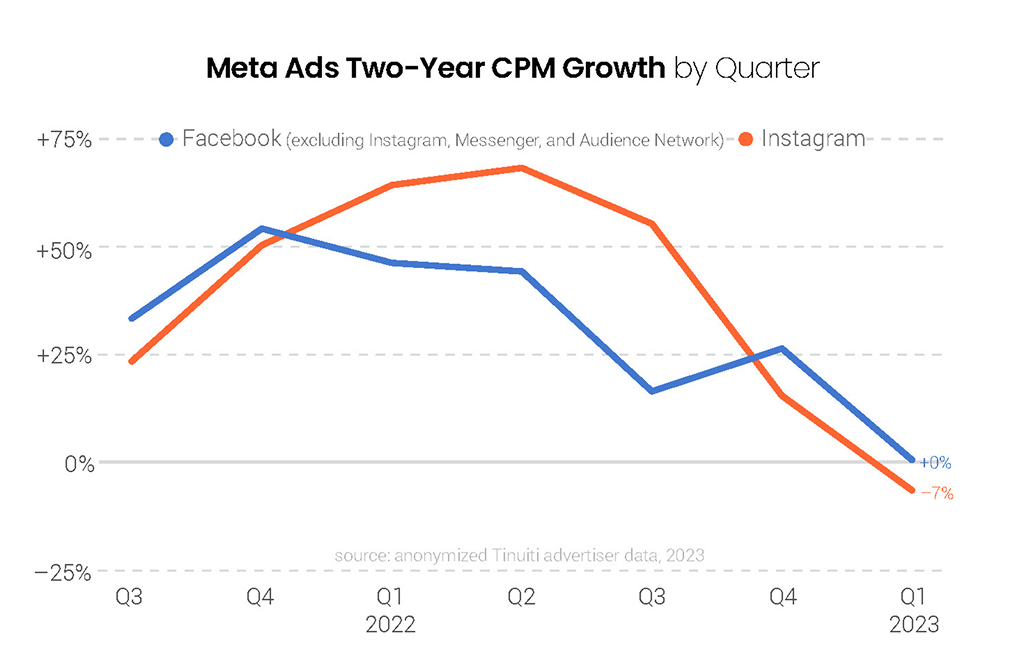
While CPMs on both Facebook and Instagram declined meaningfully in Q4 2022, ad pricing was still significantly above where it was two years prior. However, Facebook CPM in Q1 2023 was identical to what was observed back in Q1 2021, and Instagram CPM was 7% lower than the same quarter two years ago. Newer inventory sources like Reels, which carry a lower CPM than more established placements like Feed, are part of the reason that CPM is now lower on Instagram than in years past.
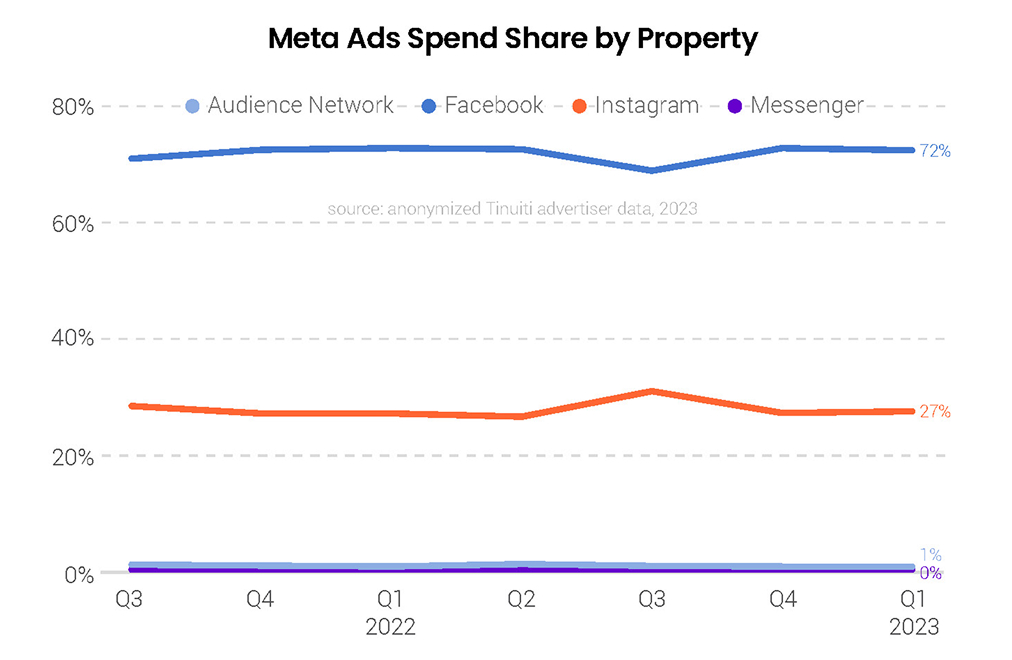
Facebook accounted for 72% of total Meta ad investment in Q1 2023, nearly identical to the share it accounted for in Q4 2022. Instagram spend share was also roughly the same in Q1 2023 as last Q4, and the Audience Network, which was most impacted by Apple’s App Tracking Transparency (ATT) update, continues to account for just 1% of total Meta investment. Messenger has yet to break past a small fraction of a percentage of spend attributed to Meta ad properties.
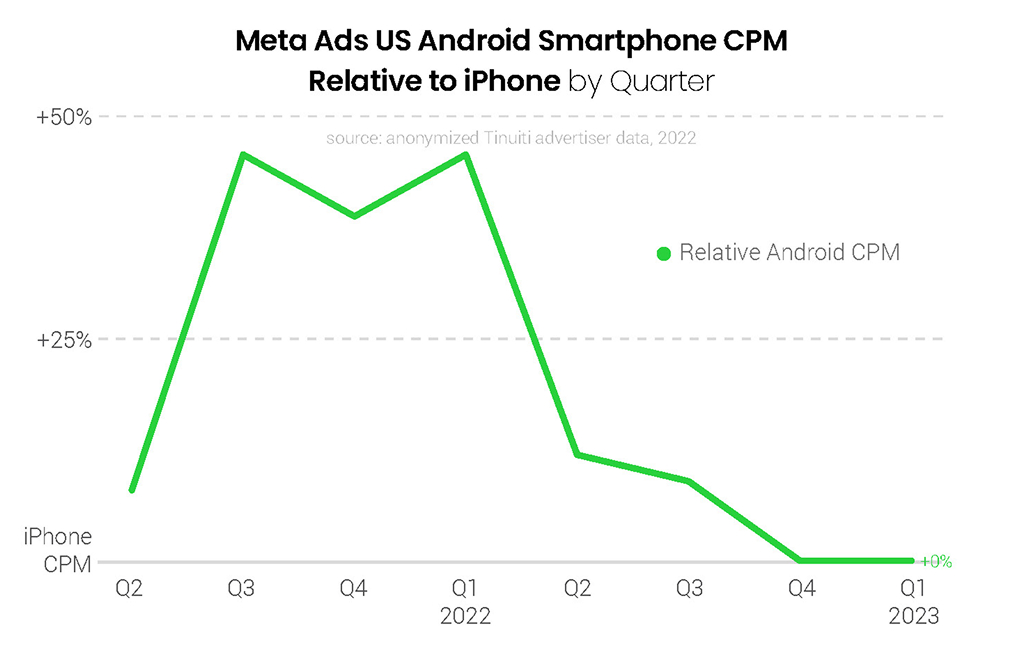
For the second straight quarter, Android smartphone and iPhone CPMs were identical across Meta ads in Q1 2023. Android smartphone CPM soared relative to iPhone CPM in the quarter immediately following the release of the Apple App Tracking Transparency (ATT) prompt, as there appeared to be relatively more demand for those users who could still be targeted and tracked using mobile IDs. Android CPM was still 46% higher in Q1 2022, but the difference steadily evaporated from there.
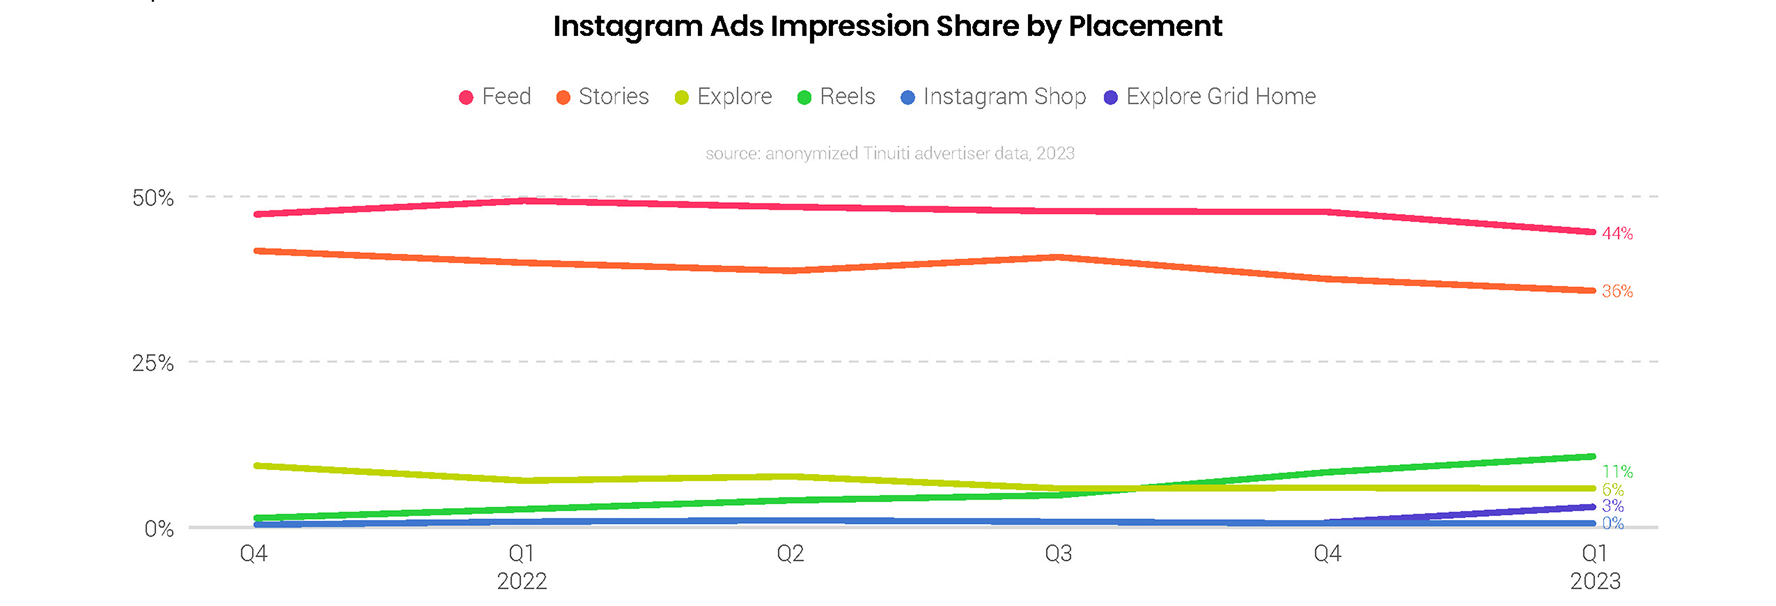
Reels ads accounted for 10.8% of all Instagram ad impressions in Q1 2023, more than four times the 2.5% impression share observed back in Q1 2022 and up from 8.3% in Q4 2022. Given that Meta has touted in the past that Reels accounts for more than 20% of all user time spent on the platform, there is likely still significant runway for Reels to account for an even greater share of ad impressions in the future. The recently introduced Explore Grid Home placement accounted for 3% of impressions in Q1.
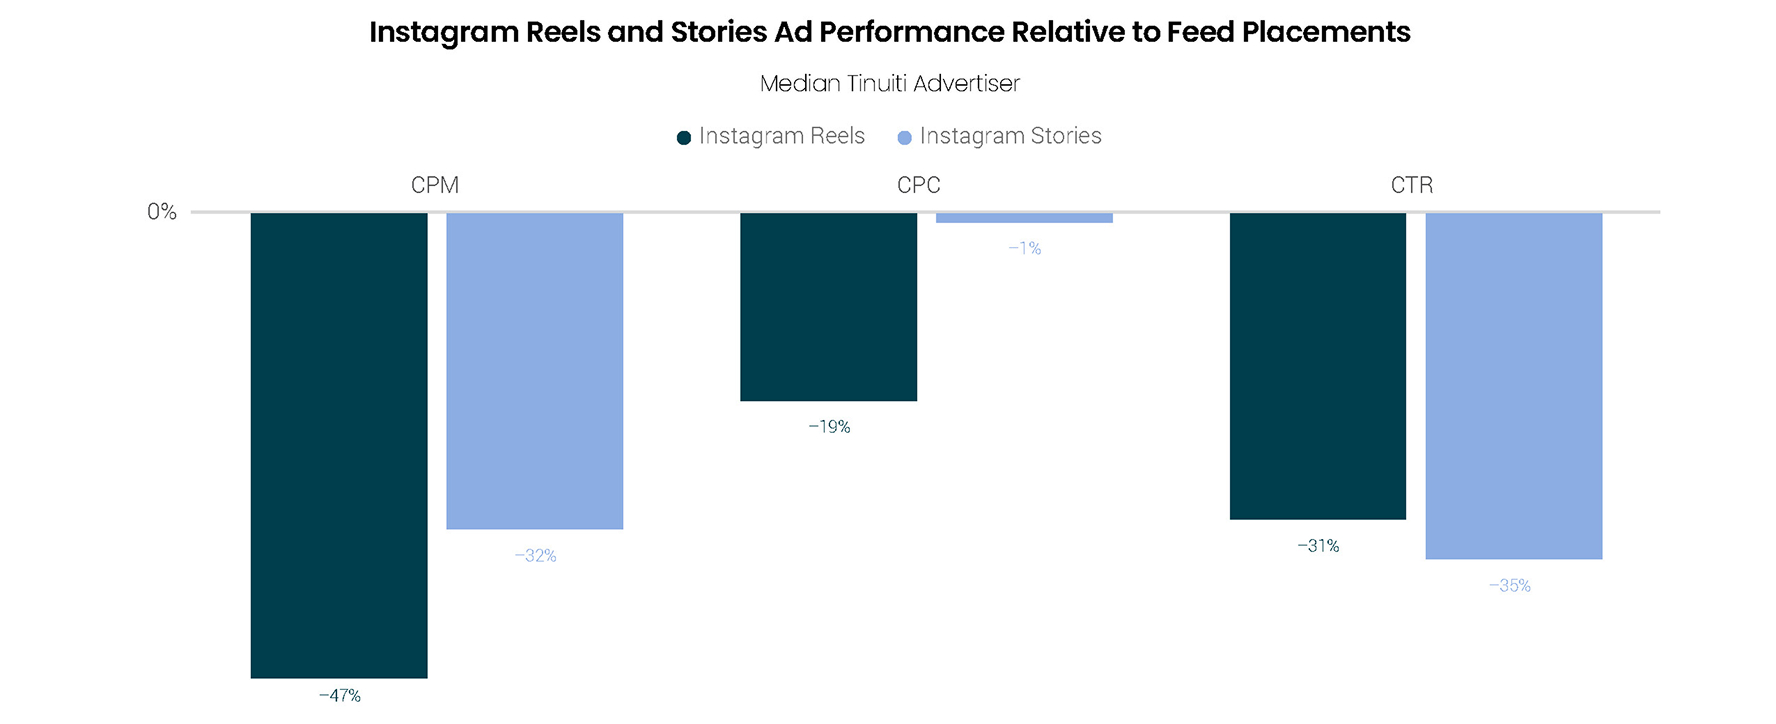
The CPM of Instagram Reels ad impressions was 47% lower than that of Instagram Feed placements for the median Q1 2023 advertiser in the first quarter, while CPC was 19% lower. Stories CPM was 32% lower than feed, but CPC was nearly identical, as the difference in CPM between Feed and Stories is roughly the same as the difference in CTR between these two placements for most advertisers. The CPC of Instagram Reels should come more in line with that of Feed placements over time as more advertisers enter Reels auctions and competition grows.
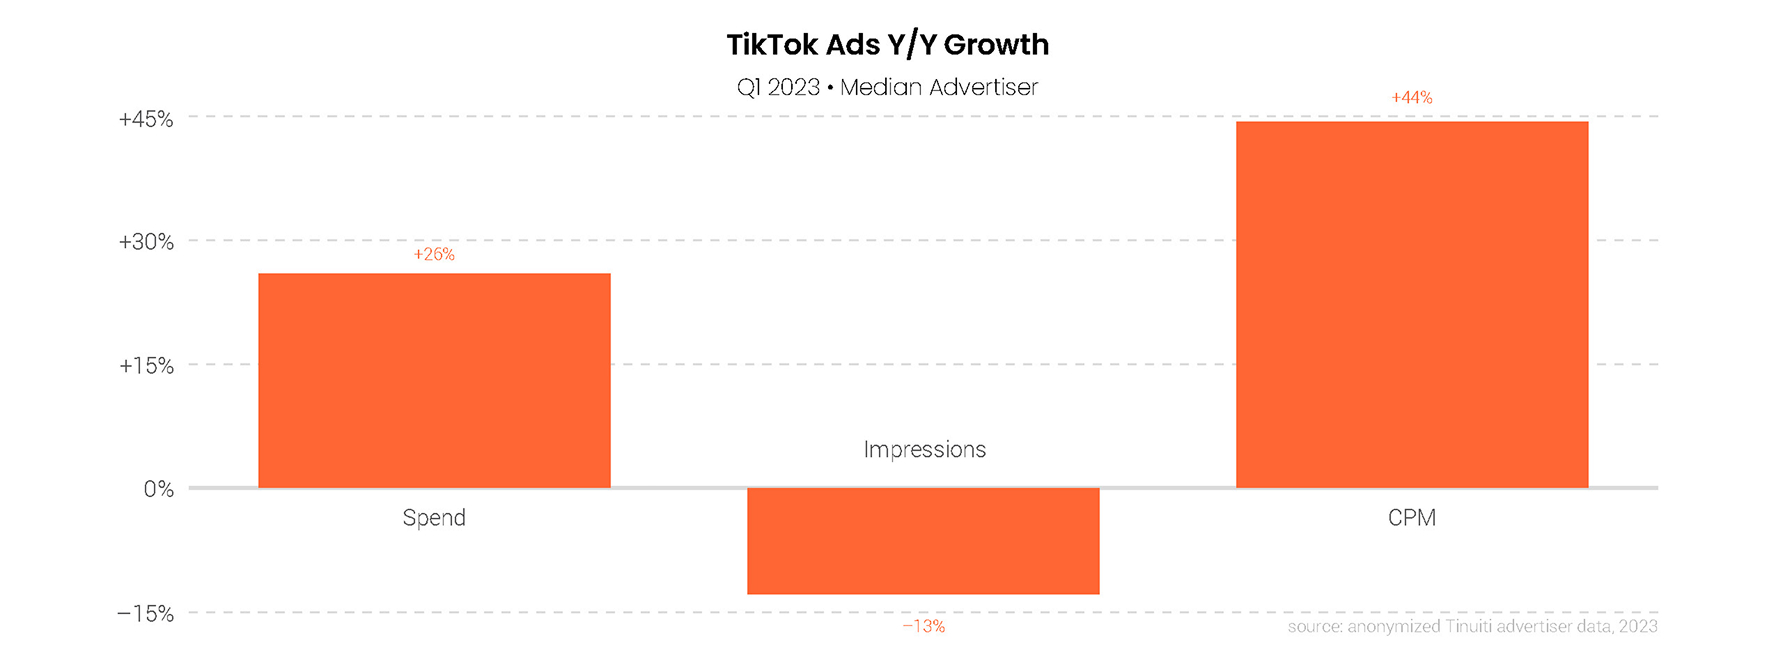
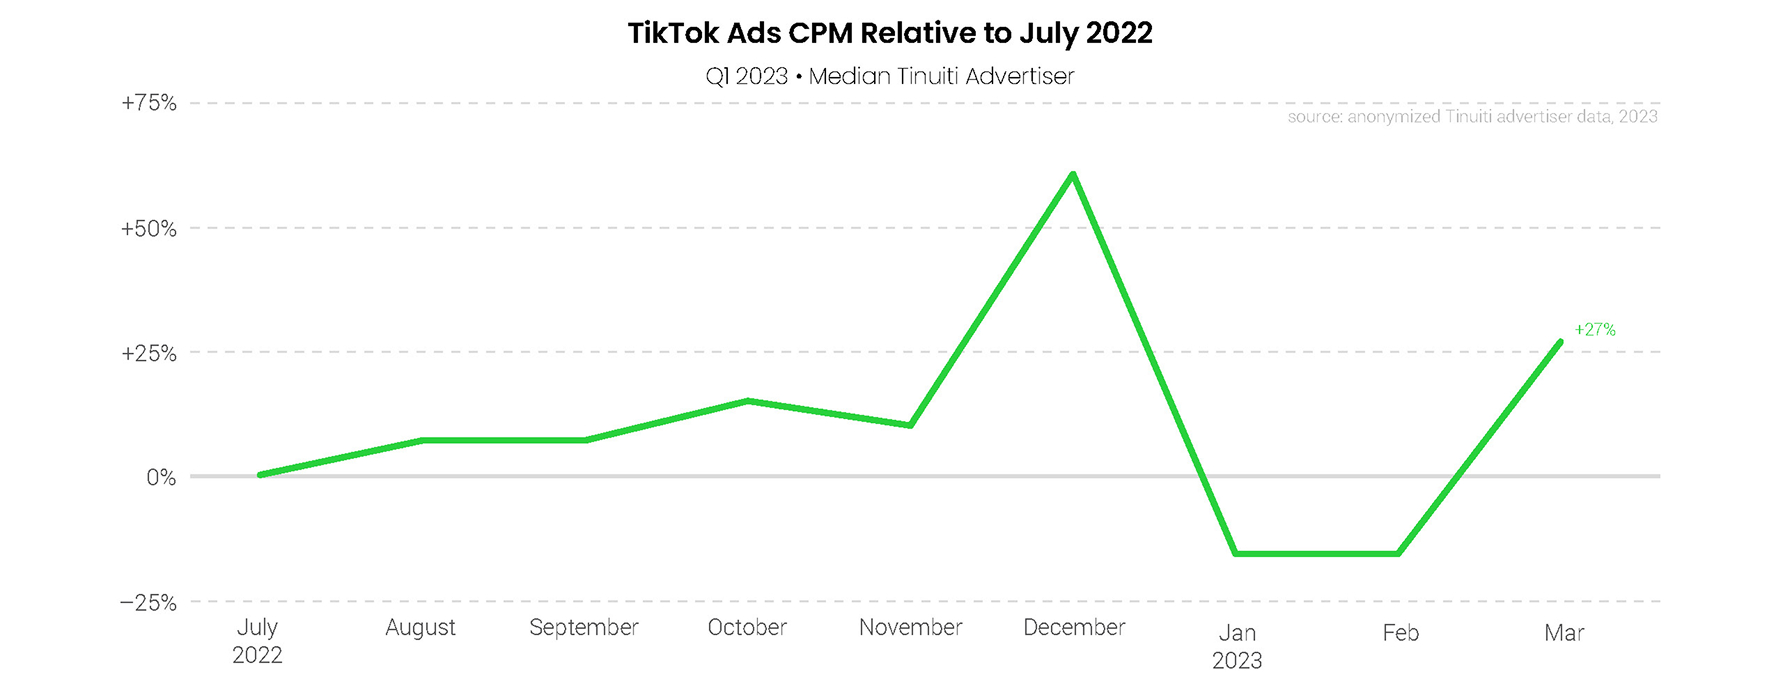
The median Tinuiti advertiser active on TikTok since at least Q4 2021 ramped up TikTok ad spend by 81% year over year in Q4 2022, with CPM on the platform up 12%. More advertisers continue to join these auctions over time in order to get in front of audiences that may not be active on other social platforms. TikTok continues to build out its ad products, launching solutions like Shopping Ads to help facilitate the discovery and purchase of products through its platform.
CPM for TikTok Ads was 61% higher in December than in July 2022 for the median Tinuiti advertiser, as compeitition ramped up for the Q4 holiday shopping season. Ad pricing metrics are also impacted by updates to placements and campaign types, such that movement in CPM isn’t solely the result of more or less competition at any given time, and TikTok continues to roll out new formats as it courts advertising dollars.
Total US spending on Google paid search text and Shopping ads grew 9% Y/Y in Q1 2023, down from 10% growth a quarter earlier. Clicks grew 11% Y/Y in Q1, up three points from Q4 2022, but CPC growth decelerated for the seventh quarter in a row. Google search ad CPCs fell 1% Y/Y in Q1 2023, the first decline advertisers have seen since Q3 2020. Since that time, Google CPCs had grown by as much as 36% Y/Y in Q2 2021, as they rebounded from significant declines during the early months of the pandemic.
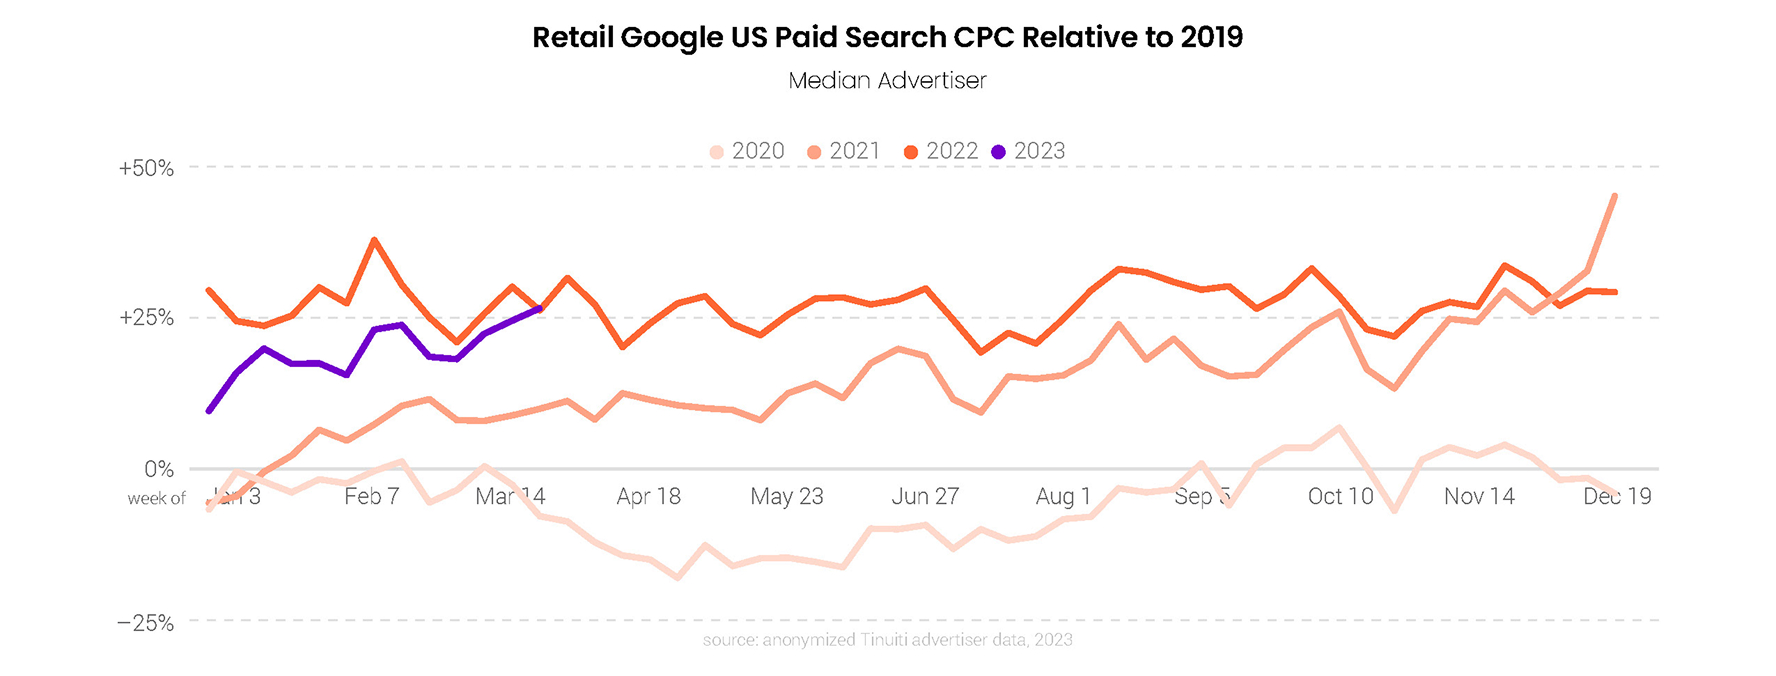
While Google search CPCs may have declined overall in Q1, they are still running considerably above prepandemic levels and retailers saw CPCs close the gap with 2022 levels by the end of the quarter. Weekly retail Google search CPCs were up by an average of 20% compared to 2019 levels in Q1 2023, down from 27% average growth a year earlier. After a weak start to the year, retail CPC growth picked up, with CPCs ultimately running higher than 2022 for the final full week of Q1.
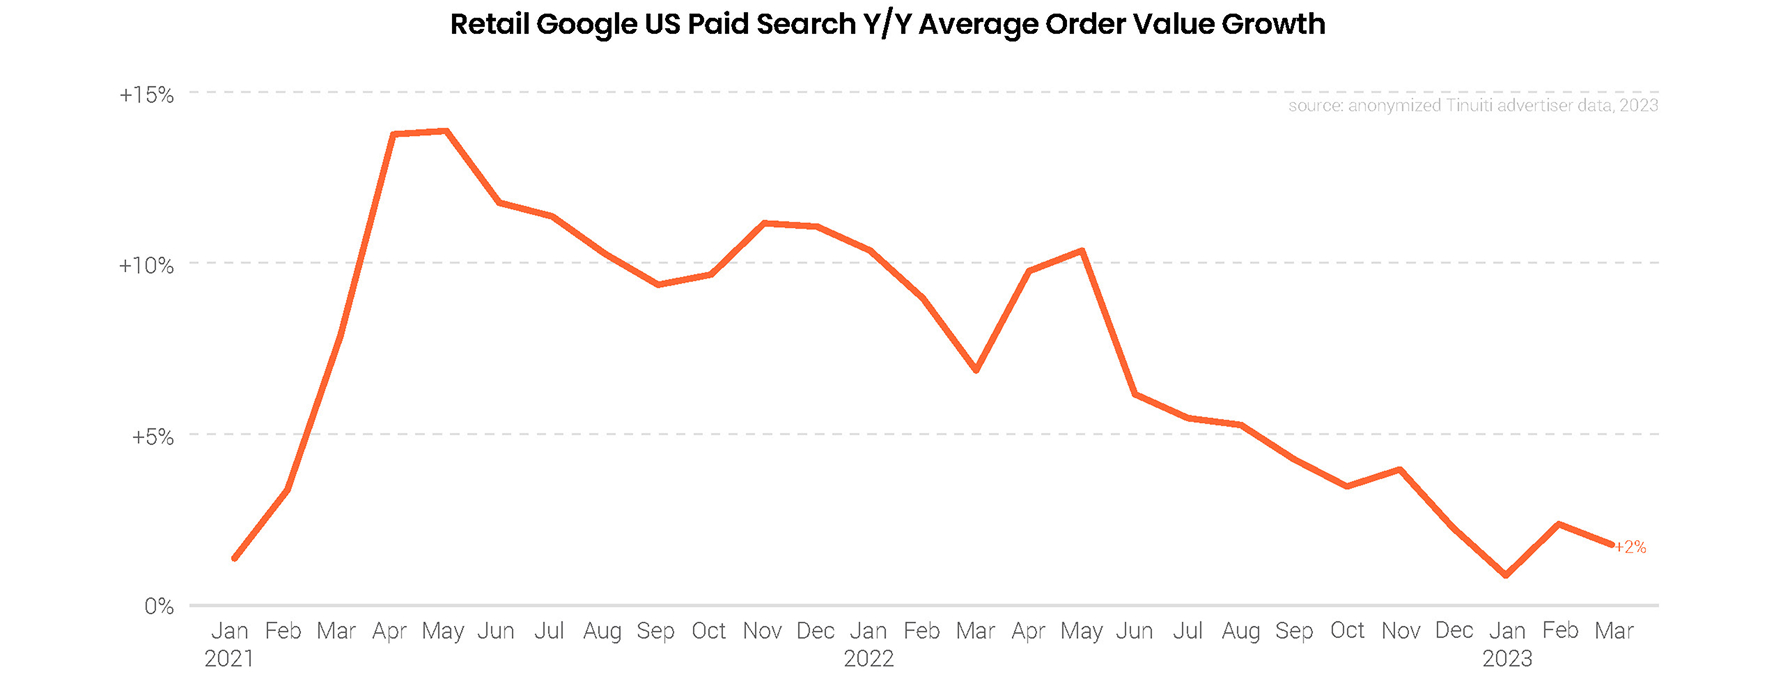
While official measures of inflation show that US consumer price growth has been decelerating since mid-2022, growth in the average order value generated by Google search ads has been slowing since about a year earlier. With comparisons against the early months of the pandemic, AOV growth spiked to 14% Y/Y in Q2 2021, but has trended lower since, which may help explain why Google search CPC growth has slowed over the same period. In Q1 2023, Google search ad AOV was up just 2% Y/Y.
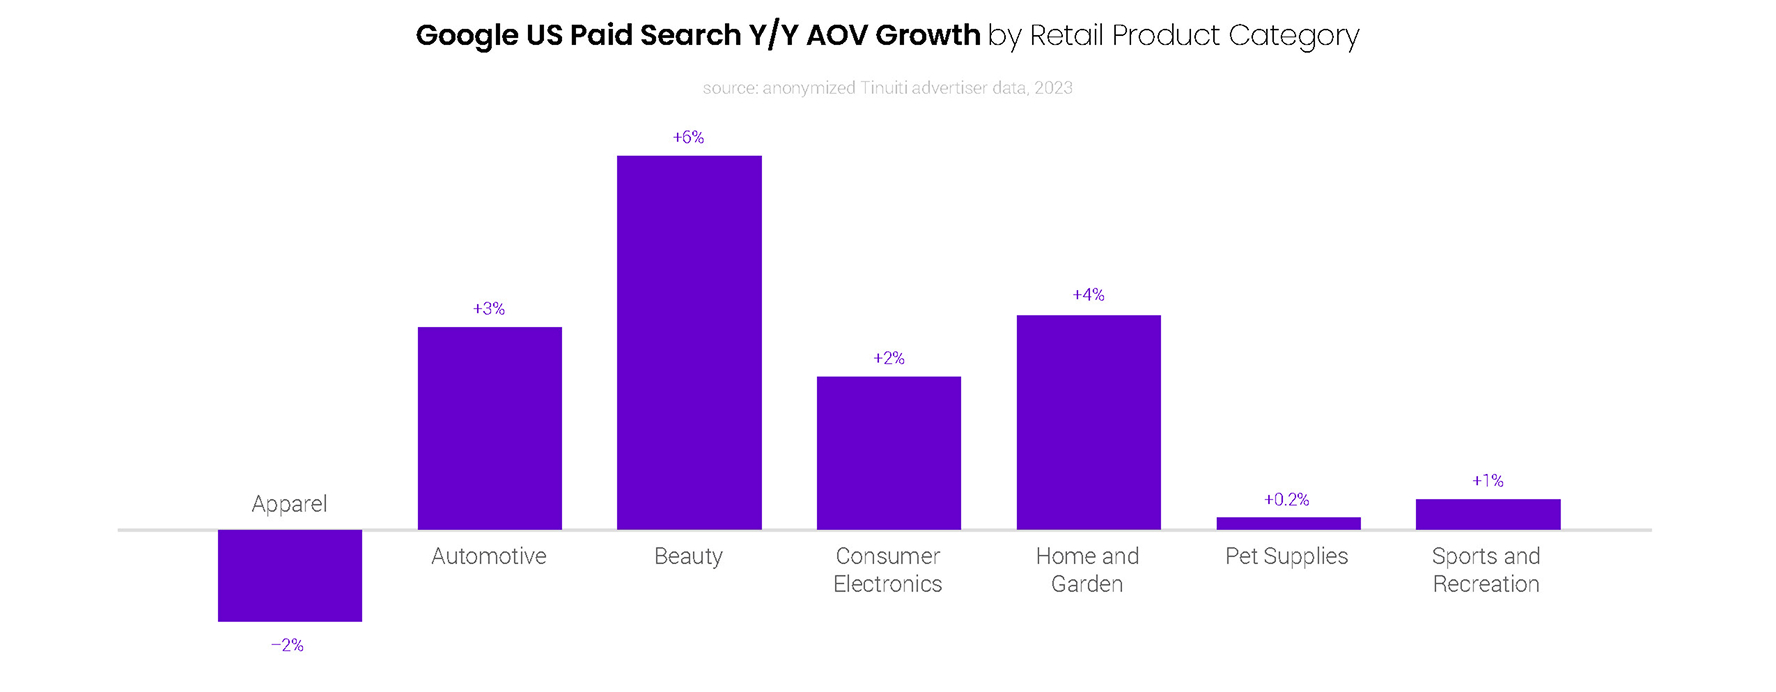
Across the seven product categories assessed for this report, only sports and recreation saw stronger Google search ad AOV growth in Q1 2023 than in Q4 2022. Sports and recreation AOV was up 1% Y/Y in Q1, compared to a 9% decline in Q4. Apparel was the only category to see a year-over-year decline in AOV in Q1, with AOV falling 2%. Automotive saw the biggest deceleration in AOV growth between Q4 and Q1, with AOV up just 3% Y/Y to start 2023, compared to 11% growth a quarter earlier.
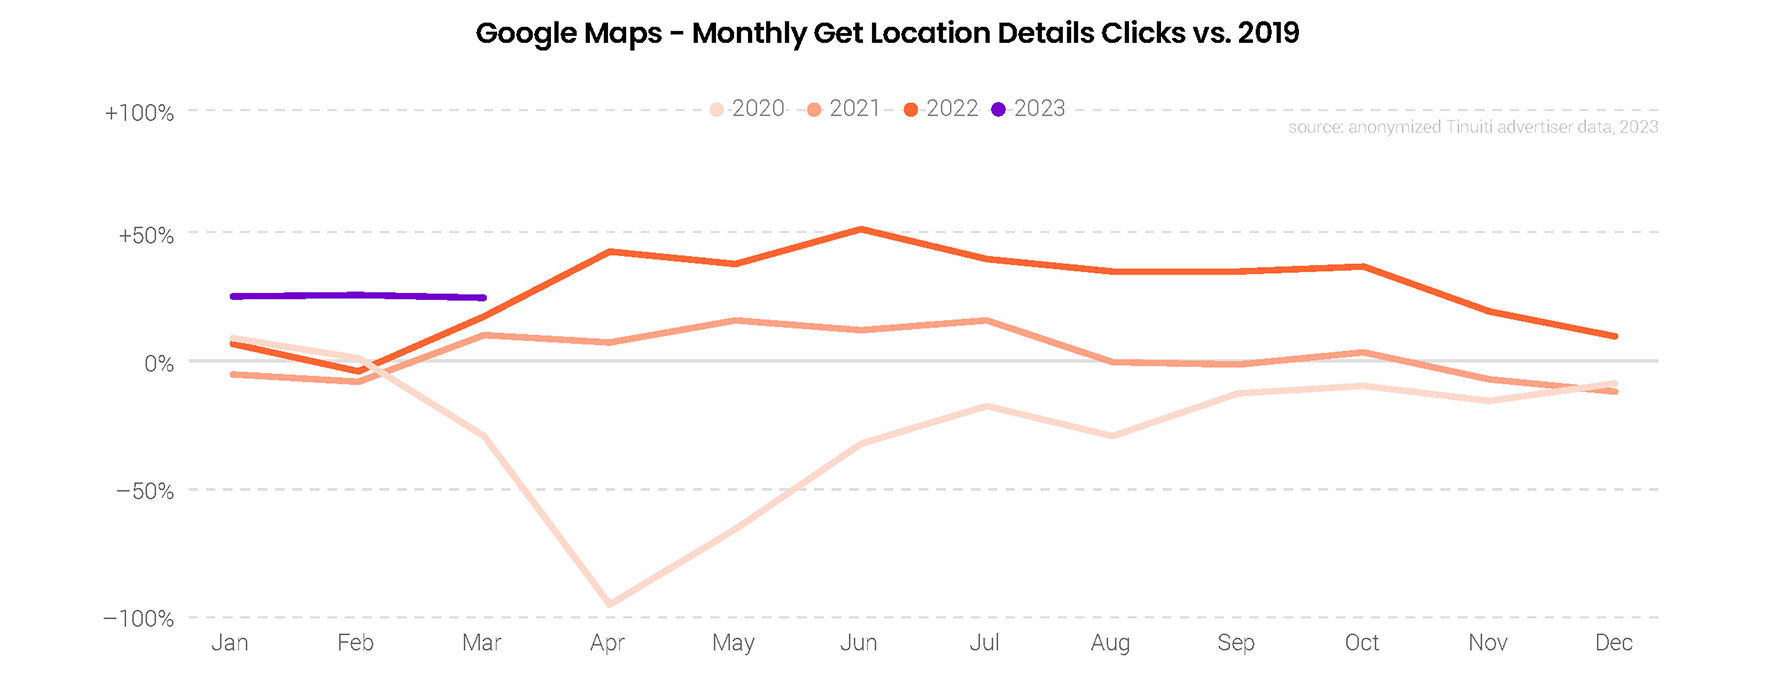
Compared to 2019, clicks from Google Maps on the location details of brick-and-mortar stores were up by 27% in Q1 2023. A year earlier, Get Location Details clicks were up by an average of just 8% in Q1 compared to 2019. Consumer interest in physical store locations strengthened in mid-2022, following a relatively weak start to the year which coincided with the strong Omicron wave of the pandemic.
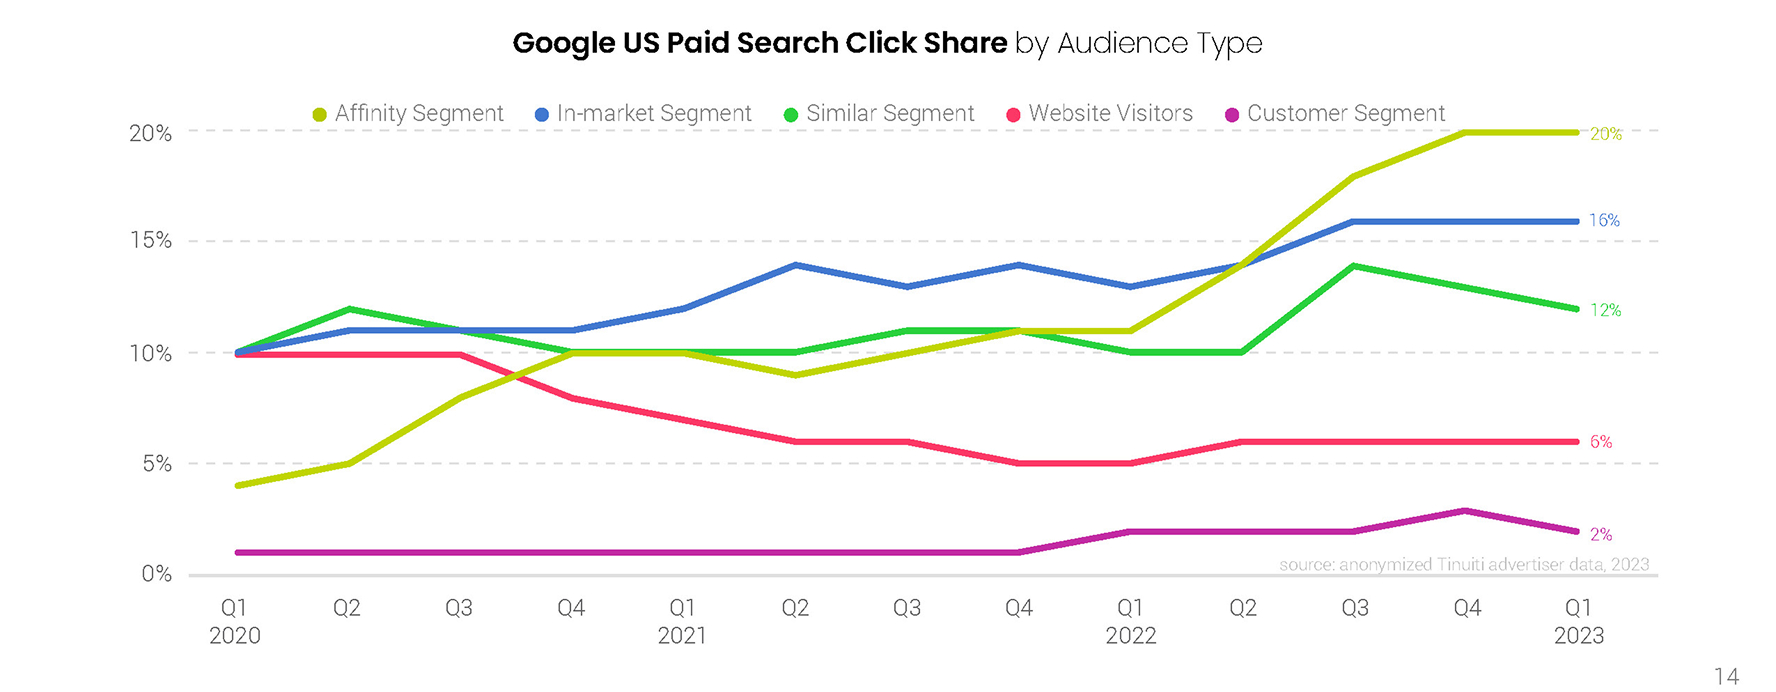
The share of Google search ad clicks produced by its most popular audience segments was largely unchanged in Q1 2023 compared to a quarter earlier, with Similar audiences as a notable exception. Similar audience share has fallen about two points since Google announced in November 2022 that it would sunset the segment beginning in May 2023. As Google works through this process, it is encouraging advertisers to adopt its more automated solutions of optimized targeting, audience expansion, and Smart Bidding.
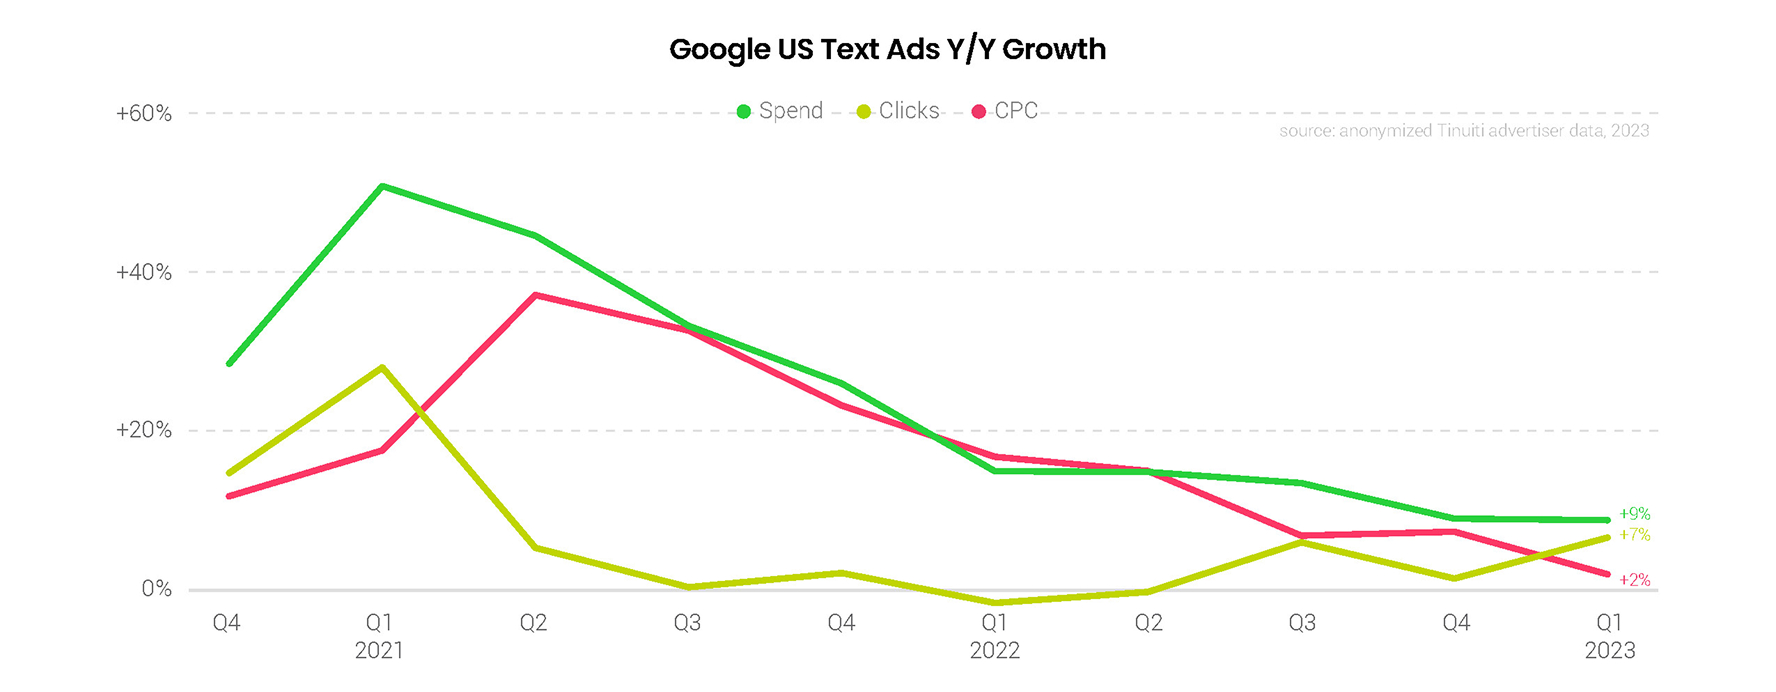
Spending on Google search text ads was up 9% Y/Y in Q1 2023, which was steady with a quarter earlier. Text ad clicks grew 7% in Q1, which was the strongest growth advertisers have seen since the first quarter of 2021. Text ad pricing growth, however, continued to weaken with CPCs up just 2% Y/Y in Q1 2023. After peaking at 37% Y/Y in Q1 2021, text ad CPC growth has now slowed for seven quarters in a row.
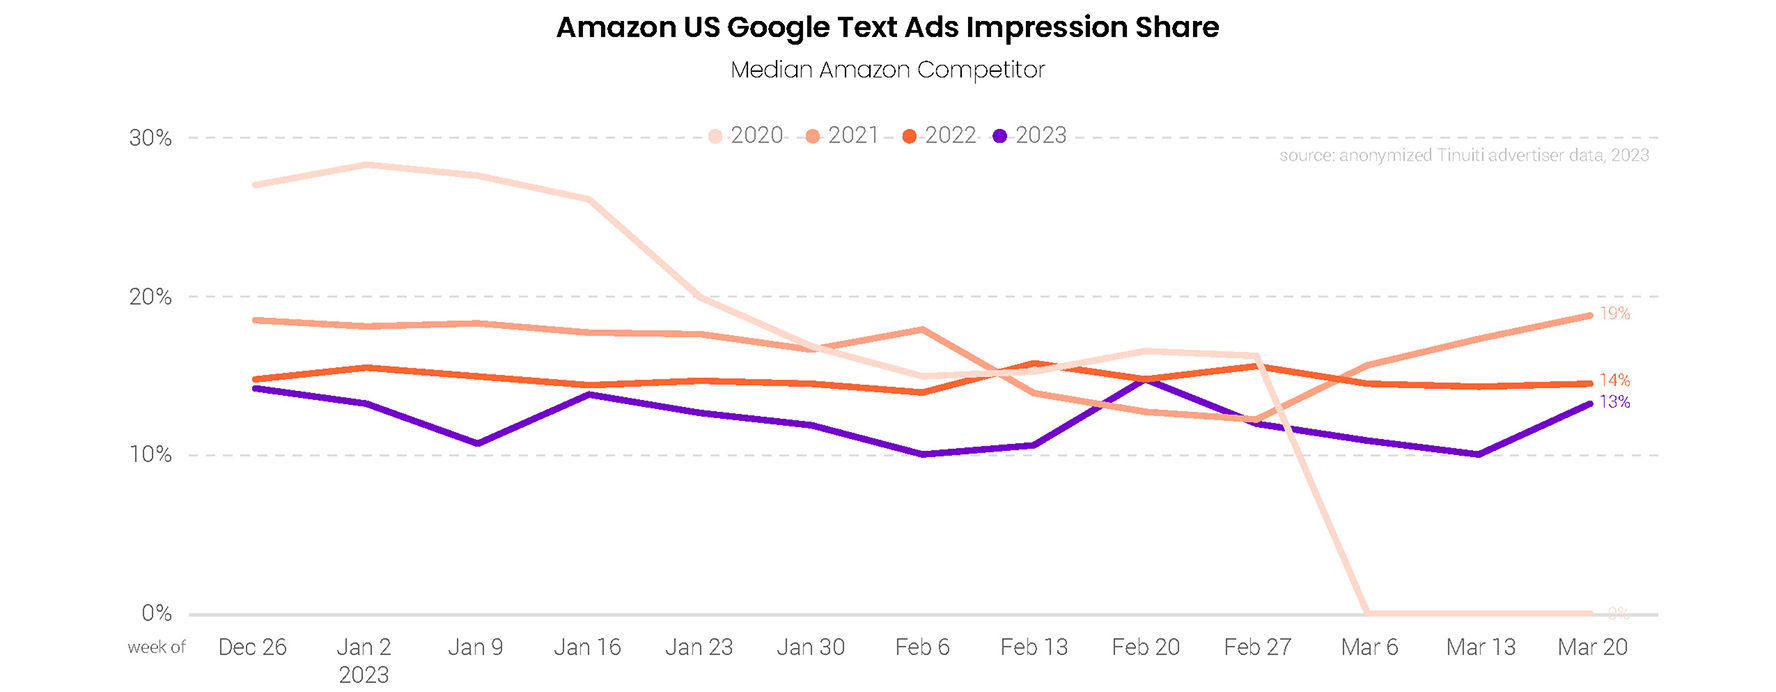
While Amazon’s presence in Google text ad auctions has been diminished since the pandemic started, Amazon’s share of text impressions had generally been trending higher in more recent years. But after a weak showing in Q4 2022, Amazon’s share of Google text ad impressions was as low as it has been over the last four years in Q1, excluding the tail end of Q1 2020, when Amazon turned off its Google ads entirely.
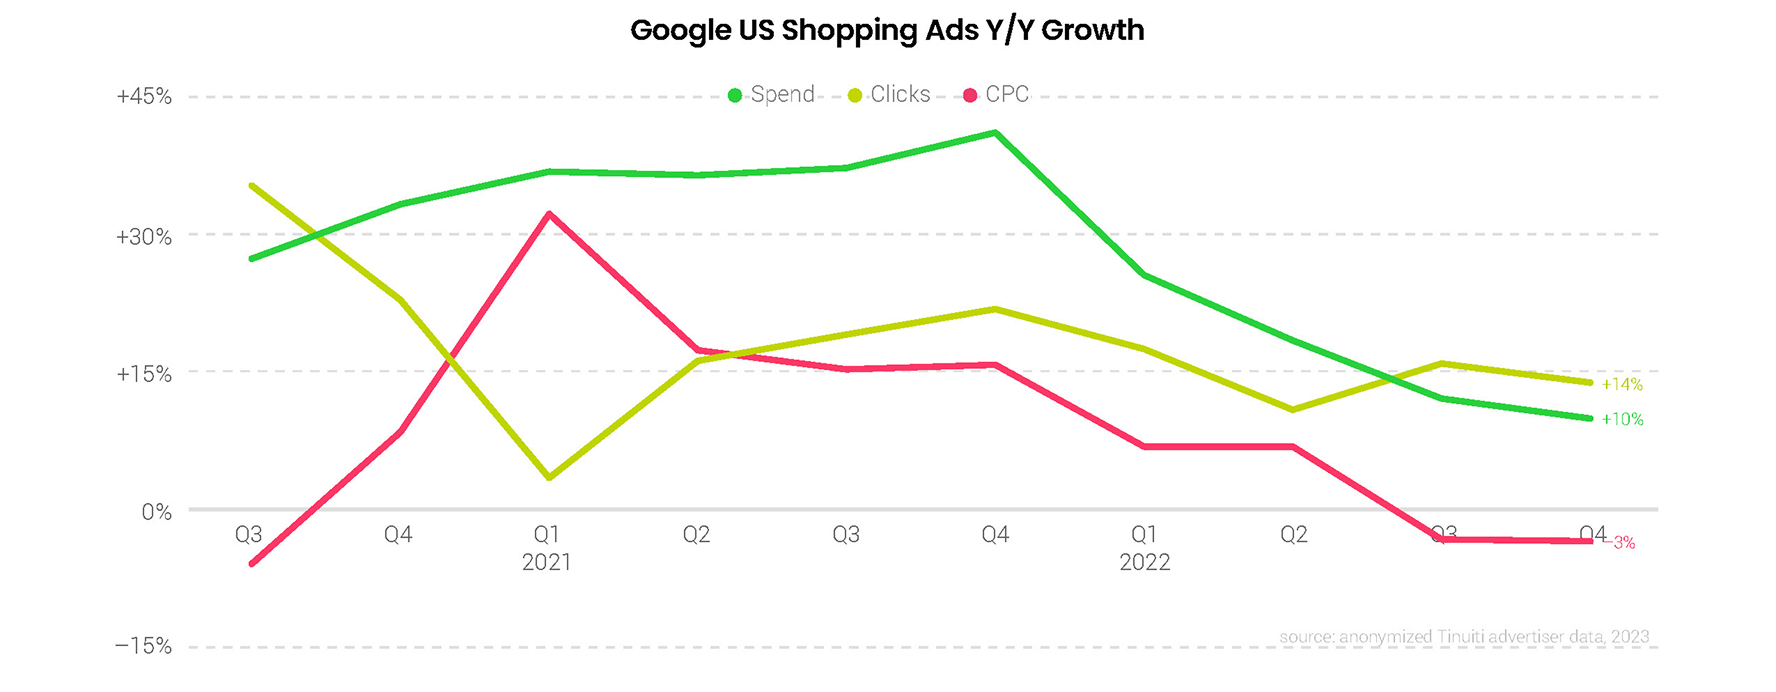
Spending on Google Shopping ads, including inventory purchased through Performance Max campaigns rose 10% Y/Y in Q1 2023, down from 12% growth a quarter earlier. While Google’s late 2022 transition from Smart Shopping to Performance Max campaigns was an important milestone, it hasn’t led to a significant change in trending for Shopping ads yet. As with Google text ads, Shopping CPC growth slowed, albeit slightly, for the seventh quarter in a row in Q1. Shopping clicks were up 14% Y/Y in Q1, down from 16% in Q4.
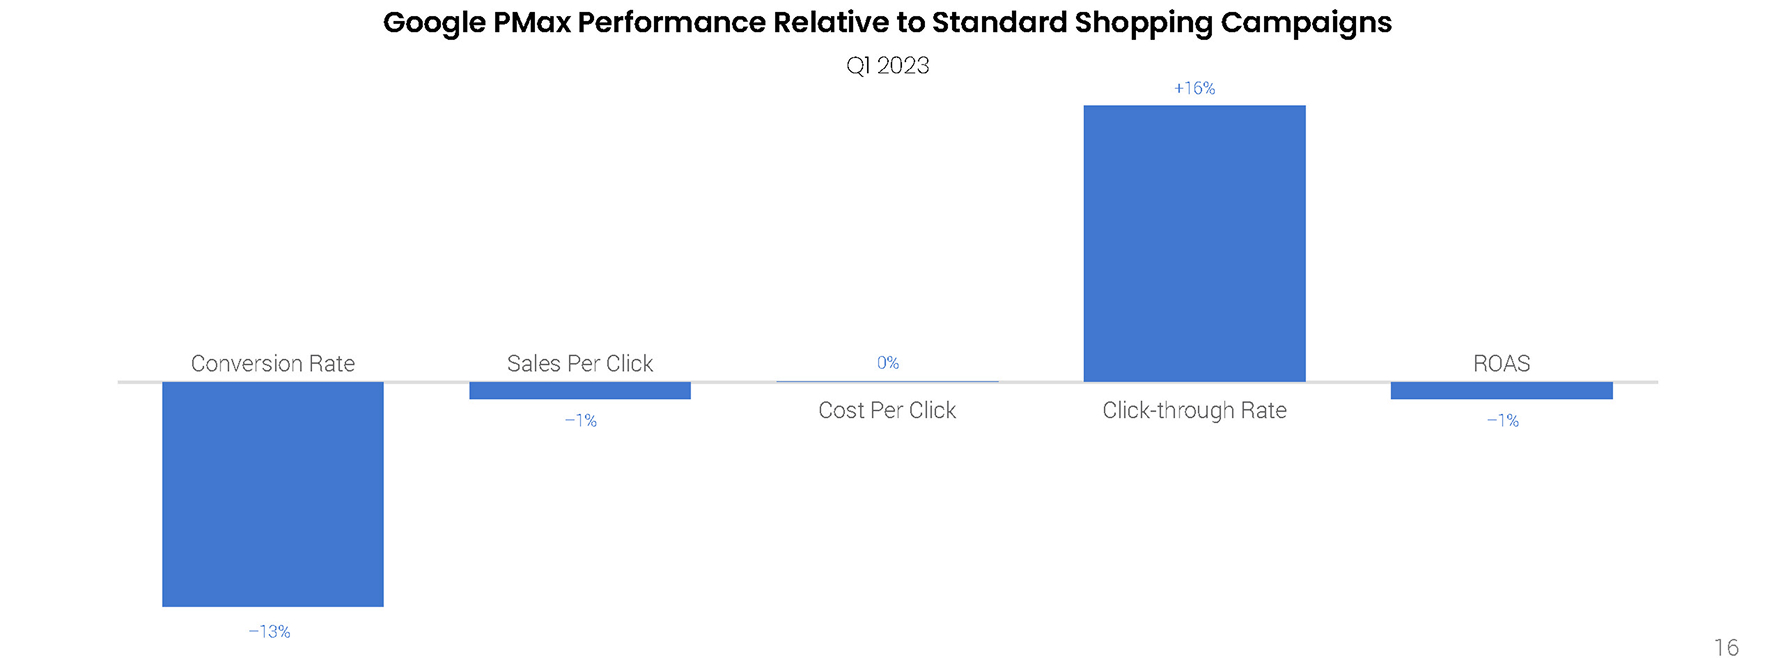
Although Performance Max campaigns include impressions from a wider swath of sources than standard Shopping campaigns, key metrics for the two are remarkably similar for the typical brand running both. Although conversion rates were 13% lower for PMax, average sales per click was less than 1% lower for PMax. With PMax seeing just a slightly higher average CPC than standard Shopping campaigns, there is just a 1% difference in return on ad spend (ROAS) between the two, with standard Shopping campaigns coming out on top by a hair.
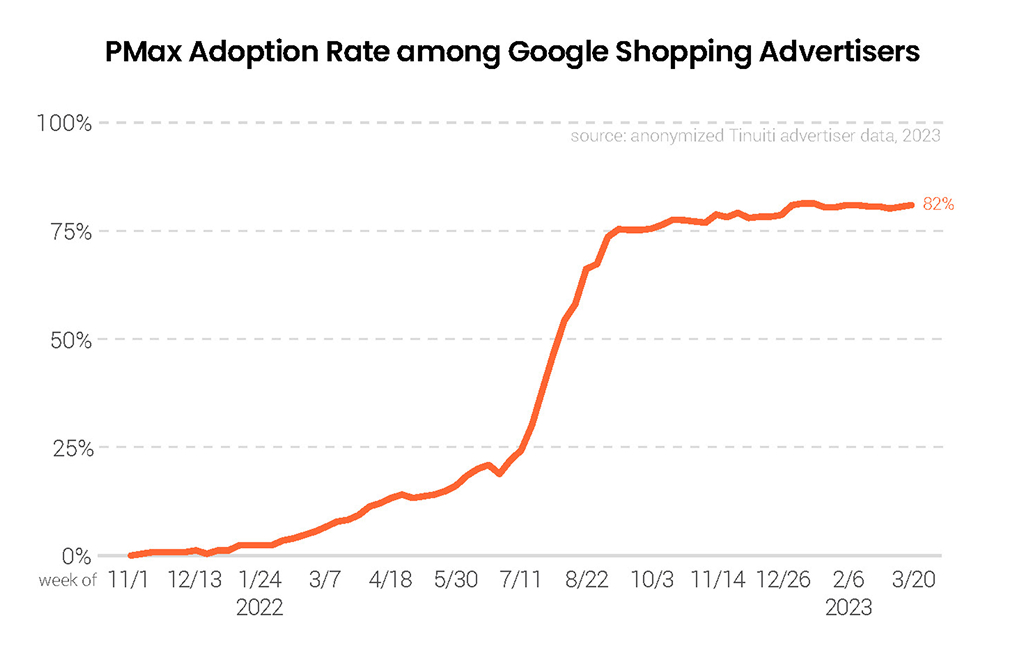
Before they were transitioned to Performance Max, Smart Shopping campaigns were in use by 75% of advertisers running Google Shopping ads. Performance Max adoption is running a little higher than that and gained some ground between Q4 2022 and Q1 2023. Among brands buying Shopping ads through either Performance Max or standard Shopping campaigns, 82% ran PMax campaigns at the end of Q1 2023. Over Q4 2022, Performance Max adoption averaged 78%.
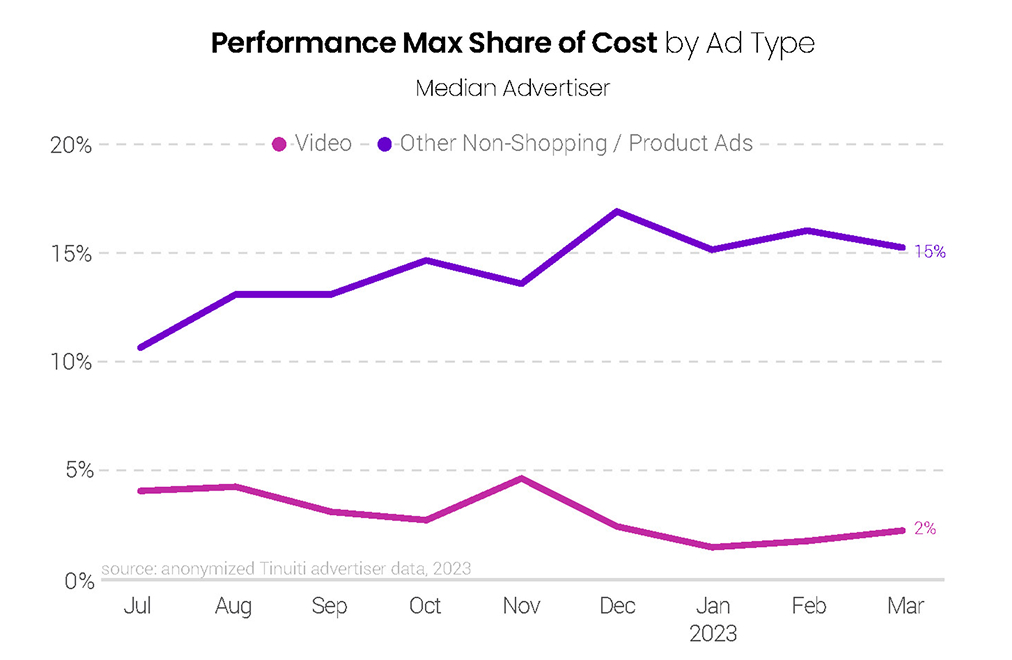
In Q1 2023, 83% of Performance Max spending was generated by Shopping ads on Google’s search network or similar dynamic product ads on its display network. That was up a point from Q4 2022, when Shopping/product ad inventory accounted for an average of 82% of Performance Max costs. Video inventory fell to just 2% of PMax spending in Q1, while other non-Shopping inventory, which includes display and search text ads, accounted for a slightly higher share of PMax costs in Q1 than in Q4.
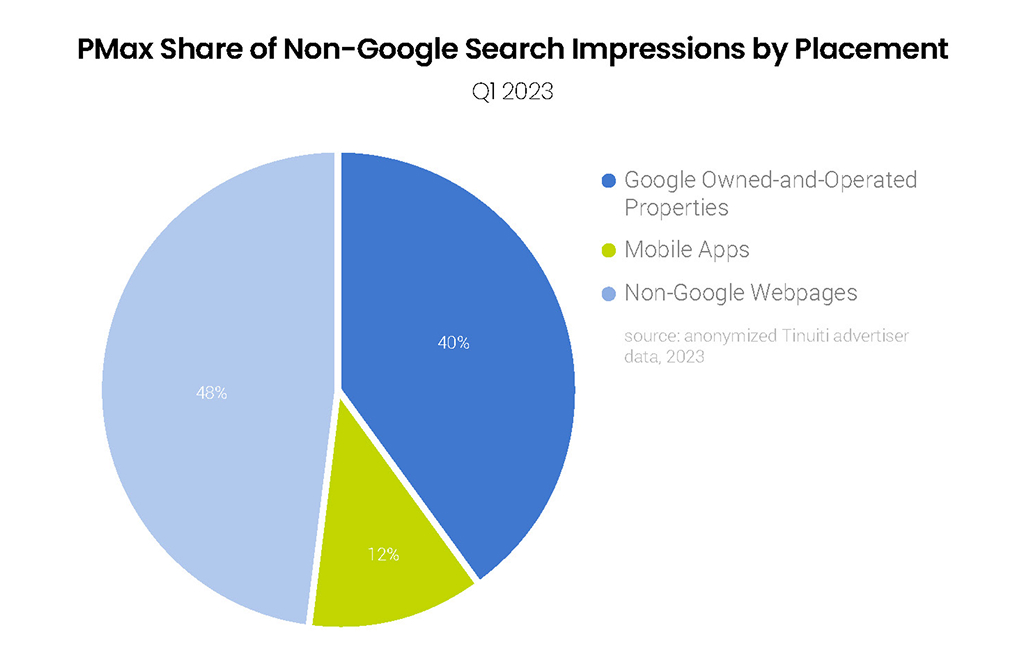
Among the minority of Performance Max impressions not produced by Google’s core search product, just under 40% were produced in Q1 by other Google owned-and-operated properties like YouTube, Discover, and Gmail. That was down just slightly from 42% in Q4. Mobile app share of Performance Max placement impressions held steady at 12% in Q1, while non-Google webpages saw a small uptick in impression share to 48% in Q1.
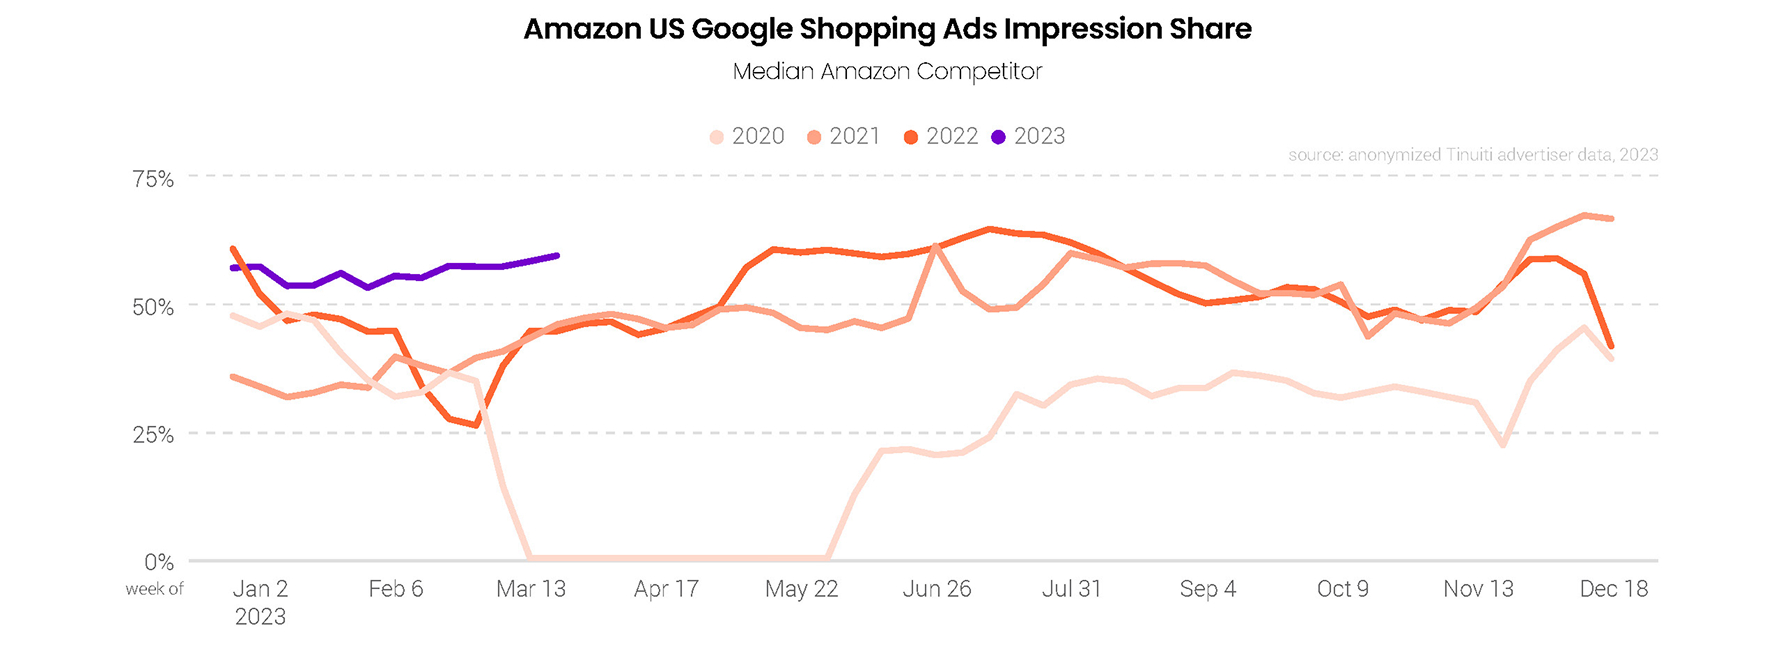
Contrary to trends on the text side of Google’s search ad business, Amazon appears to be as aggressive as ever in securing Google Shopping impressions. After running roughly in line with 2021 for much of late 2022, Amazon’s share of Google Shopping impressions fell to close out Q4, but it quickly recovered to start 2023. Over the second half of Q1, Amazon’s share of Google Shopping impressions was up by an average of 20 points compared to a year earlier.
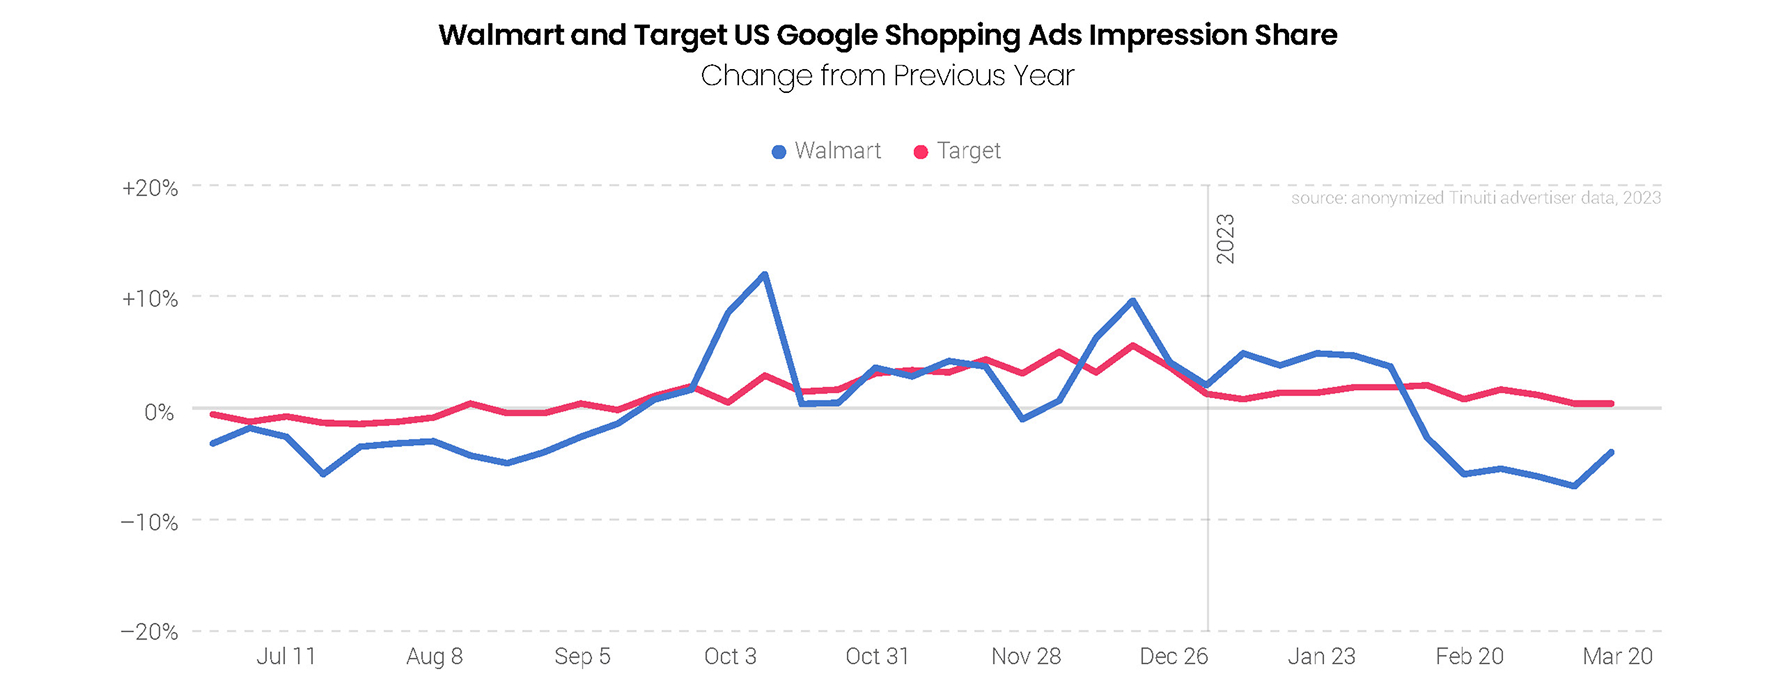
Amazon’s share of Google Shopping impressions appears to be getting a bit of help from Walmart running less aggressively in Shopping auctions, at least toward the end of Q1. Compared to a year earlier, Walmart closed out Q1 with a five-point decline in Shopping impression share. As has typically been the case, Target’s share of Shopping impressions fluctuated less than Walmart’s in Q1, averaging just a one-point increase from the year before, with little movement throughout the quarter.
Advertisers grew Sponsored Products investment by 12% year over year in Q1, slowing from 17% in Q4 as click growth decelerated from 27% to 14%. The first quarter of 2023 was the first quarter since Q2 2022 in which Amazon did not run a major Prime member event, though the October Prime Early Access Sale paled in comparison to July’s Prime Day event in terms of driving up demand. Q1 2023 marked the second straight quarter of year-over-year CPC declines for Sponsored Products advertisers.
Investment in Sponsored Brands fell 8% year over year in Q1, as both clicks and CPC fell 4% in the quarter. While Sponsored Brands growth once regularly outpaced that of Sponsored Products, as adoption grew and Amazon rolled out Sponsored Brands Video, this hasn’t been the case since Q4 2021. Aside from the Prime Day-boosted Q3 2022 quarter, Sponsored Brands CPC growth has now decelerated every quarter since Q2 2021.

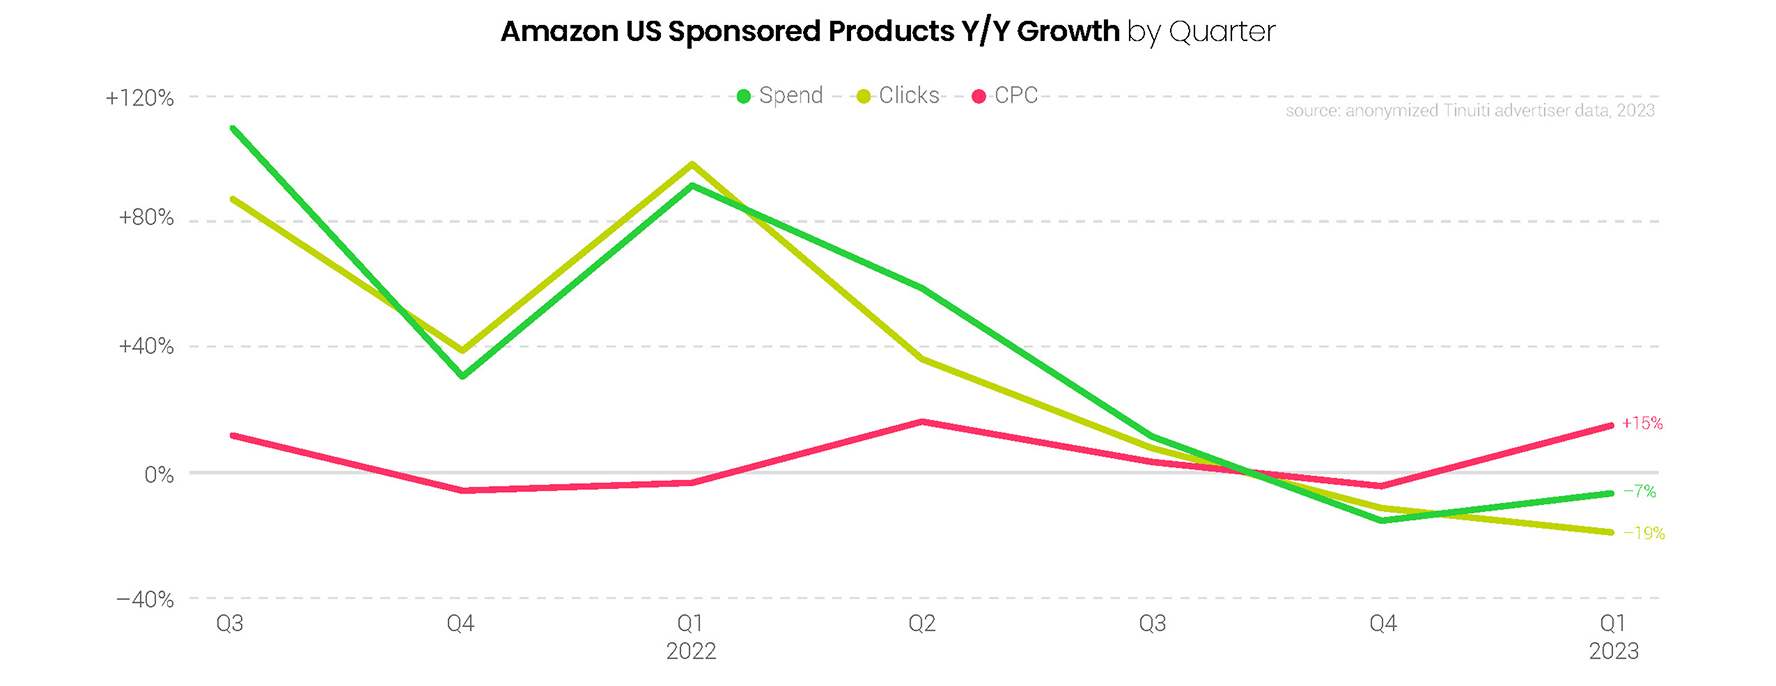
After two straight quarters of deceleration and a Q4 Y/Y decline, Amazon Sponsored Display click growth rebounded to 15% in Q1 2023. Spend fell 7% year over year for the quarter, an improvement from the 16% decline observed in the final quarter of 2022. CPC growth decelerated for the fourth straight quarter, falling 19% year over year in Q1 2023 after rising an astonishing 99% year over year in Q1 2022. Sponsored Display ads aren’t always purchased on a CPC basis, as advertisers can choose to bid based on the cost of viewable impressions.
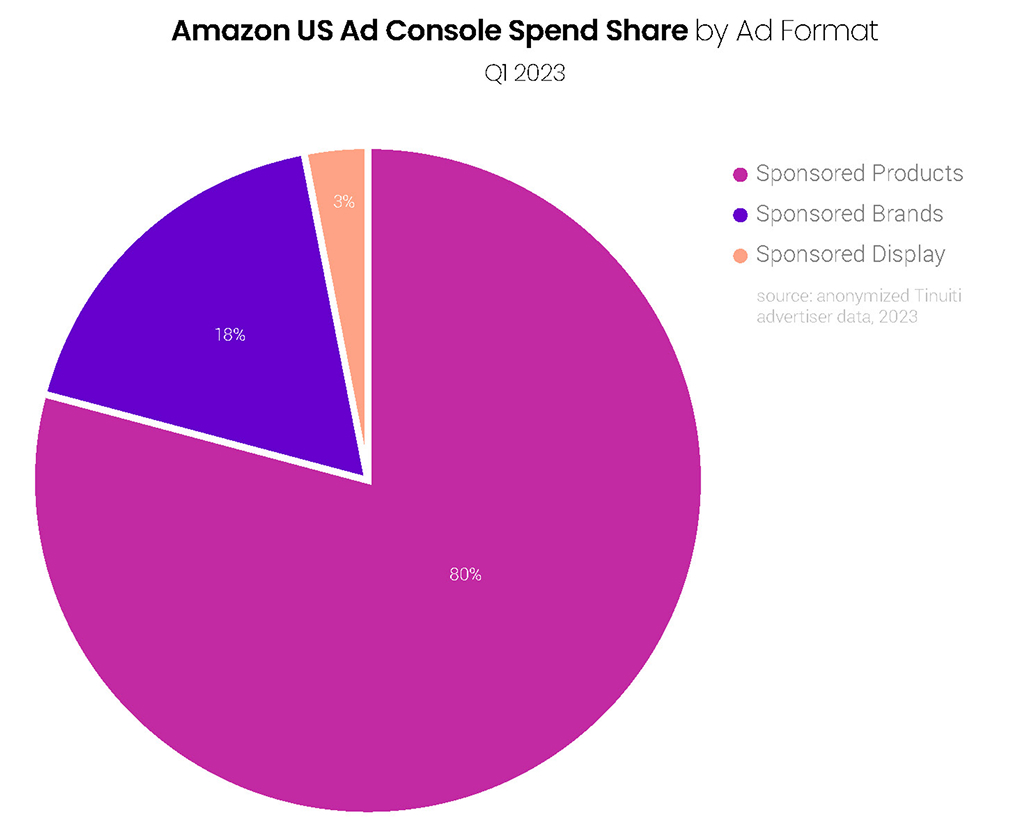
Sponsored Products accounted for 80% of all Amazon Ad Console spend in the first quarter of 2023, up from 78% in Q4, as Sponsored Products growth far outpaced that of Sponsored Brands and Sponsored Display in Q1. While Sponsored Brands and Sponsored Display can be effective campaign types to drive direct response, Sponsored Products campaigns are still viewed by most advertisers as the most effective vehicle for high-return, demand capture efforts among Ad Console formats.
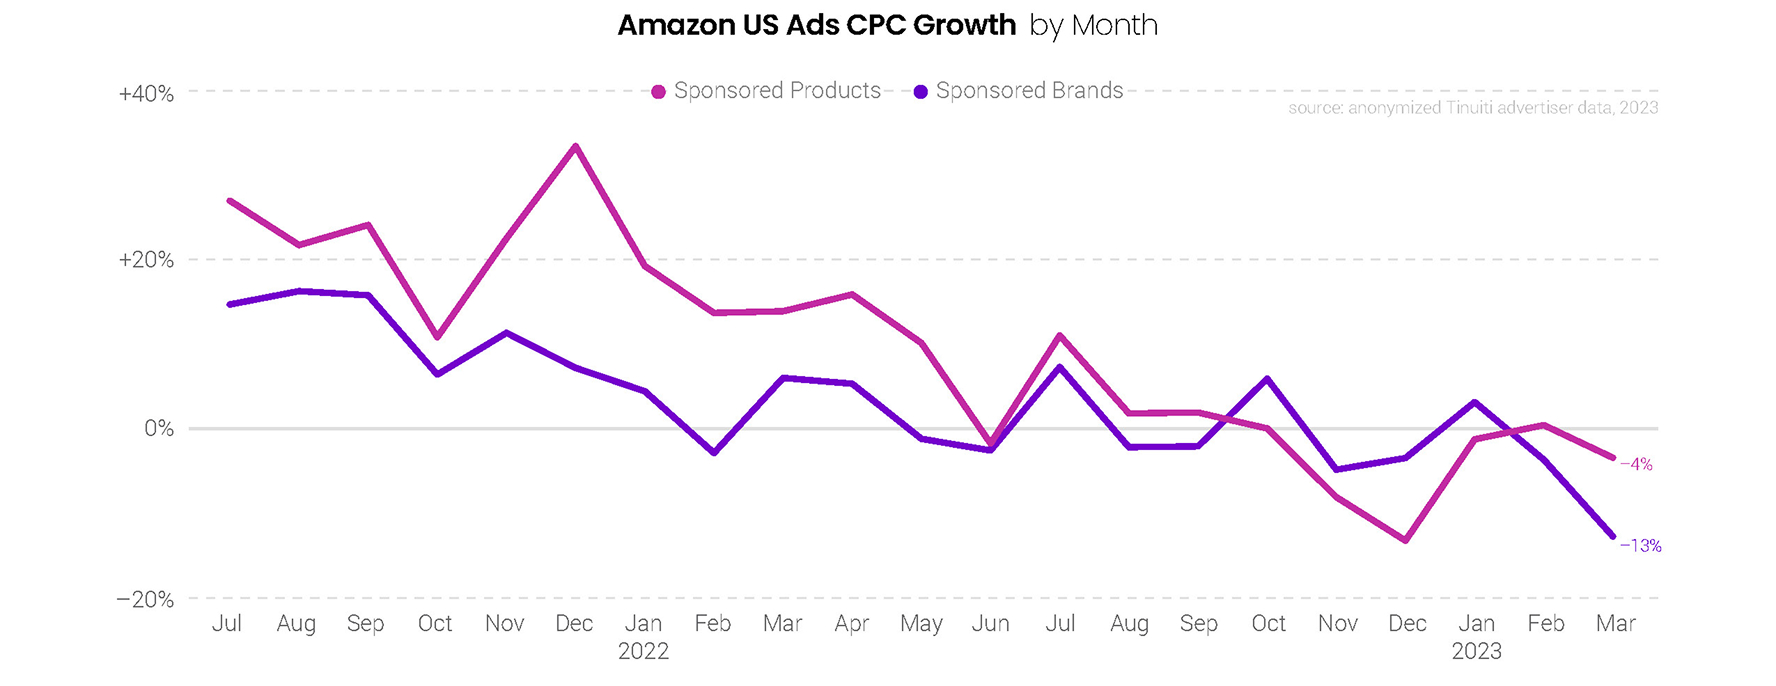
Sponsored Products CPC growth rebounded from a 14% decline in December to just a 1% decline in January. Sponsored Brands CPC growth also jumped from a 4% decline in the last month of 2022 to 3% in the first of 2023. In the case of both formats, however, CPC growth grew softer to end the quarter, as March CPC was down 4% year over year for Sponsored Products and 13% for Sponsored Brands. Sponsored Products ad pricing movement has largely tracked with changes in sales per click since the end of 2021.
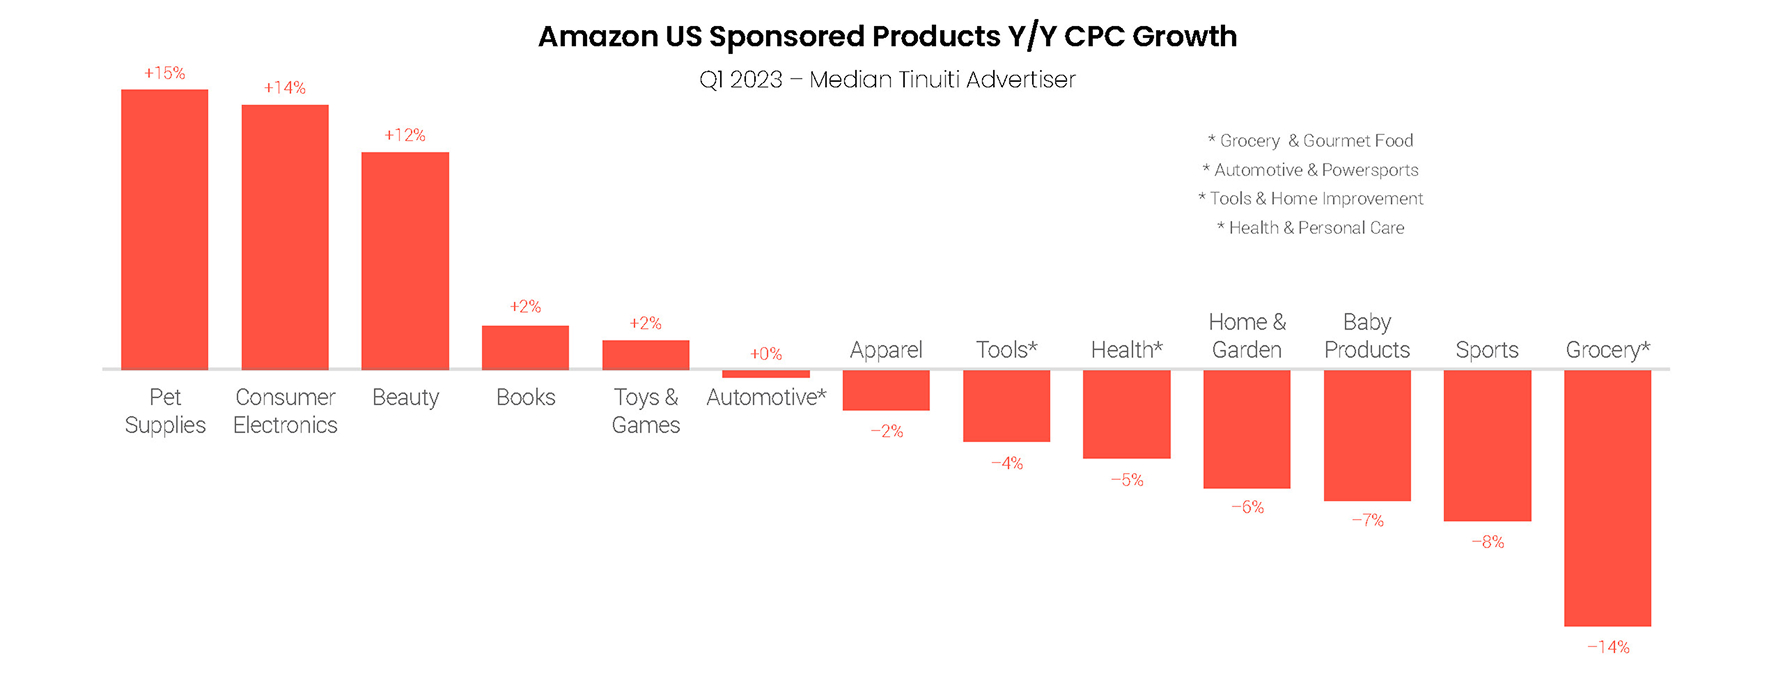
In Q4 2022, just two out of thirteen major product categories studied for this report showed positive year-over-year CPC growth. In Q1 2023, that increased to five product categories, with pet supplies leading the pack at 15% growth for the median brand. Grocery and gourmet food brands saw the biggest CPC decline in the first quarter with a 14% drop. Across all product categories, Sponsored Products CPC decline went from down 8% in the final quarter of 2022 to just a 2% decline in Q1.
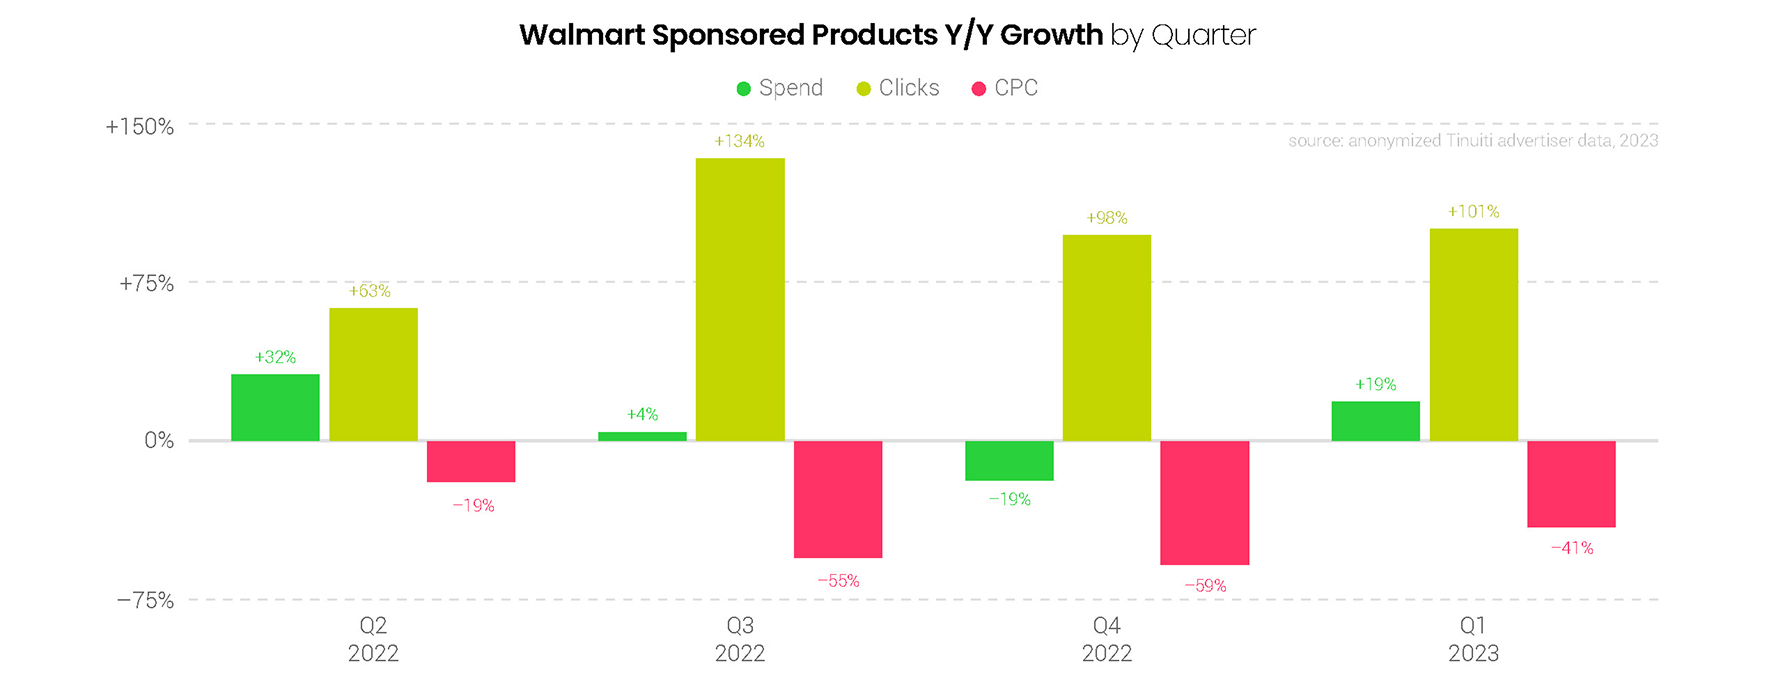
Walmart Sponsored Products clicks more than doubled year over year in Q1 as spend grew 19%. CPC continued to decline for most advertisers and fell 41% Y/Y in the first quarter, as advertisers have yet to lap the Q2 2022 update that changed Walmart ad auctions from first price to second price. The change immediately put downward pressure on the cost of ad clicks as advertisers no longer had to pay the full cost of their bids and instead paid just enough to beat out the advertiser directly below them in each ad auction.
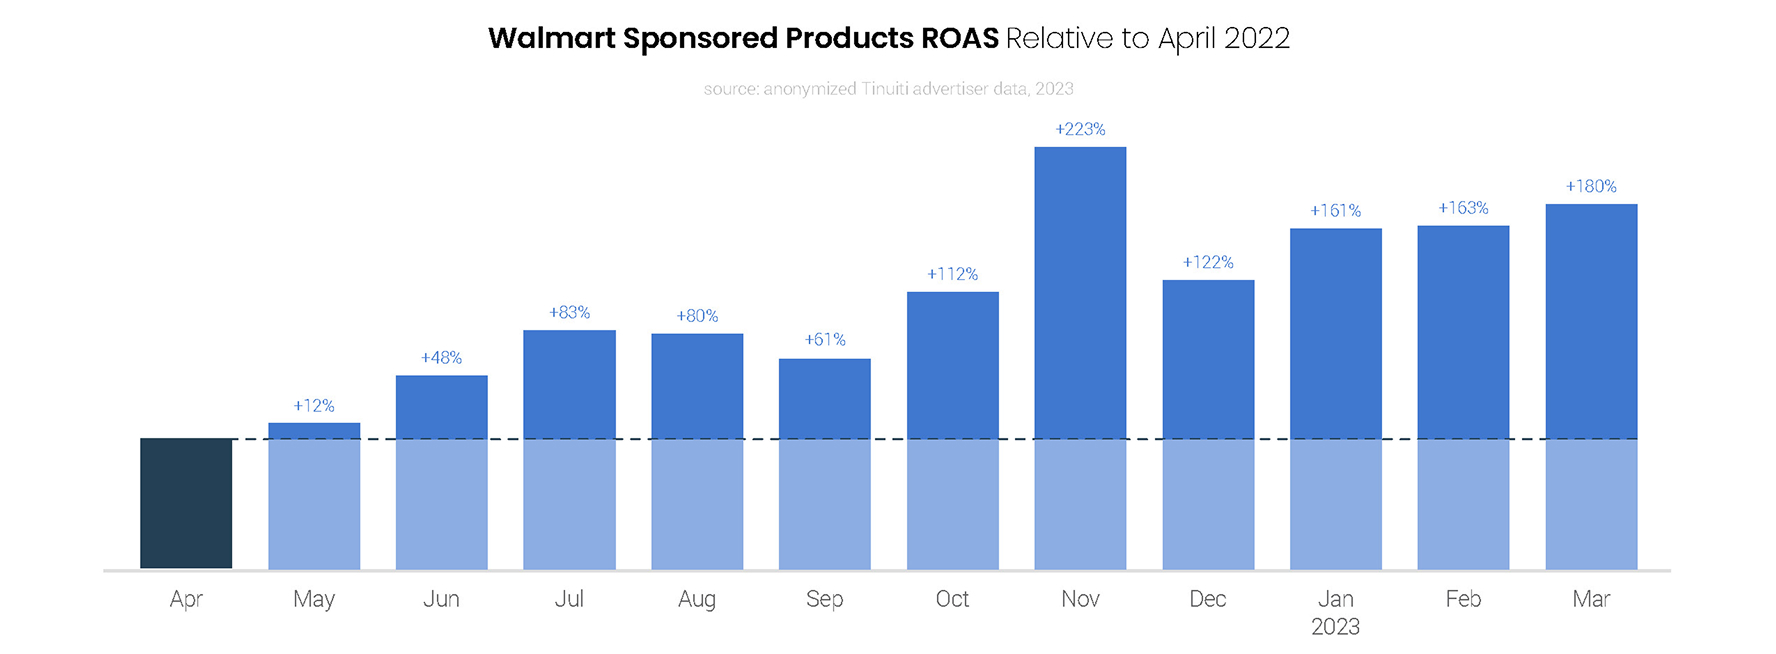
Relative to April 2022, Walmart Sponsored Products ROAS was at least two and a half times as high for every month of Q1 2023, as advertisers continue to reap the benefits of Walmart’s shift to a second-price auction. Another update helping Walmart advertisers achieve greater efficiency has been the rollout of variant bidding, which allows brands to promote any variation of an item in their catalog, rather than just the primary variant. Variant-level bidding rolled out in January 2023 and is already allowing advertisers to direct budget to the variants that perform the best.
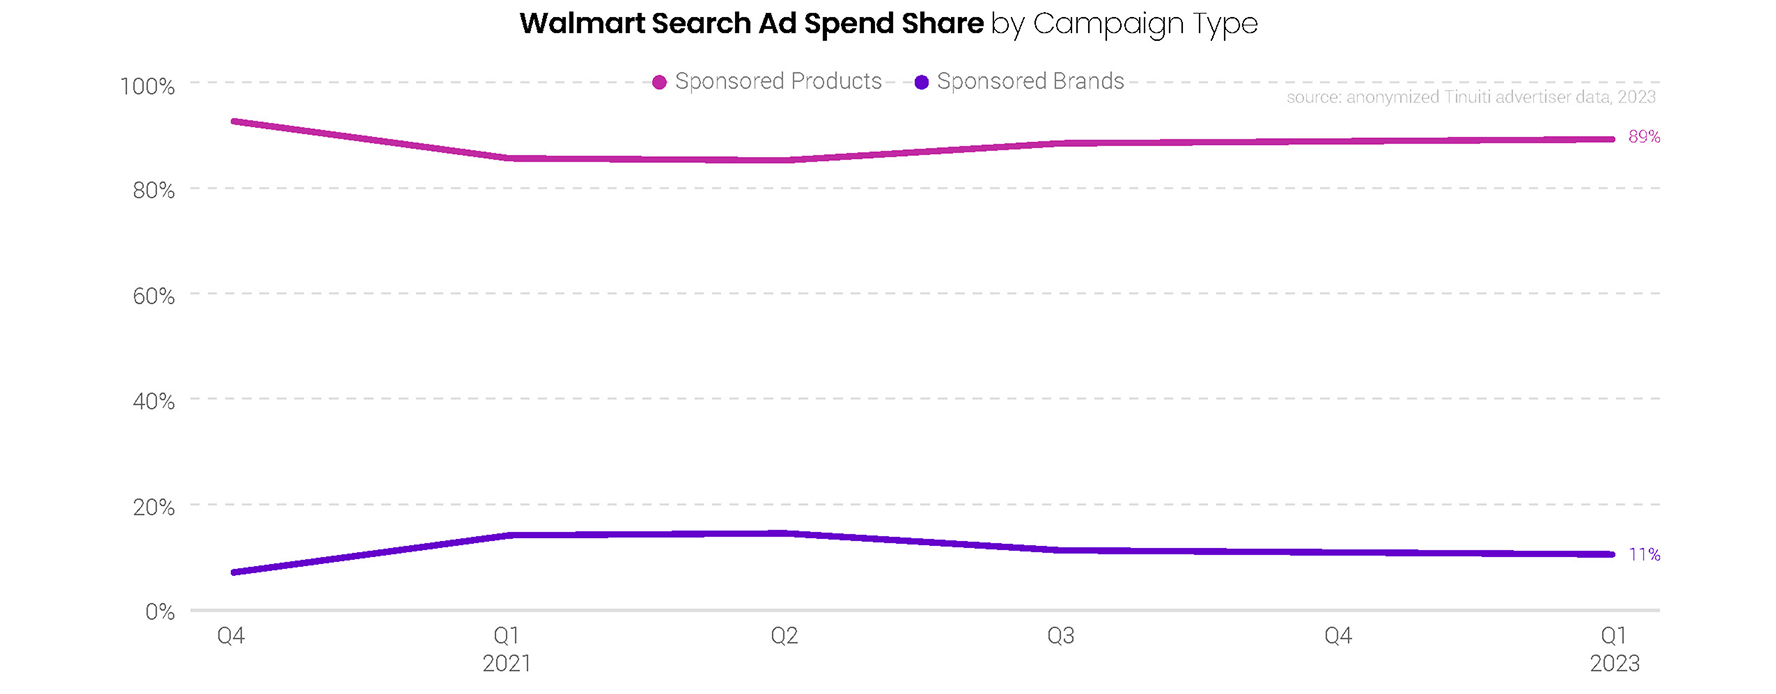
Sponsored Brands once again accounted for 11% of all Walmart search ad spend in Q1, the same share observed in each of the previous two quarters. Sponsored Products continues to account for the lion’s share of Walmart search advertising investment with 89% of total spend. Both Sponsored Products and Sponsored Brands auctions switched from first price to second price in Q2 2022, sending the cost of ad clicks down for each as advertisers no longer had to pay the full amount bid.
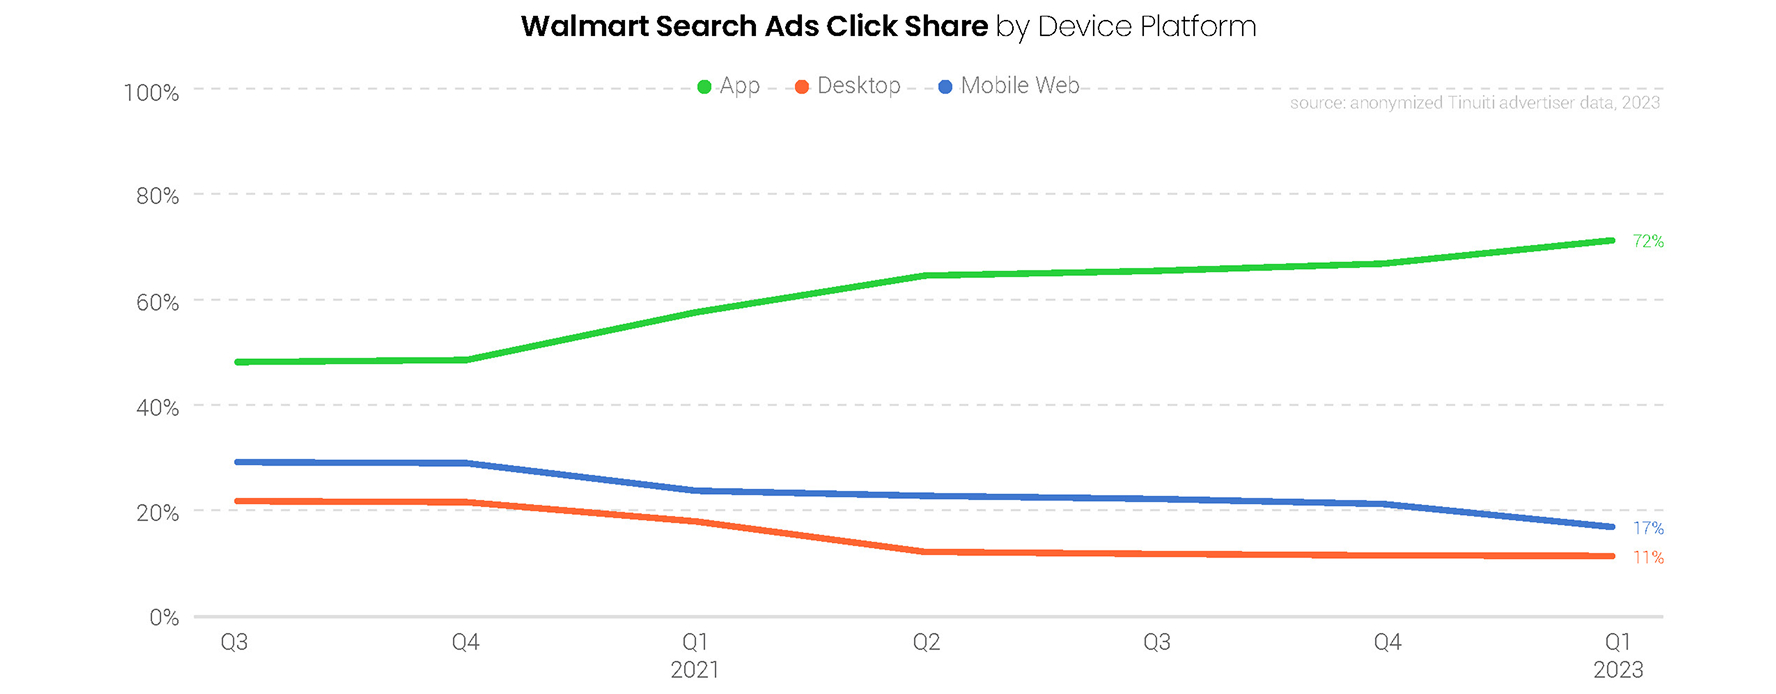
Back in Q3 2021, the Walmart app accounted for just 48% of all Walmart search ad clicks, but that share has steadily grown over the last several quarters and stood at 72% in Q1 2023. Both desktop and mobile click shares have declined over the same time frame, as it appears consumers are increasingly heading to the Walmart app to conduct product searches over time. Desktop continues to account for the highest sales per click, accounting for 17% of sales attributed to Walmart search ads from just 11% of clicks.
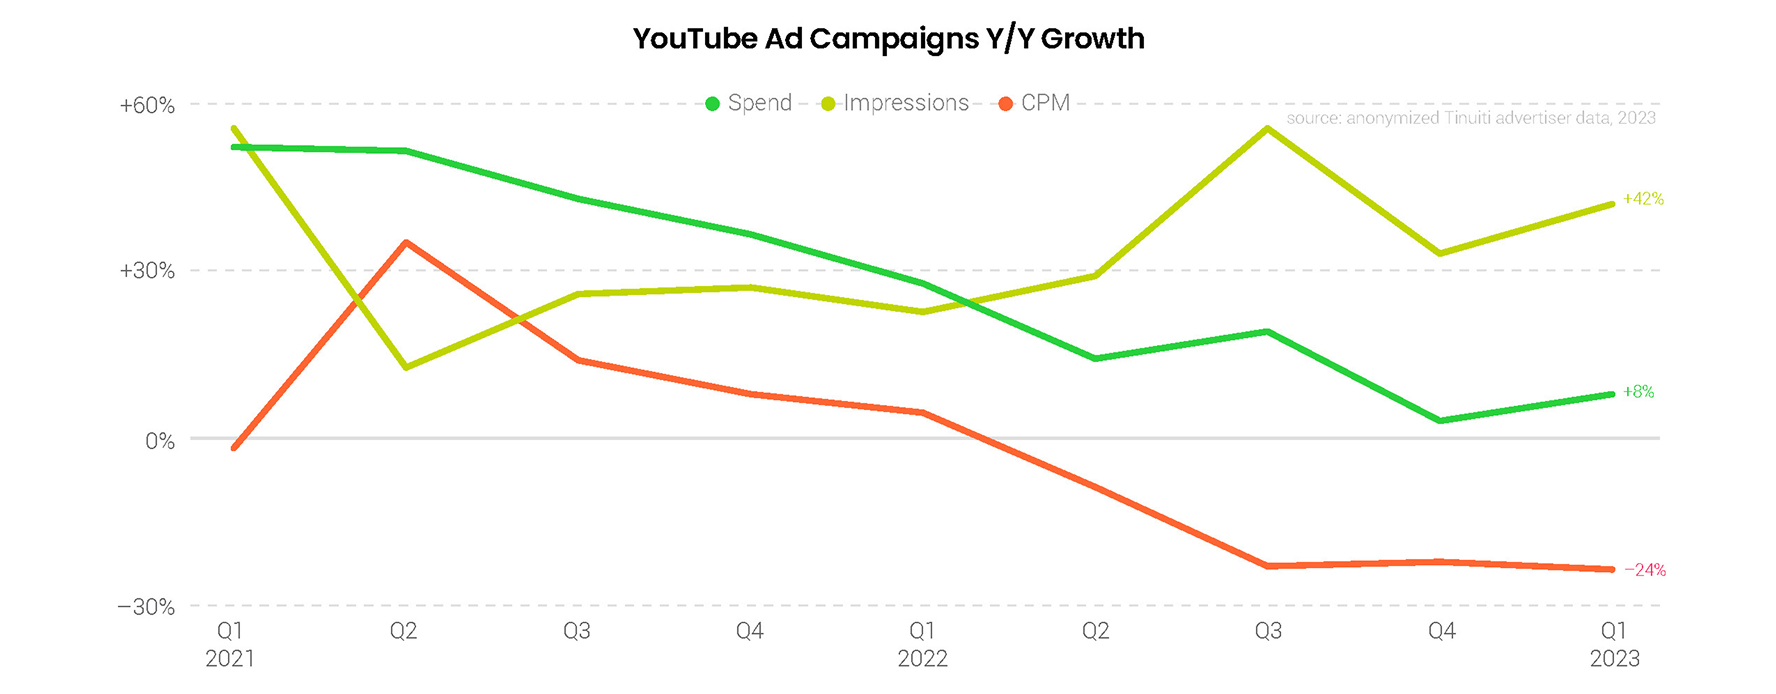
Among advertisers that were active for both quarters, YouTube spending grew 8% from Q1 2022 to Q1 2023, up from 3% Y/Y growth in Q4 2022. While average YouTube CPM was down 24% Y/Y in Q1, pricing declines have stabilized over the last three quarters. Impressions grew 42% Y/Y in Q1 2023, up from 33% growth in Q4 2022. YouTube advertisers continue to face weaker year-ago comps as official Google figures show that YouTube spending growth has been decelerating since Q2 2021 and spending fell in year-over-year terms over the second half of 2022.
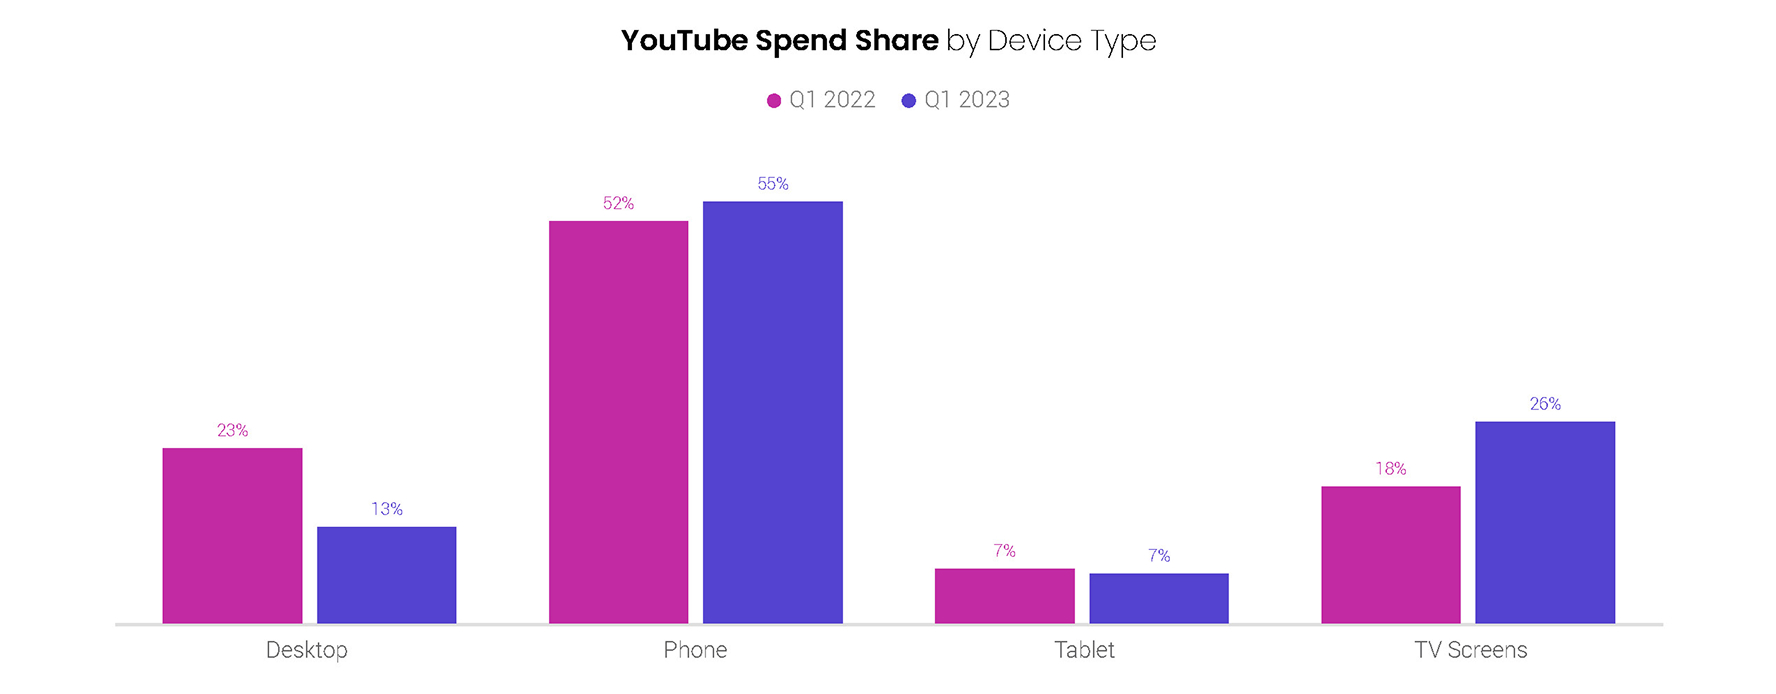
TV screens accounted for 26% of YouTube ad spending in Q1 2023, up from 18% a year earlier. While total YouTube spending was up just 8% Y/Y in Q1, it was up by 58% on connected TVs. Most of TV’s spend share gains came at the expense of desktop, which saw its share fall from 23% in Q1 2022 to 13% in Q1 2023. Phone share of YouTube spend picked up modestly between 2022 and 2023 as phone spending grew nearly 13%.
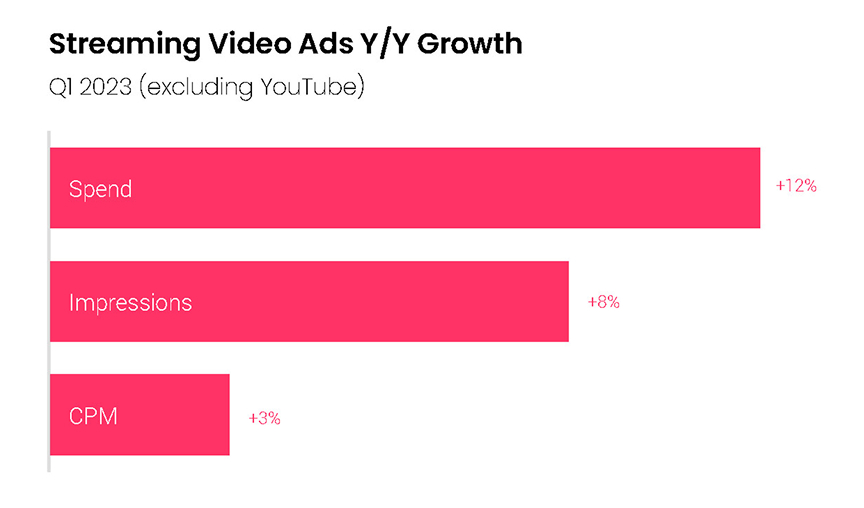
Outside of YouTube, streaming video ad spending grew 12% Y/Y in Q1 2023 among advertisers that remained active in the channel, up from 4% growth in Q4 2022. Streaming impressions were up 8% Y/Y in Q1, steady with Q4, while CPM growth improved from a 4% Y/Y decline in Q4 to a 3% Y/Y increase in Q1. Streaming CPMs have been bolstered in recent quarters from a mix shift from lower-CPM RTB-purchased inventory to more traditional cable and broadcast inventory sources.
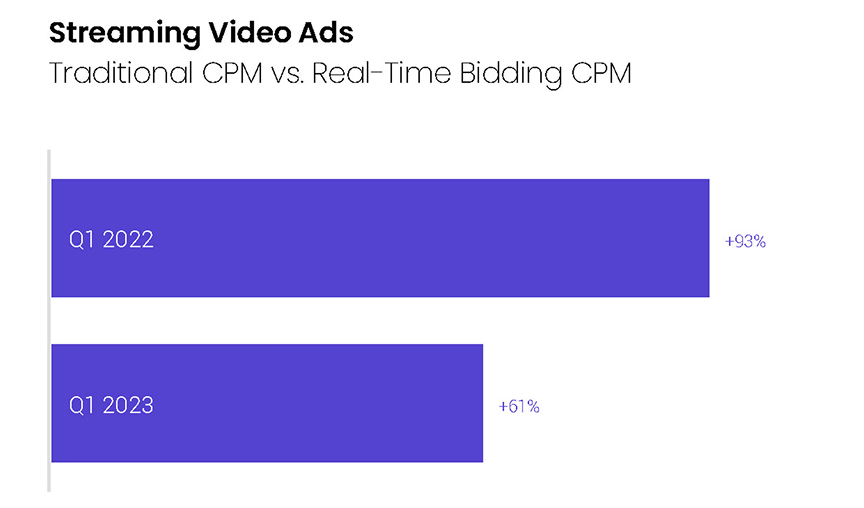
While recent weak demand in the scatter market for premium video ad inventory has narrowed the gap in CPMs for traditionally-purchased and RTB-purchased inventory, traditional CPMs were still 61% higher than RTB CPMs in Q1 2023. For advertisers that have been able to take advantage of these market conditions and have seen a material shift to premium video ad inventory, it has helped push CPM growth into positive territory at a time when most digital channels are still seeing pricing declines.
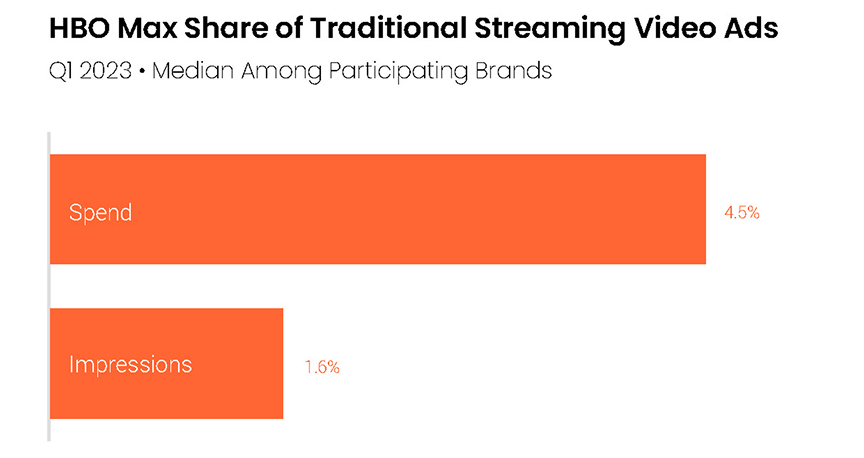
Among the brands running streaming video ads on HBO Max in Q1 2023, the platform accounted for 4.5% of traditional streaming spend, but just 1.6% of impressions. While it was still fairly early days for advertiser adoption of HBO Max ads, the platform commanded relatively high CPMs. As Warner Bros. Discovery moves to combine HBO Max with Discovery+, it will be looking to scale both its user and advertiser base.
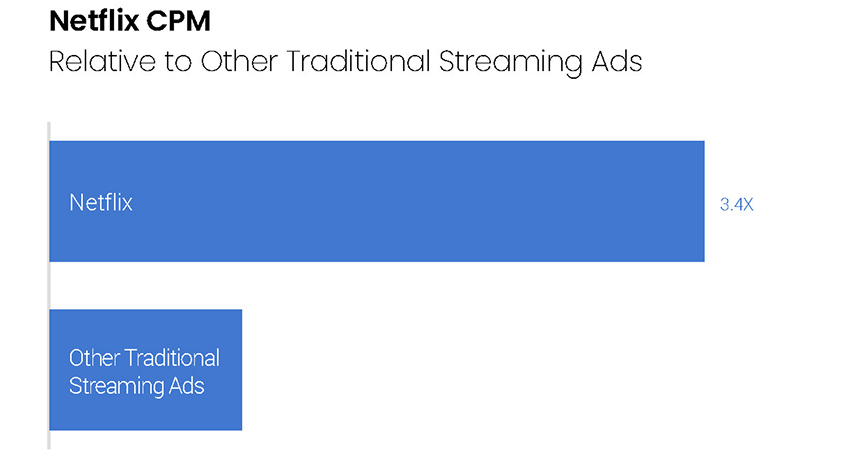
Having launched in early November 2022, Netflix’s adsupported tier reportedly reached about a million MAUs in the US after its second month. For comparison, Netflix has around 74 million total paid memberships in the US and Canada. While it is still comparably small, Netflix’s ad tier is seeing strong CPMs compared to other traditional streaming ad platforms. In Q1 2023, Netflix CPMs were 3.4 times those of other traditional streaming ad platforms.
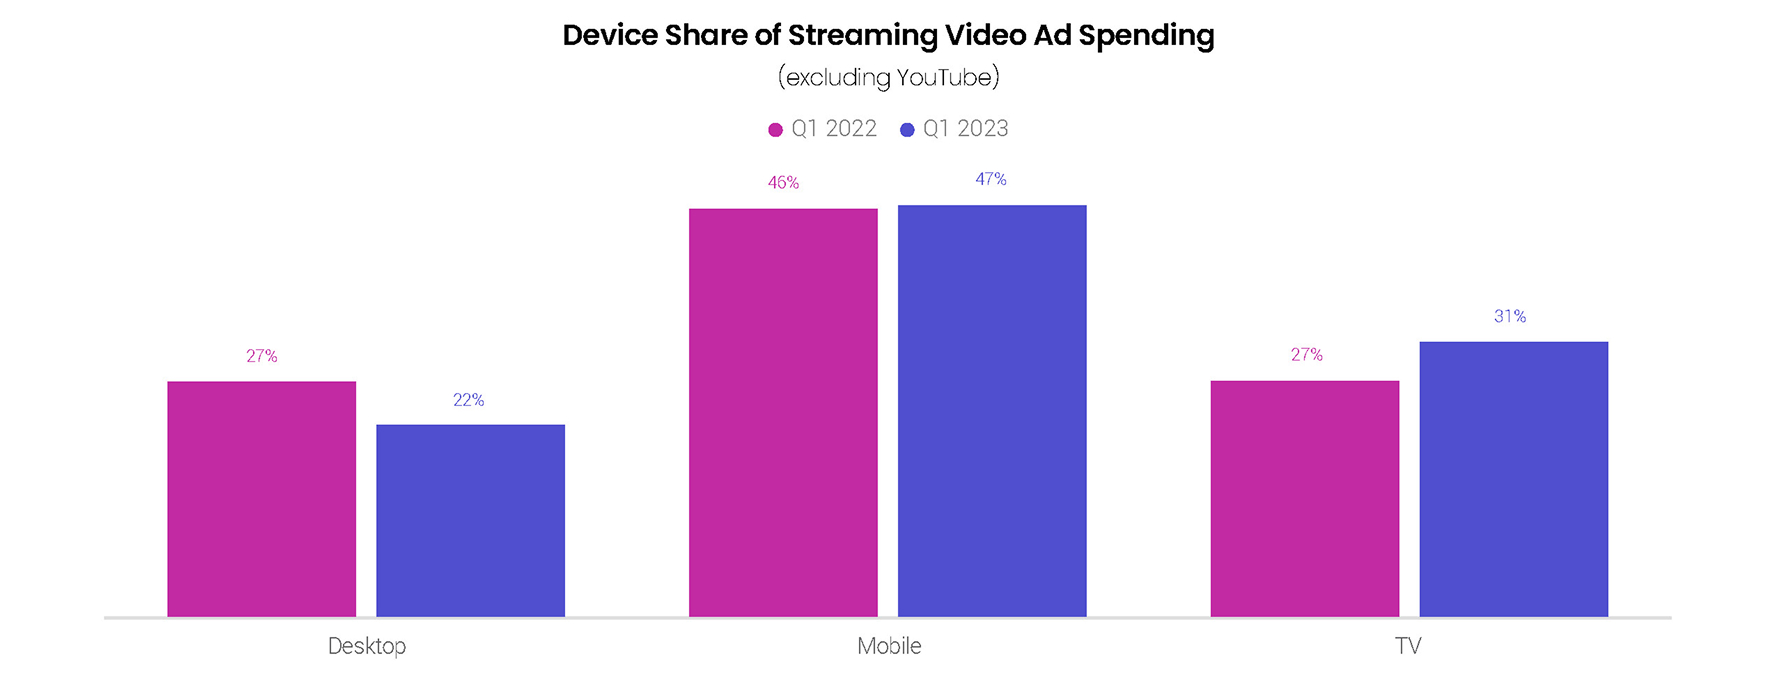
Mobile devices, including both phones and tablets, accounted for 47% of streaming video ad spending outside of YouTube in Q1 2023, up a point from a year earlier. With spending on connected TVs rising nearly 30% Y/Y, TV share of streaming spend rose from 27% in Q1 2022 to 31% in Q1 2023, although TV share was down slightly compared to Q4. Spend share for desktop and laptop computers fell from 27% in Q1 2022 to 22% in Q1 2023.
In 2020 and 2021, advertiser adoption of Google Discovery campaigns peaked during the Q4 holiday shopping season before falling off to start the next year. In 2022, however, advertisers focused on more lower-funnel channels in Q4, leading to an atypical drop in adoption rates for Discovery campaigns over the quarter. January 2023 did see further declines in Discovery adoption, but more brands got back on board throughout the quarter.
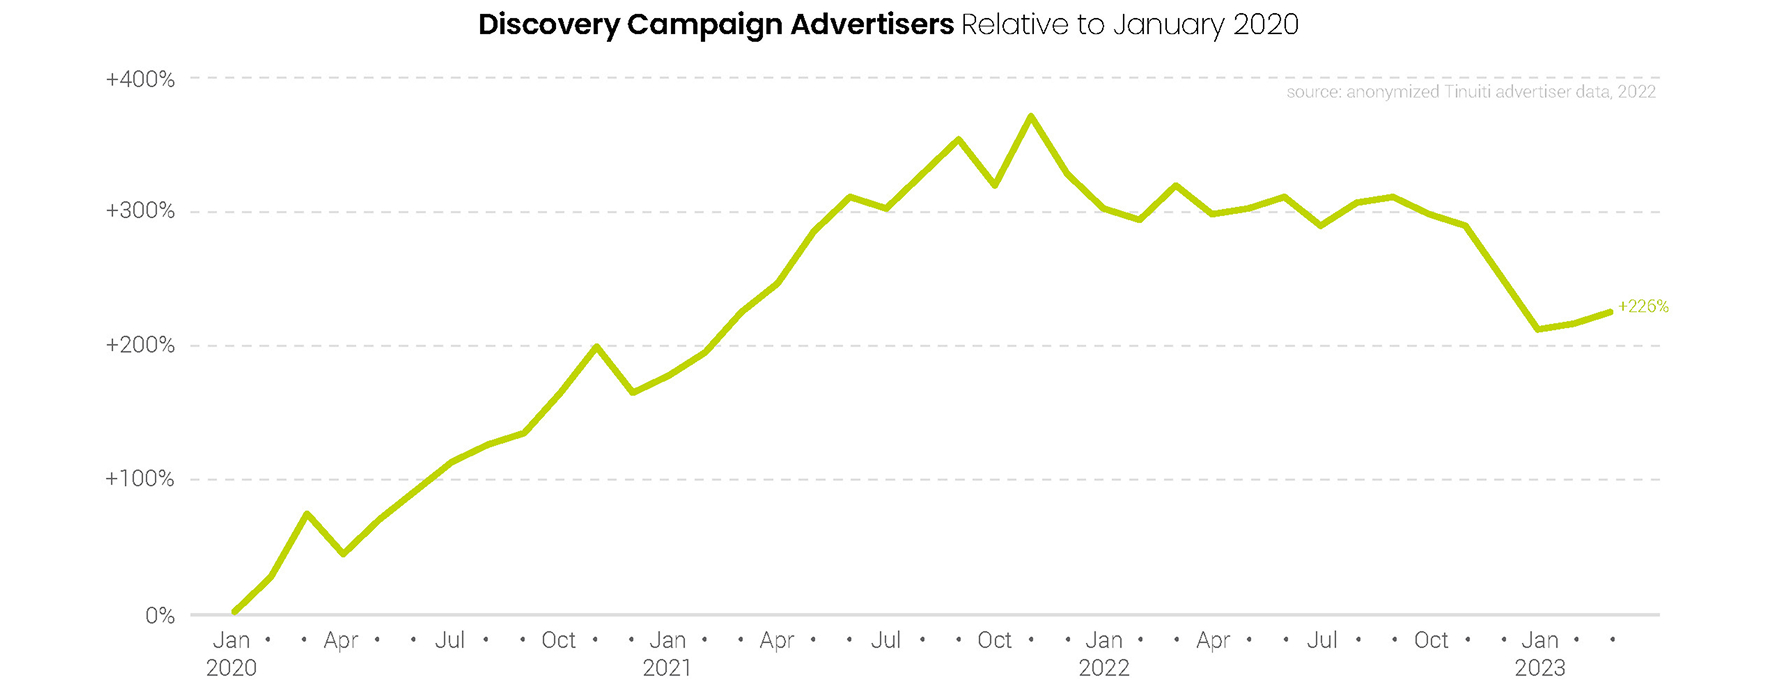
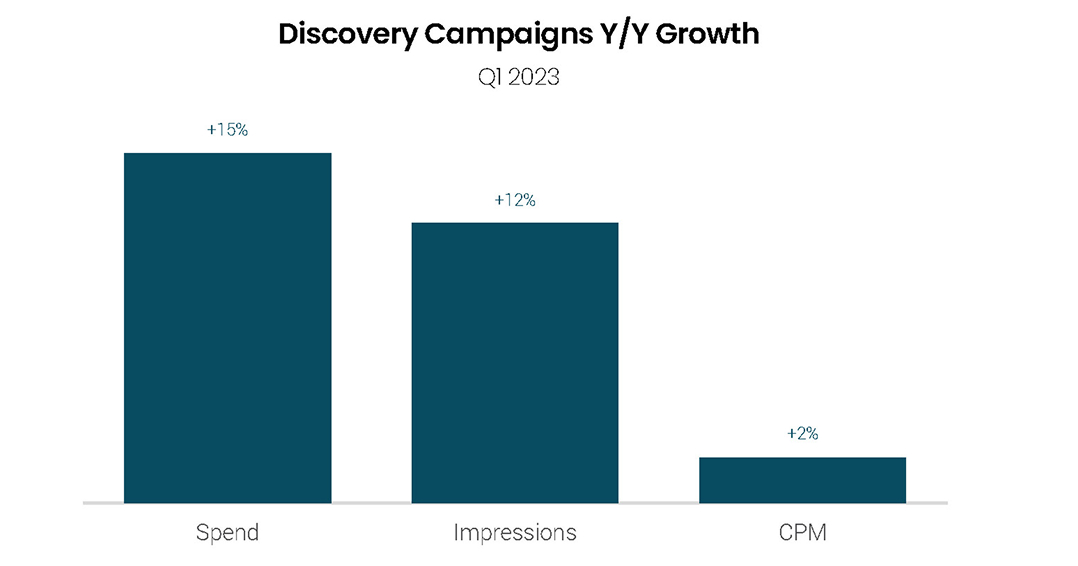
For the brands that did remain active on Google Discovery campaigns in both Q1 2022 and Q1 2023, spending growth was robust at 15% Y/Y. That was up from a 1% Y/Y decline a quarter earlier. Impression growth for Discovery campaigns cooled a bit from 21% Y/Y in Q4 to 12% Y/Y in Q1, but average CPM growth increased from a 19% drop in Q4 2022 to a 2% gain in Q1 2023.
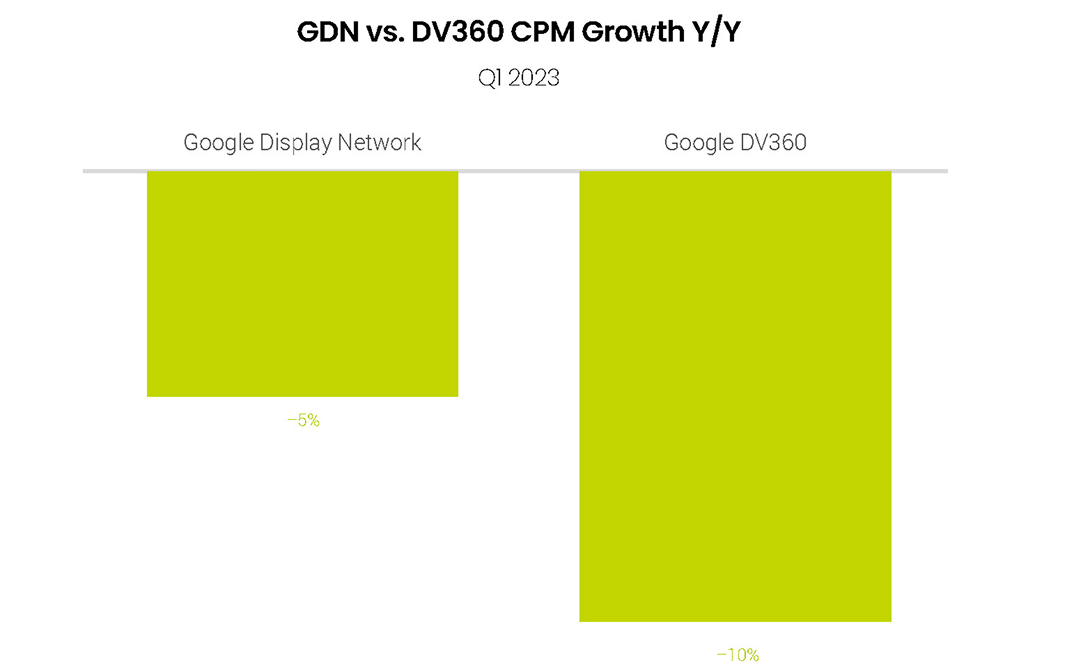
The average CPM advertisers paid for placements on the Google Display Network fell 5% Y/Y in Q1 2023, down from 3% growth a quarter earlier. Average CPM for placements purchased through Google DV360 fell 10% Y/Y in Q1 2023, but that was up from a 15% Y/Y decline in Q4. CPM growth for both platforms has decelerated significantly since Q4 2021, when GDN CPMs were up 31% Y/Y and DV360 CPMs grew 22%.
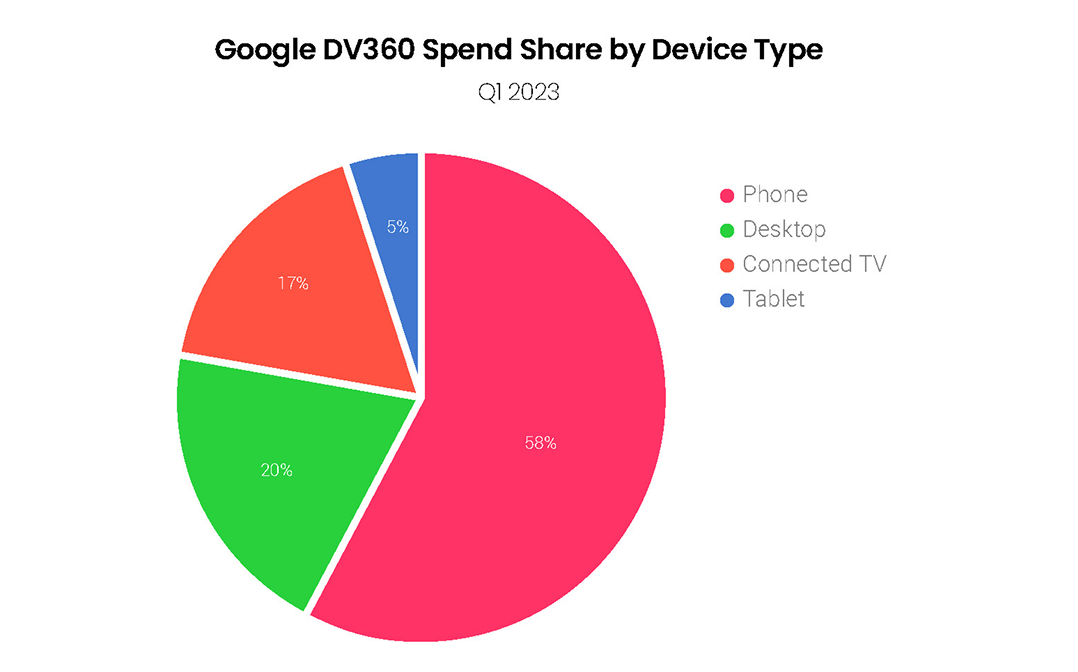
Connected TV accounted for 17% of spend for placements made through Google DV360 in Q1 2023. CTV share of DV360 spend is relatively strong primarily due to the impact of YouTube placements purchased through the platform. Phones still generated the lion’s share of DV360 spend in Q1, however, accounting for 58% of advertiser investment in the platform. Desktop contributed another 20% of DV360 spend in Q1, while tablets accounted for just 5%.
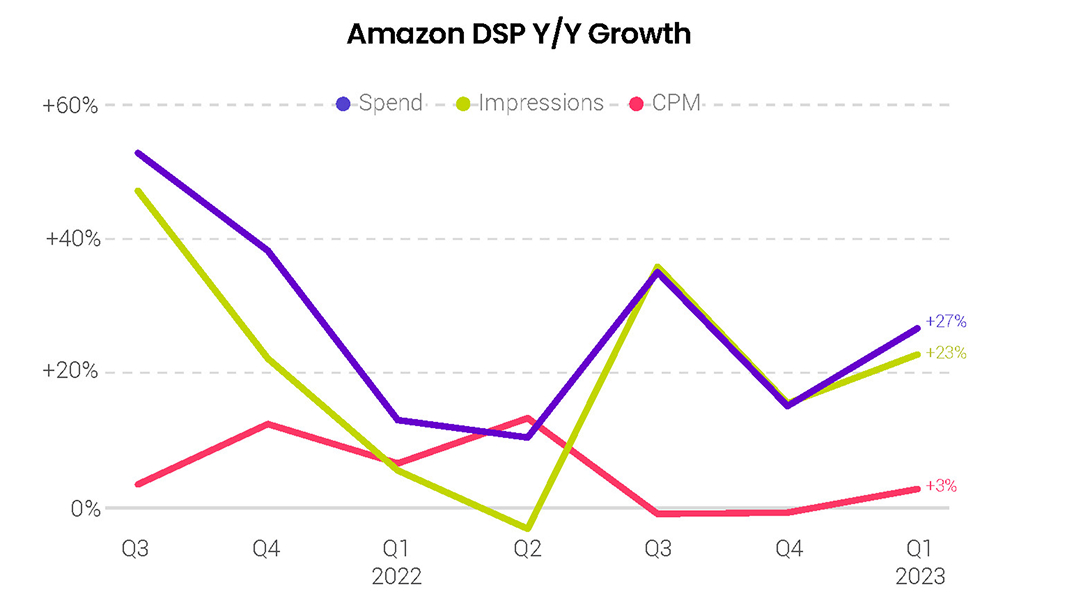
Spend growth for the Amazon demand-side platform (DSP) rebounded from 15% Y/Y in Q4 to 27% in Q1, as impression growth accelerated from 16% Y/Y to 23%. CPM growth has been modest over the last three quarters, rising 3% in Q1 after holding steady year over year in the f inal quarter of 2022. The share of DSP spend coming from Amazon owned-and-operated inventory, which carries a higher CPM than other inventory available through the DSP, rose slightly from Q4 to Q1.
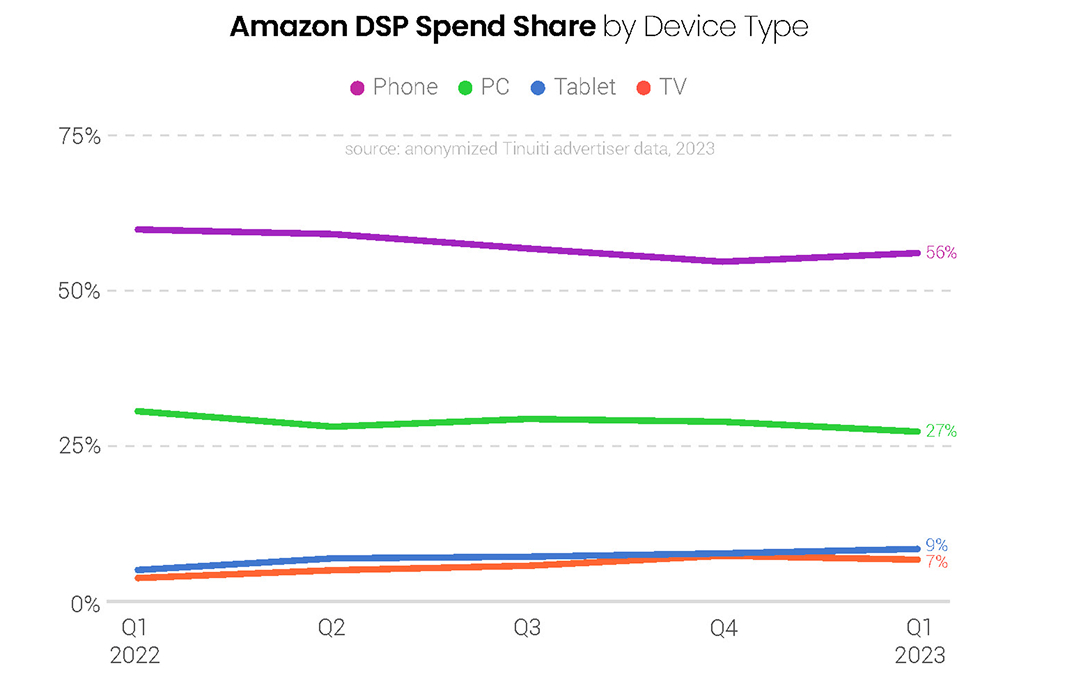
The share of Amazon DSP spend attributed to connected television was 7% in Q1 2023, up from just 3.7% in Q1 2022. Advertisers are increasingly taking advantage of video inventory and exploring ways to make it work for their brands, such as identifying relevant audiences based on Twitch activity and targeting those users while they’re watching streaming television. Both PC and phones saw their share of DSP spend dip year over year, as tablet devices rose from 5% in Q1 2022 to 9% in Q1 2023.
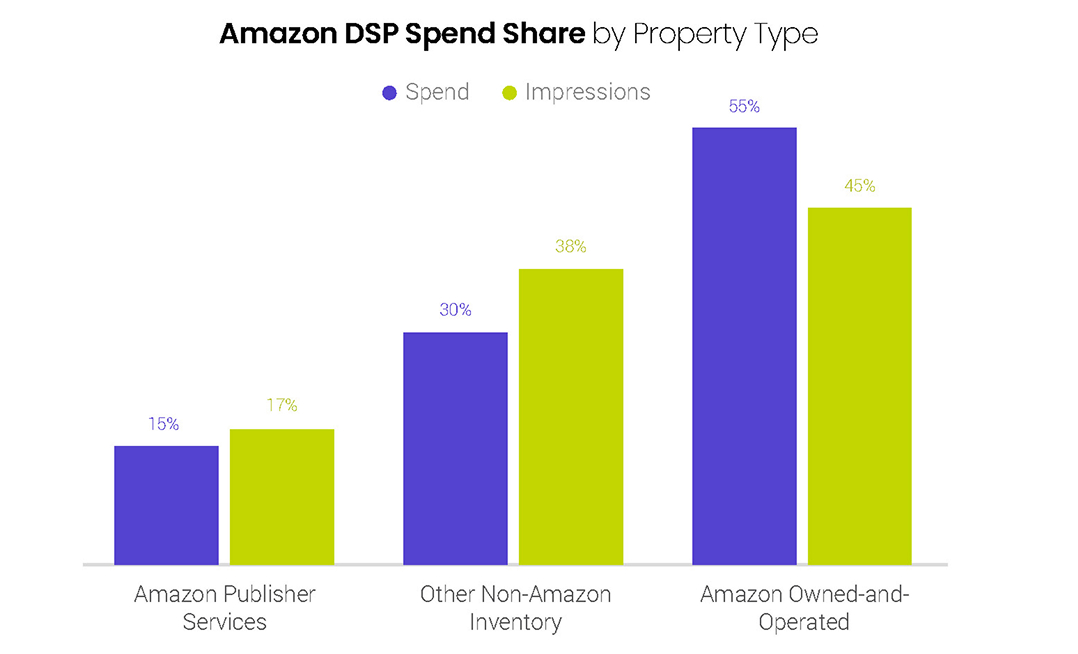
The share of total Amazon DSP spend attributed to Amazon owned-and-operated properties ticked up from 53% in Q4 2022 to 55% in Q1 2023. These properties accounted for 45% of all DSP ad impressions, as the CPM of owned-and-operated inventory outpaced that of both Amazon Publisher Services impressions as well as other non-Amazon inventory. The DSP is powerful for its ability to reach Amazon shoppers both on and off Amazon properties.
Check out our most recent Digital Ads Benchmark Report for more exclusive insights.
