Digital Ads Benchmark Report Q3 2023
Quarterly Trends Across Google, Meta, Amazon, and More
Quarterly Trends Across Google, Meta, Amazon, and More
The Tinuiti Digital Ads Benchmark Report is based on anonymized performance data from advertising programs under Tinuiti management, with annual digital ad spend under management totaling over $4 billion. Samples are restricted to those programs that have remained active and maintained a consistent strategy over the time periods studied. Unless otherwise noted, all figures are based on same-client growth. The trends and figures included are not meant to represent the official performance of any advertising platform or the experiences of every advertiser.
Note: The data below is from 2023. Head here to see our most recent report.
Tinuiti is the largest independent performance marketing firm across Streaming TV and the Triopoly of Google, Facebook, and Amazon, with $4 billion in digital media under management and over 1,000 employees.
After a sluggish end to 2022, the digital ad market has been heating back up over the course of 2023.
Across Google search, Facebook, Instagram, YouTube, and Amazon Sponsored Products, all but Instagram saw stronger spending growth in Q3 than in Q2. Instagram still managed to deliver the highest growth among those five segments in Q3, but it was coming off a particularly stellar Q2.

Meta’s largest ad platform, Facebook, saw the biggest acceleration in spending growth between Q2 and Q3 with a Q3 jump of 14 points from 2% Y/Y to 16%. Overall, Facebook is benefiting from newer inventory around Reels and its yearago comps were particularly weak in Q3. Among retailers, Meta’s machine learning-powered Advantage+ shopping campaigns are also having a major impact and already account for 23% of Meta investment, having only begun rolling out in August 2022.
Retailers advertising with Google are also seeing machine learning play heavily into their investment as over 90% of brands running shopping listings with Google now deploy Performance Max campaigns. Together with standard Shopping campaigns, PMax campaigns helped drive Google Shopping spend up 16% Y/Y in Q3, outpacing Google’s overall search spend growth rate of 13%.
While Google Shopping spending growth remains driven primarily by click gains, Google text ad spending was driven by CPC increases in Q3. Over the last three years, text ad CPC increases have been about double those for shopping listings. Though not necessarily at play over this time period, Google did admit in Q3 that it can tweak ad price minimums to increase revenues. Those minimum changes have historically had the biggest impact on brand text ad keywords.
Outside of search, Google is also seeing a rebound in growth for YouTube where advertisers that were active in 2022 and 2023 increased their investment by 11% in Q3, which was up from 9% growth a quarter earlier. Although it is still small, a growing share of Performance Max budgets is going to video, and Google is hoping to improve the monetization of YouTube Shorts as it migrates Discovery campaigns to Demand Gen campaigns this Q4.
After being the only one of these five segments to see a deceleration in growth in Q2, Amazon Sponsored Products saw a reversal in Q3, with spending rising 14% Y/Y, up from 8% a quarter earlier. Although Amazon announced in August that Sponsored Products could start showing on third-party apps and websites, that change did not roll out until the end of Q3 and has only generated very limited traffic since.
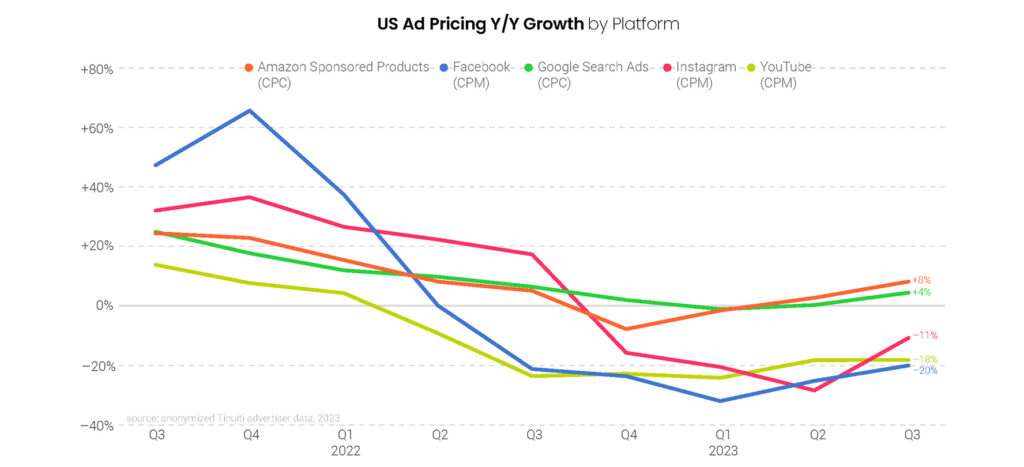
All of the largest platforms in this report saw an acceleration in pricing growth between Q2 and Q3, although the gains for YouTube were minimal. On average, the rate of CPC or CPM growth (depending on the channel) increased by seven points between Q2 and Q3. Even so, three of the five top platforms are still seeing year-over-year pricing declines.
Both of Meta’s largest properties continue to see CPMs running down in year-over-year terms, but they are also seeing the highest rates of volume growth. Newer inventory sources like that generated by Reels typically produce lower than average CPMs, at least initially. For Instagram, CPMs for Reels placements were 33% lower than Feed ads in Q3.
Google search ad CPCs were up 4% overall in Q3, with standard Shopping and Performance Max CPCs up 3% and text ad CPCs rising 8%. Both segments saw a five-point acceleration in CPC growth from Q2 to Q3. YouTube CPMs remained down 18% Y/Y, while other streaming video platforms saw a 1% increase in CPMs. Streaming CPMs are being bolstered as some of the premium platforms, which command higher ad prices, shift to the ad-supported model.
For Amazon Sponsored Products, CPCs increased 8% Y/Y in Q3 up from 3% growth in Q2. As one of the purest direct response digital ad formats, Sponsored Products CPCs typically trend very closely with sales per click. In Q3 though, CPC growth was a few points higher than sales per click growth, compared to sales per click growth running just 0.3% higher in Q2.
Spend on Meta properties rose 19% year over year in Q3, the strongest growth since Q4 2021 for Tinuiti advertisers. Impression growth remained strong at 46% in the third quarter, while CPM declined 19% compared to a 25% decline in Q2. Growth in Meta investment has been helped along by new inventory sources like Reels, as well as the growing adoption of Advantage+ shopping campaigns, which have produced strong performance for advertisers.

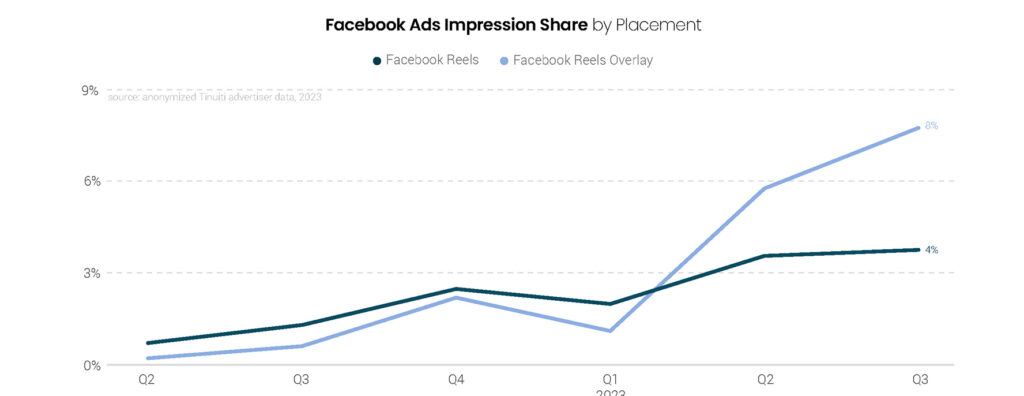
Facebook spend, excluding Instagram, Messenger and Audience Network, rose 16% year over year, a significant leap from the 2% growth observed in Q2 as year-ago comps got much easier in the third quarter. Impression growth surged to 46% in Q3, as newer inventory from Reels video and Reels overlay placements combined to account for 12% of all Facebook ad impressions in the third quarter. CPM declined 20% year over year, the smallest decline of the last five quarters.

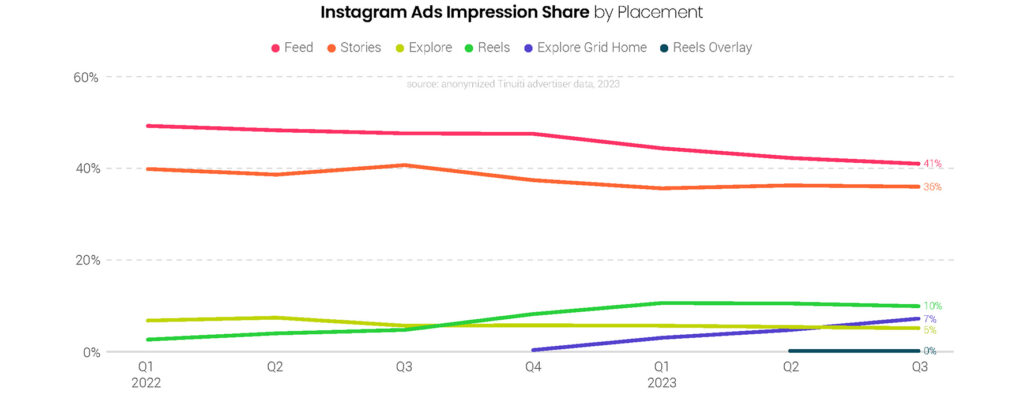
Instagram CPM declined more than 20% in each of the first two quarters of 2023, but fell just 11% in the third quarter. Impression growth slowed from the incredible 84% observed in Q2, but still remained strong at 41% in Q3. Instagram impressions have been bolstered not only by Reels inventory, but also by the Explore Grid Home placement, which rolled out in Q4 2022 and accounted for 7% of Instagram ad impressions in Q3 2023.

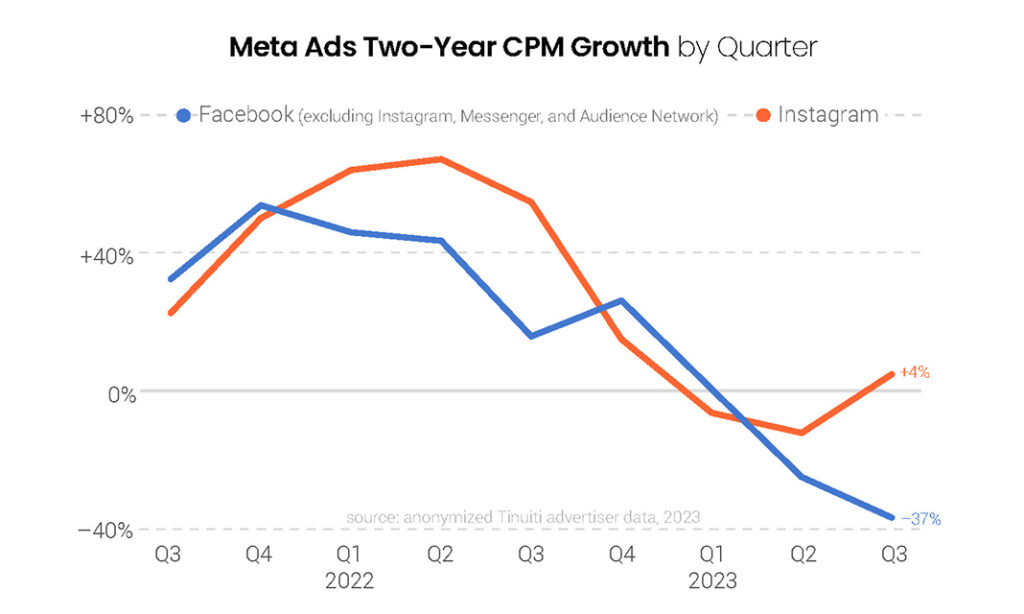
Facebook CPM dipped 37% in Q3 2023 compared to Q3 2021, as newer inventory sources like Reels and Reels overlay ads have contributed to softer ad pricing growth over the course of 2023. Instagram CPM rose 4% compared to two years before, an improvement from the 13% decline observed in Q2 2023 compared to Q2 2021. Brands haven’t seen positive two-year growth in ad pricing across both Facebook and Instagram since Q4 2022.
Instagram share of Meta Ads spend rose to 34% in Q3 2023, but Facebook continues to account for the lion’s share of all Meta ad dollars as it accounted for 66% of spend in the third quarter. The Audience Network, the Meta platform most impacted by Apple’s 2021 rollout of the App Tracking Transparency (ATT) prompt, continues to account for only a small share of total spend, as does Messenger.

Advertisers have seen strong performance out of Advantage+ shopping campaigns over the last year following the initial limited rollout of the campaign type in August 2022. Advantage+ shopping is a machine learning powered campaign type that brands can use to simplify audience management and allow Meta to optimize for performance. In Q3 2023, retail advertisers spent 23% of total Meta investment on Advantage+ shopping campaigns, up from 19% in Q2.

Explore grid home placements accounted for 7% of Instagram ad impressions in Q3, and have quickly become a meaningful part of the Instagram ad suite since launching in Q4 2022. The share of Instagram ad impressions coming from Reels video ads rose from 5% last Q3 to 10% in Q3 2023. Reels overlay ads were announced in Q2 2023 and accounted for just .04% of Instagram ad impressions in the third quarter, a figure that should rise meaningfully given the importance of Reels overlay ads on Facebook.
While Reels overlay ads were only just introduced to Instagram in Q2 2023, they’ve steadily grown in importance for Facebook over the last six quarters. In Q3, 8% of all Facebook ad impressions came from Reels overlay ads, double the 4% share that Reels video ads accounted for. Overlay ads are static image banners or image carousel ads that are shown at the bottom of Reels videos, or sticker ads that creators can place anywhere within Reels.
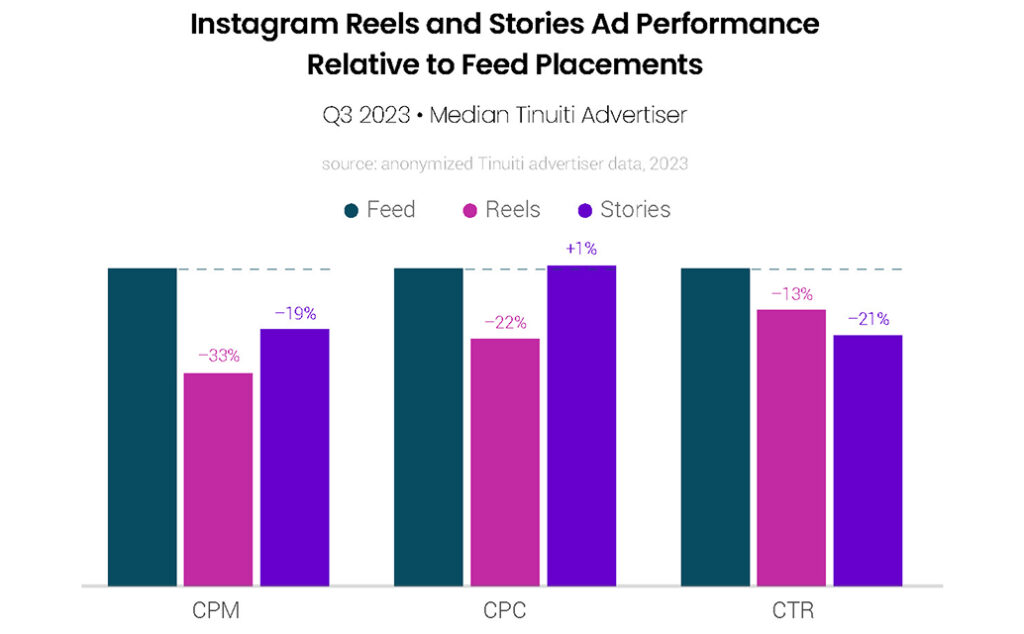
Instagram Reels CPM was 33% lower than that of Instagram Feed ads for the median advertiser in Q3 2023, while Stories CPM was 19% cheaper. However, Reels CPC was 22% lower than Feed ads, while Stories CPC was 1% higher, as the discount in CPM for Stories ads relative to Feeds ads is roughly in line with the click-through rate (CTR) difference between the two placements. Reels CPC should come more in line with Feed CPC as the placement matures over time.
TikTok spend rose 12% year over year in Q3 for the media advertiser, up from 11% growth in Q2, as brands continue to expand investment in the platform. This figure only includes brands active since at least Q2 2022, and TikTok continues to grow the total population of active advertisers over time. Impressions were up 21% year over year in the third quarter, while CPM dipped 8%, the second straight quarter of declining ad pricing.

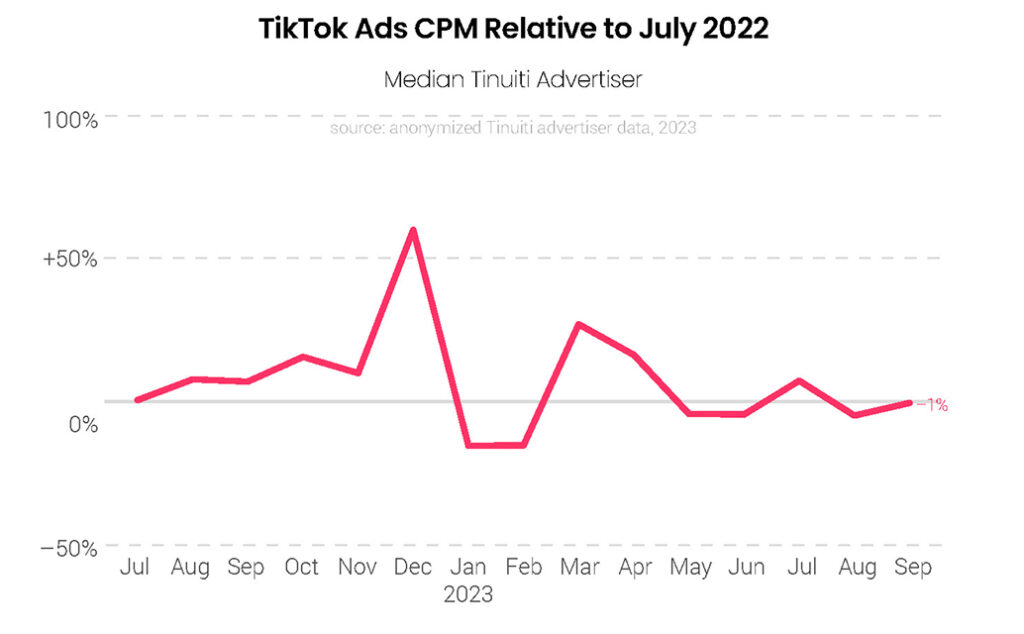
Last December, TikTok ad CPM soared to 61% higher than it was in July 2022, as brands ramped up competition during the holiday shopping season. CPM was down year over year in Q3, and most advertisers saw pricing stay relatively stable from the beginning of the quarter to the end. As the end of the year approaches, brands should likely expect a similar rise in CPM to close out the fourth quarter.
Spending growth for US Google search and Shopping ads accelerated for the second quarter in a row, reaching 13% Y/Y in Q3 2023. While click growth slowed from 11% Y/Y in Q2 to 8% Y/Y in Q3, CPC growth increased four points over the same period. Google paid search click growth has remained relatively steady since late 2021, and it’s on the pricing side where Google has seen bigger swings. After bottoming out at a 1% Y/Y decline in Q1 2023, CPCs are now back on the rise.

While desktop did see an 8% Y/Y increase in spending for Google search ads, that was driven primarily by a 6% Y/Y increase in CPCs. Tablets drive a small share of Google paid search clicks in 2023, but they too saw relatively high CPC growth driving spending gains. Phones were a bright spot for cost-conscious advertisers with Google phone search ad clicks up 11% Y/Y on just a 5% increase in CPCs.

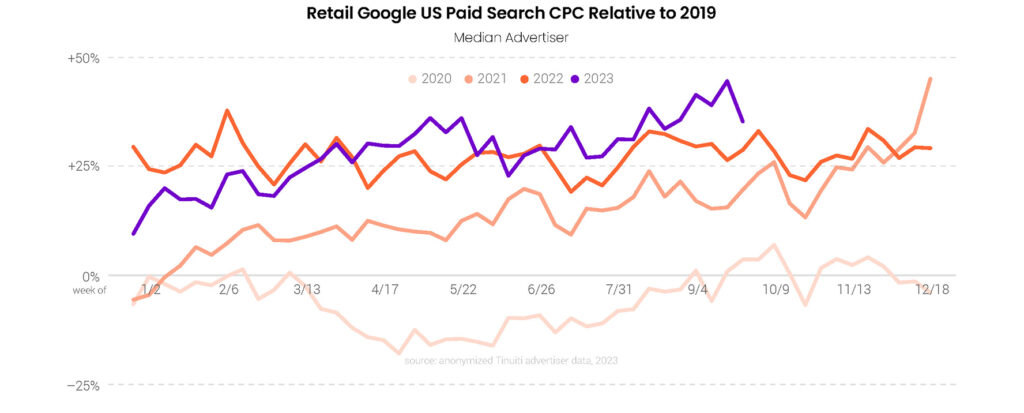
Except for a dip to close out the quarter, retailers’ Google search CPC growth generally strengthened throughout Q3. Compared to 2019, retailer CPCs were up 35% in Q3 2023, up from 30% in Q2 2023, as well as up from a 27% increase over 2019 in Q3 2022. Over this historical view, CPCs were up by 25-30% versus 2019 consistently throughout 2022 before getting off to a weaker start to 2023. By the end of Q3 2023, however, retailer CPCs were up by as much as 45% compared to pre-pandemic levels.
The average value of retail orders generated by Google search ads rose just 1.4% Y/Y in Q3 2023, but that did mark an improvement over the 0.4% Y/Y AOV growth retailers saw in Q2. While official measures show US inflation peaked in June 2022, search AOV growth peaked just over a year earlier as it rebounded against weak early pandemic results. Although search AOV growth has been decelerating longer than inflation in general, it also hit a much higher peak to begin with.

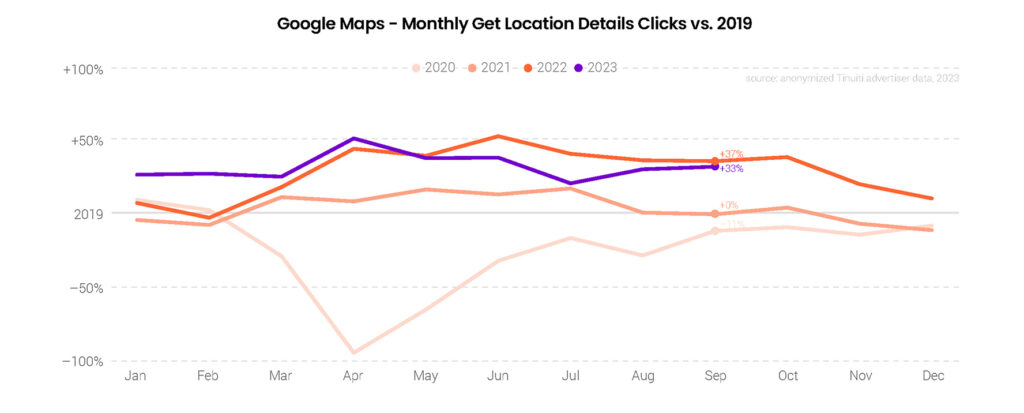
While brands with a brick-and-mortar presence saw a big jump in interest in those physical locations in 2022, growth in Get Location Details clicks has stalled out in mid-2023. Produced by Google Maps, Get Location Details clicks were 33% above 2019 levels in September 2023, but that was down from a 37% increase in September 2022. Though it’s not a perfect proxy, a slowdown in Get Location Detail clicks directionally aligns with slower growth in brick-and-mortar retail sales after a strong rebound in 2021 and 2022.
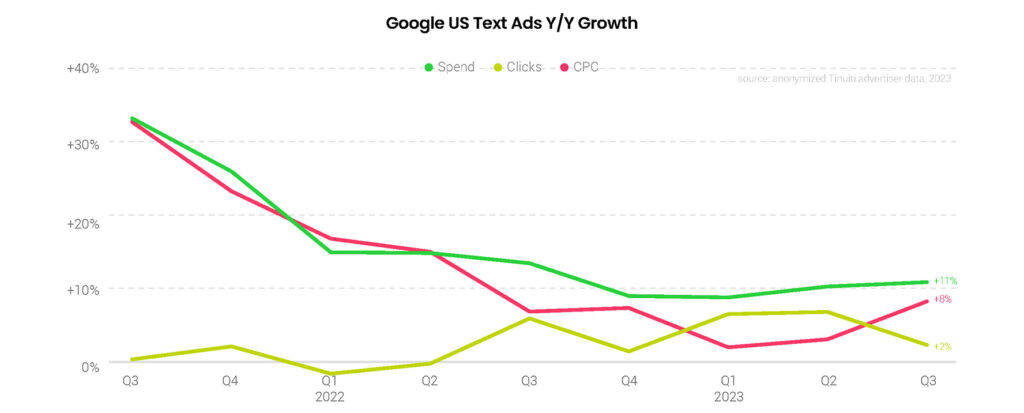
Advertiser spending on Google text ads was up 11% Y/Y in Q3 2023, up a point from a quarter earlier. Text ad click growth slowed from 7% Y/Y in Q2 to 2% Y/Y in Q3, while CPC growth accelerated from 3% Y/Y in Q2 to 8% Y/Y in Q3. This was the thirteenth quarter in a row that Google’s text ad CPC growth has outpaced its Shopping ad CPC growth.
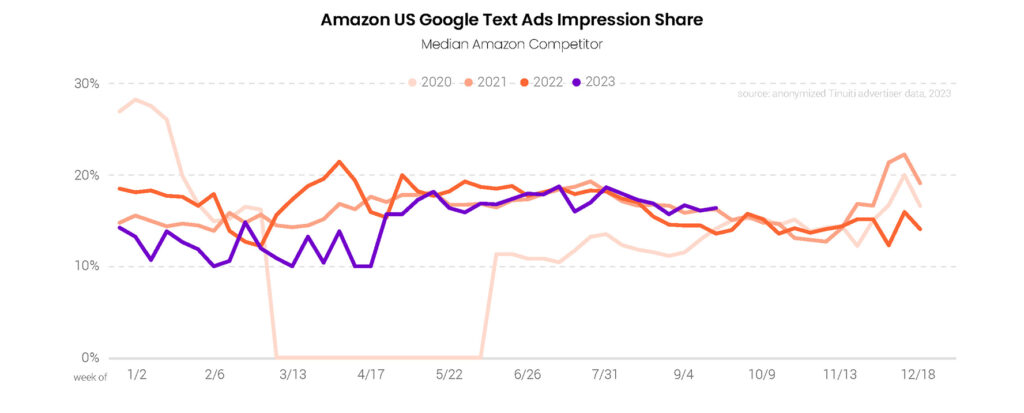
After a relatively weak showing to start 2023, Amazon’s share of Google text ad impressions jumped in mid-May and has since trended very closely in line with where it stood in 2021 and 2022. By this measure, however, Amazon’s presence in Google text ads auctions remains well below its pre-pandemic level. To the extent that a single advertiser, even perhaps the largest one, can drive CPC trends for Google text ads, the rest of the market has been seeing less pressure from Amazon in recent years.
Spending growth for Google Shopping and Performance Max campaigns accelerated to 16% Y/Y in Q3 2023, up from 11% in Q2. Shopping ad click growth slowed a point to 12% Y/Y, but CPC growth rose from a 2% Y/Y decline in Q2 to a 3% Y/Y increase in Q3. Most advertisers currently running PMax campaigns transitioned to them from Smart Shopping campaigns in mid-Q3 2022, so quarterly year-over-year comparisons for PMax alone will be more meaningful going forward.

Helping to drive the acceleration in Shopping and Performance Max combined spending growth was an uptick in the cost contribution to PMax from non-shopping formats. Video inventory across YouTube and display sources generated 5% of PMax costs to close out Q3, up from an average of 2% in Q2. Other non-shopping inventory, including search and display ads produced 20% of PMax spending by the end of Q3, up from 16% in Q2.

As PMax advertisers are seeing a larger contribution from non-shopping inventory like video and display, they are also seeing a growing gap in some key performance metrics between PMax and standard Google Shopping campaigns. In Q2 2023, PMax campaigns produced conversion rates 14% lower the standard Shopping and an average sales per click that was 9% lower. In Q3, those gaps increased to 22% and 14%, respectively. On the positive side, due to lower CPCs for PMax, advertisers have been able to maintain a similar ROAS across PMax and standard Shopping.

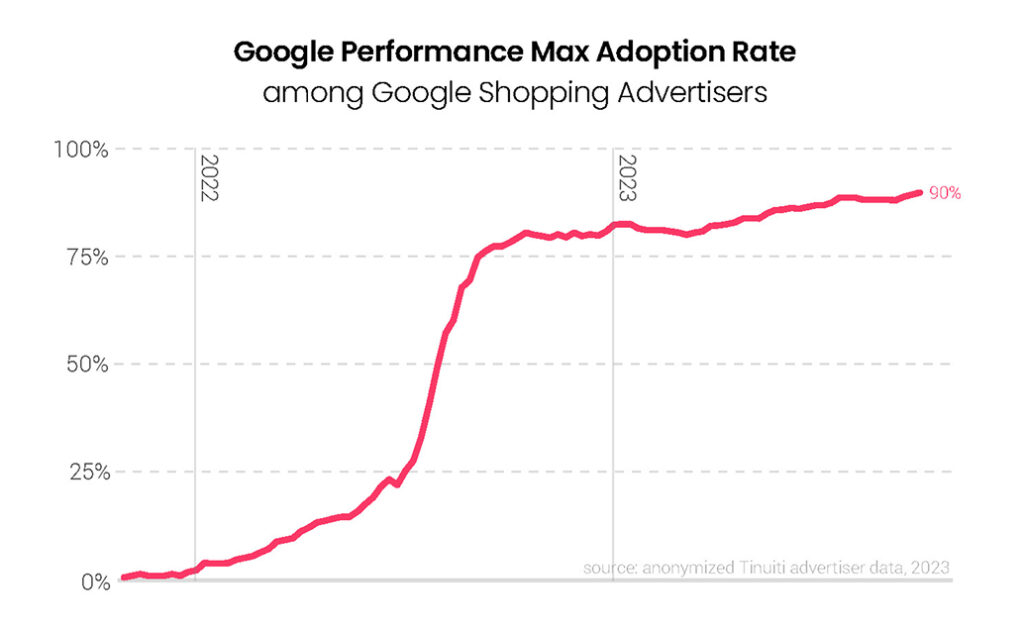
Already high adoption rates for Performance Max campaigns continued to rise in Q3 2023. By the end of the quarter, just over 90% of brands running shopping listings with Google employed PMax campaigns in the mix. For comparison, about 75% of Shopping advertisers had adopted Smart Shopping campaigns before Google transitioned them to the PMax model in Q3 2022.
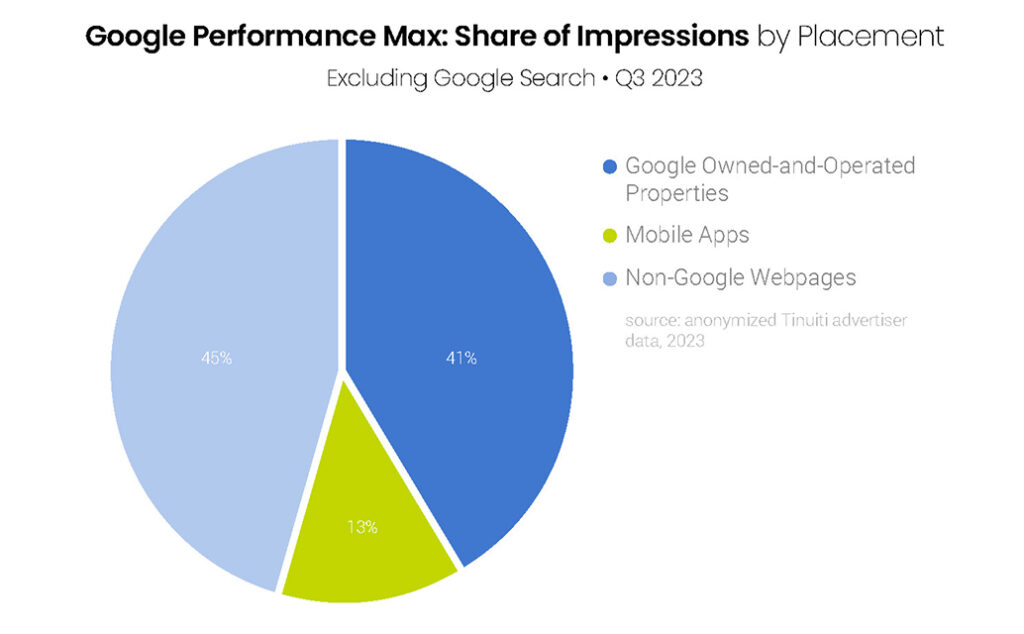
For Performance Max impressions generated outside of search, other Google owned-and-operated properties accounted for 41% of impressions. This was a slightly higher rate than in Q2, when Google O&O produced 39% of non-search PMax impressions. Mobile apps accounted for 13% of PMax placement impressions in Q3, down from 16% in Q2, while the share of impressions produced by non-Google webpages remained at 45%.
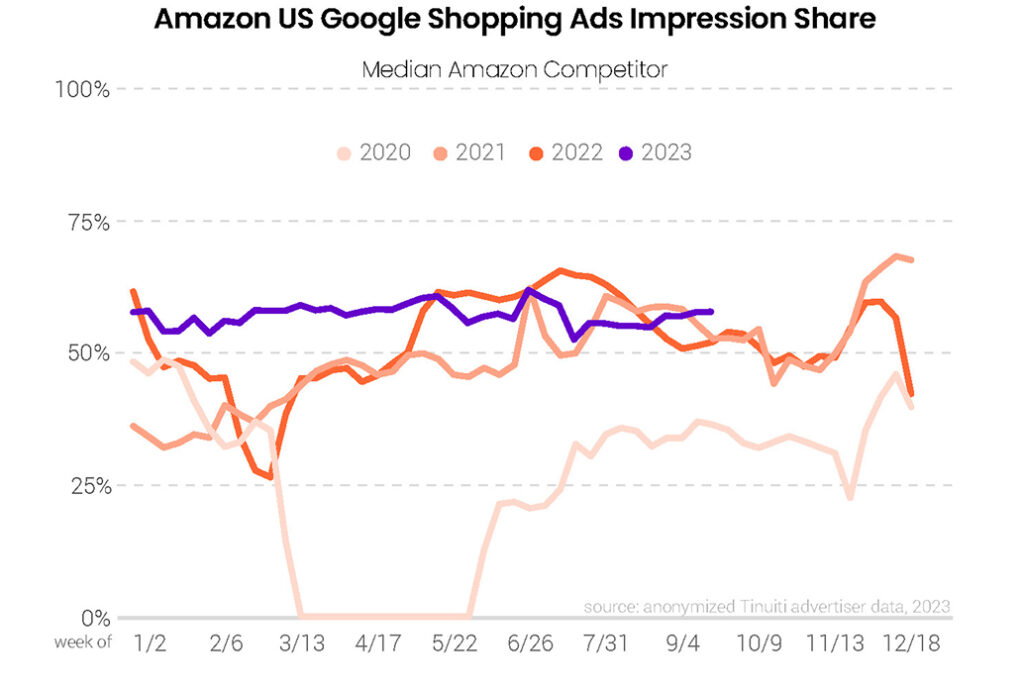
While Amazon’s share of Google Shopping impressions started off hot in 2023, it’s run closer to 2021 and 2022 levels since midMay. Amazon ramped up its presence in Shopping auctions from Q1 to Q3 in both 2021 and 2022, but its presence has been fairly steady for the first three quarters of 2023. Historically, Amazon has tended to see a dip in impression share in early Q4 followed by a spike during some of the busiest shopping weeks of the year.
In Q3 2023, over 80% of Google Shopping advertisers saw Temu listed as a competitor for impressions in Google’s auction insights report. That rate puts Temu in the same tier as some of the biggest advertisers in the business, including eBay and Walmart. Just a year earlier, Temu was nowhere to be found in Google’s auction reports. Instead, it appears Temu ramped up it’s investment in Google Shopping ads beginning in Q4 2022. Since June 2023, Temu has consistently appeared as a Shopping competitor for more brands than Walmart.

Although Temu nearly matches Amazon in the share of brands that run up against it in Google Shopping auctions, it has a ways to go to catch up with the average share of impressions Amazon actually receives. The typical Amazon competitor saw Amazon hit a 56% impression share in Google Shopping auctions in Q3 2023. Temu’s average impression share was much lower at 23%. Still, that rate was good enough to match Walmart and even outpace eBay.

Spend for Amazon’s primary campaign type rose 14% year over year in Q3, an acceleration from the 8% observed in Q2 as CPC growth jumped from 3% in the second quarter to 8% in Q3. Amazon announced in August that Sponsored Products reach would extend to third-party apps and websites such as Pinterest and Buzzfeed, but the update wasn’t rolled out until the end of September. Since the rollout, advertisers have seen very limited traffic from these new sources, such that Q4 performance is unlikely to be materially affected.

Amazon advertisers increased investment in Sponsored Brands by 1% year over year in Q3, the first quarter since Q4 2022 that spend on the format increased. Clicks declined 1% in Q3 2023, the same decline observed in Q2, but CPC rebounded from a 2% decline in Q2 to 2% growth in Q3. Sales attributed to the format rose 4% year over year, the first time since Q3 2022 that sales growth outpaced spend growth.

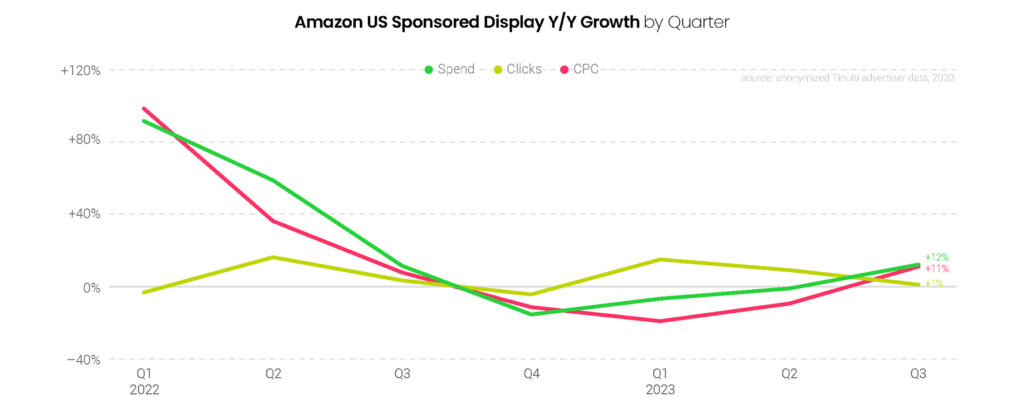
After three straight quarters of declines, Amazon Sponsored Display spend rose 12% year over year in Q3 as CPC rebounded from a 10% decline in Q2 to an 11% increase in the third quarter. Year-ago comparisons got much softer in the third quarter, particularly for pricing as CPC growth slowed from 36% Y/Y in Q2 2022 to 8% Y/Y in Q3 2022. While the figures in this report are based on endemic brands, as of late 2022 businesses in industries like hospitality and home services that don’t sell in the Amazon store can also use Sponsored Display to advertise in the US.
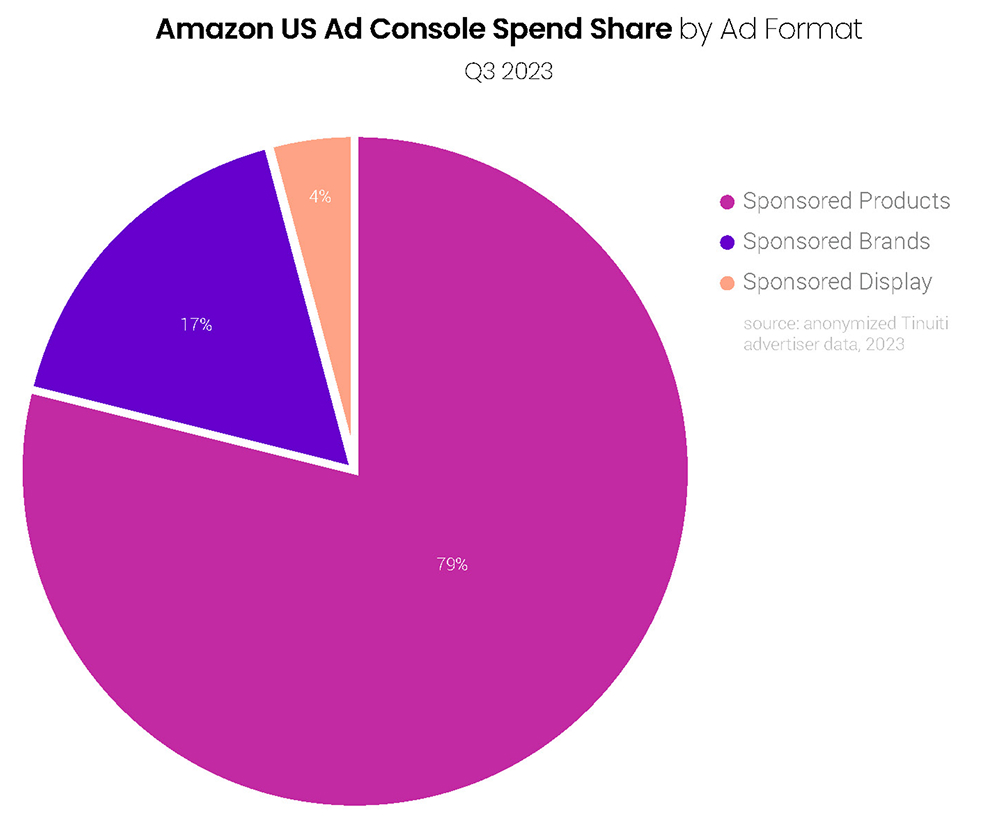
While spend for both Amazon Sponsored Brands and Sponsored Display rebounded to positive territory in Q3, advertisers continued to focus Ad Console investment on Sponsored Products, which accounted for 79% of all spend. Sponsored Brands accounted for 17%, while 4% went to Sponsored Display campaigns. Though it’s unlikely to have a meaningful impact in the near term, the Q3 expansion of Sponsored Products to third-party apps and sites could help bolster the format’s share in the long run.
In September, Sponsored Products CPC was up 6% year over year while Sponsored Brands CPC was up 1%, as advertisers across a variety of product categories are seeing stronger pricing than last year heading into Q4. Looking at the 48-hour Prime Day event in July, both Sponsored Products and Sponsored Brands CPCs rose 9% compared to last year’s event, even stronger than the growth observed for these formats over the full quarter.

Among the thirteen product categories studied for this report, ten saw stronger CPC growth in Q3 than in Q2, as pricing is once again on the rise for most Sponsored Products advertisers. Automotive and powersports brands saw the biggest increase year over year with a 21% jump, followed by home and garden advertisers at 20%. The biggest decline in CPC was just 2% for tools and home improvement brands.

Advertisers increased investment in Walmart Sponsored Products campaigns 55% Y/Y in the third quarter, a significant leap from the 39% growth observed in Q2, and spend growth has now accelerated in each of the last three quarters. Click growth slowed from 45% in Q2 to 17% in Q3, but CPC growth jumped from a 4% decline to a 33% increase as advertisers lapped the first full year-ago quarter in which Walmart Sponsored Products used a second-price auction.
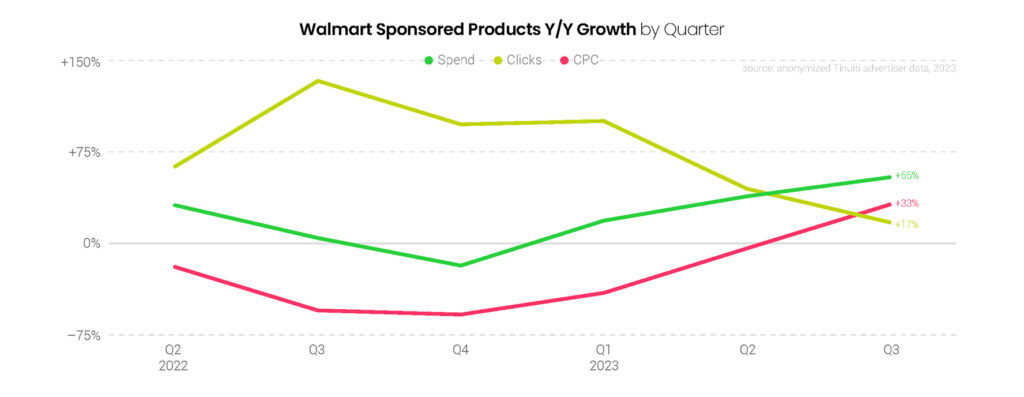
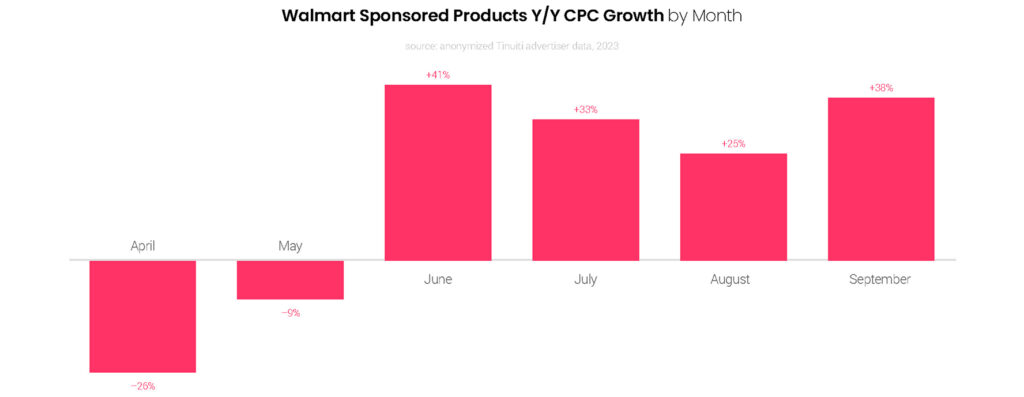
Walmart’s Q2 2022 change to update ad auctions from first price to second price sent its Sponsored Products CPC down meaningfully, and in Q3 2022 advertisers saw a 55% year-over-year decline. The change meant that advertisers now only pay just enough to beat the advertiser directly below them in ad auctions, compared to previously paying the full bid placed. CPC is now growing at a strong clip as advertisers lap the early days of the update, and rose by at least 25% year over year in all three months of Q3.
Sponsored Videos campaigns were released out of Beta in Q3 after months of testing, and accounted for 0.5% of all Walmart Sponsored Search spend in the third quarter. Sponsored Products continued to account for the lion’s share of Walmart search spend in Q3, with 94% of investment going to the format. Sponsored Brands spend share in the third quarter stood at 6%.

Walmart search advertisers saw 74% of ad clicks come from the app in Q3, up from 66% in Q3 2022 and 48% in Q3 2021. Both desktop and mobile web click share have declined over the last two years, as it appears that the app is increasingly how Walmart shoppers search for products. While desktops accounted for just 9% of clicks, these devices accounted for 13% of sales attributed to search ads and outpaced both mobile web and app traffic in sales per click.

For YouTube advertisers that were active in both quarters, spending rose 11% Y/Y from Q3 2022 to Q3 2023. YouTube spending growth has now accelerated for three quarters in a row following a sharp slowdown over 2022. YouTube impression growth has remained strong over the last two years, but average CPM has been down year over year since Q2 2022. In Q3 2023, YouTube CPMs fell 18% Y/Y, but that marks an improvement over a 24% decline to start the year.

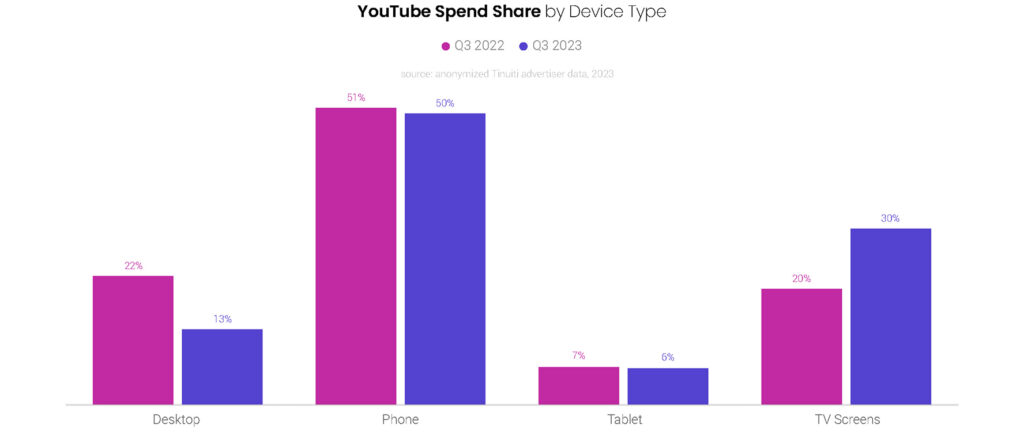
Televisions accounted for 30% of YouTube ad spending in Q3 2023, up from 20% a year earlier. While phone and tablet share of YouTube spending were down slightly compared to Q3 2022, most of the gains for TV screens came at the expense of desktop. Desktop’s share of YouTube spending fell from 22% in Q3 2022 to 13% in Q3 2023. Desktop spending fell 35% Y/Y in Q3 2023, while TV spending rose 69%.
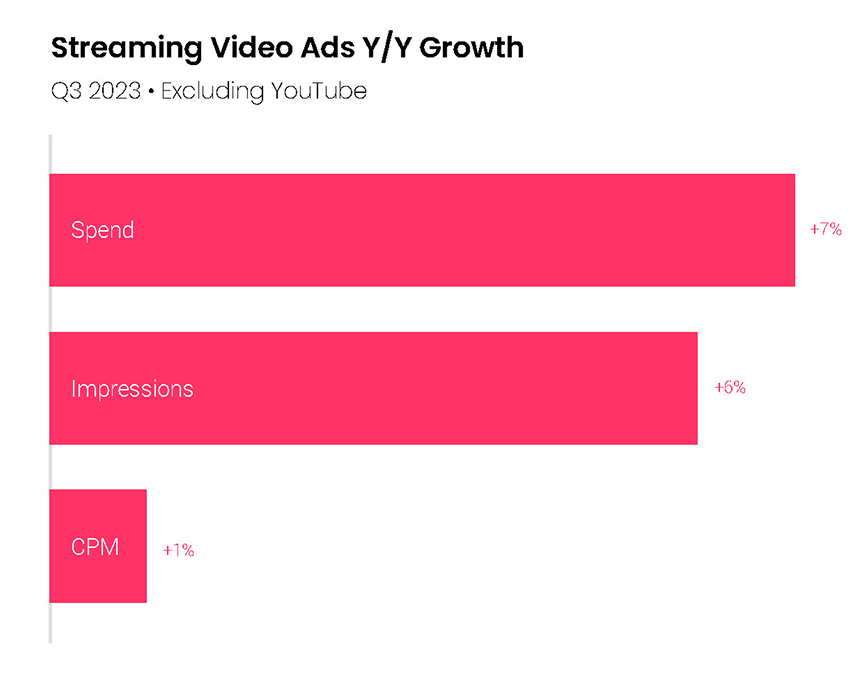
Same-site spending on streaming video platforms outside of YouTube rose 7% Y/Y in Q3 2023, a slight acceleration from 6% growth in Q2. Like most digital ad channels, streaming video saw weaker spending growth in the back half of 2022, but has since generated stronger investment growth. With a 1% Y/Y gain in Q3, streaming CPMs have held up better than those for YouTube, but YouTube has seen stronger impression growth.
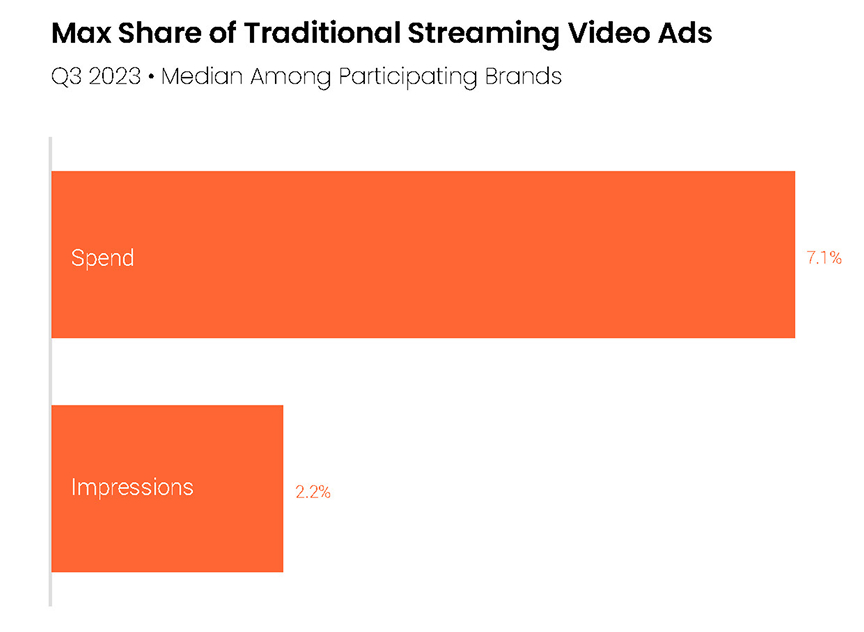
Compared to other traditional streaming ad buys, Warner Bros. Discovery’s newly merged Max platform commanded relatively strong CPMs in Q3 2023. Among brands advertising on Max, the platform produced 2.2% of traditional streaming video ad impressions in Q3, but accounted for 7.1% of spending. HBO Max enjoyed similarly strong CPMs prior to its merger with Discovery+.
While Netflix described its advertising business as “still nascent” in July 2023, its Standard with Ads offering does generate a higher average revenue per user for Netflix than its other plans and advertisers have been willing to pay a premium for Netflix inventory. In Q3 2023, Netflix CPMs were about two and a half times the average for other traditional streaming buys. As more top streaming platforms are shifting to ad-supported tiers, it is helping to keep streaming CPM growth in positive territory.

Mobile devices accounted for 51% of spending on streaming video ads purchased through real-time bidding in Q3 2023. TVs generated 28% of RTB streaming spend, while desktop produced 21%. For traditionally-purchased ads, televisions accounted for 54% of spending, while phones and tablets produced 35% and desktop produced 11%.

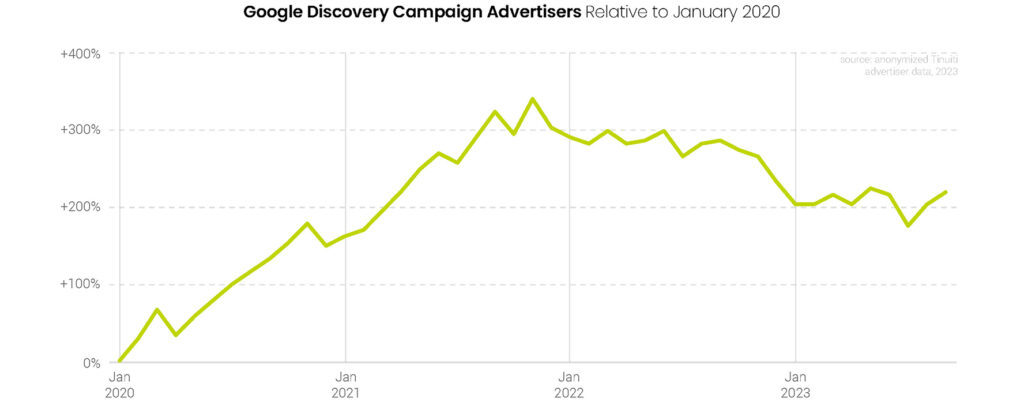
After peaking during the 2021 holiday shopping season, adoption rates for Google Discovery campaigns dropped over 2022 and have generally run flat over 2023 even as spending growth for the digital ad market has strengthened. Looking to reinvigorate this segment of the market, Google will replace Discovery campaigns with Demand Gen campaigns beginning in October 2023. Demand Gen campaigns will have more bidding options and draw on additional inventory sources including YouTube Shorts.
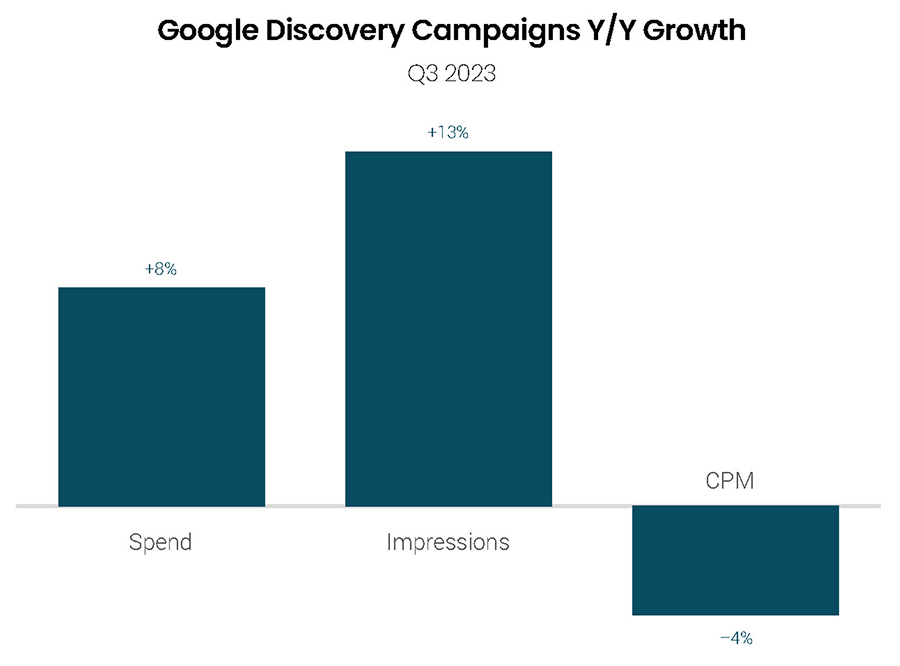
For brands that have remained active with Google Discovery campaigns this year and last, spending growth for the format was solid at 8% Y/Y in Q3 2023, up from 6% Y/Y in Q2. Discovery campaign impressions rose 13% Y/Y in Q3, down from 15% growth in Q2, but as seen across most digital ad channels in Q3, pricing growth was stronger for Discovery campaigns in Q3 than in Q2. While Discovery CPMs were still down 4% Y/Y in Q3, that was up from an 8% decline in Q2.
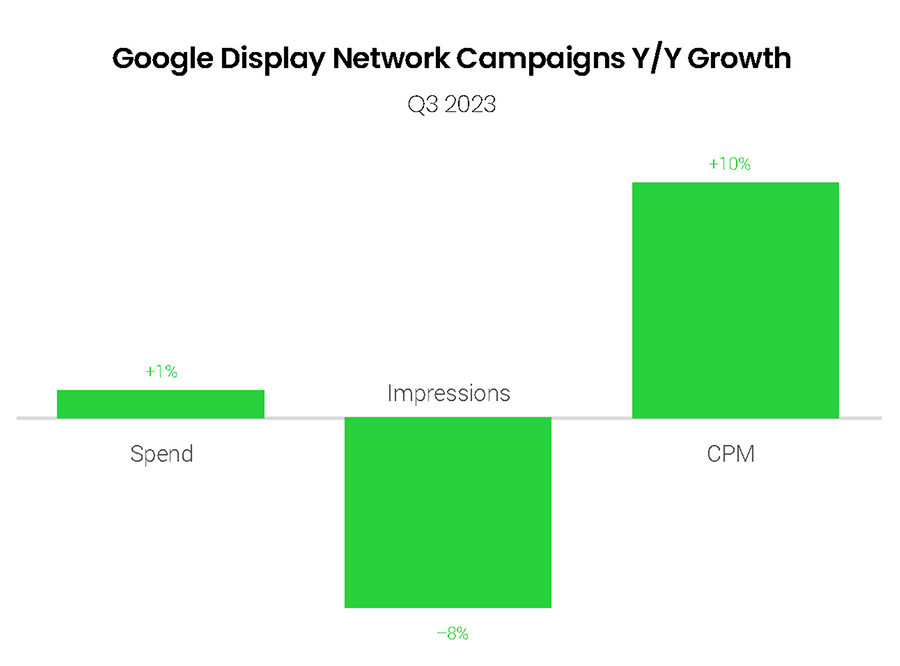
Spending growth for ads on the Google Display Network was 1% Y/Y in Q3 2023. GDN impressions were down 8% Y/Y in Q3, while average CPM rose 10%. Average CPM on the GDN fell by as much as 5% in the first quarter of 2023 after a sharp deceleration in growth over 2022. GDN CPMs have now accelerated for two quarters in a row against those weaker year-ago comps.
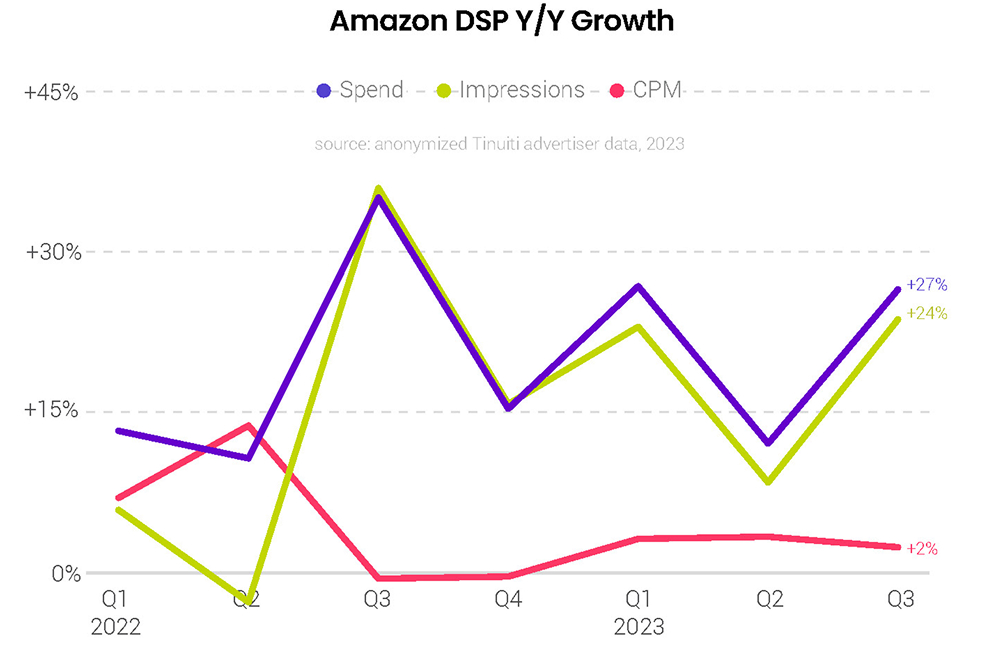
Advertisers ramped up Amazon DSP investment 27% Y/Y in Q3, rebounding from 12% in Q2 and returning to the pace of growth observed in the first quarter of the year. Impressions rose 24% year over year, triple the growth observed in Q2. Average CPM rose just 2% Y/Y as Amazon DSP advertisers have seen only modest increases in pricing in each of the first three quarters of 2023.
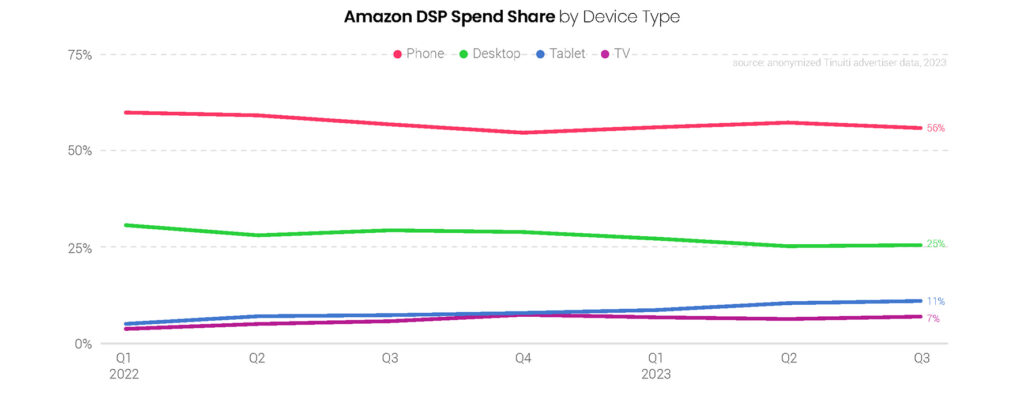
Phones continue to account for a majority of Amazon DSP spend, but the share of investment attributed to phones slipped from 57% in Q3 2022 to 56% in Q3 2023, while PC share slipped from 30% to 25%. Tablets rose from 7% of spend last Q3 to 11% this Q3, while televisions edged up from 6% to 7%. Video is steadily becoming a more important part of Amazon DSP advertising, helping to boost television share.
Amazon DSP advertisers spent 47% of ad spend on Amazon owned-and-operated (O&O) properties in the third quarter, but just 37% of impressions came from these properties as the cost of Amazon inventory outpaces placements on other sites. Amazon Publisher Services inventory accounted for 20% of Q3 Amazon DSP spend, with the remaining 33% of spend coming from other non-Amazon inventory.

Check out our most recent Digital Ads Benchmark Report for more exclusive insights.
