Digital Ads Benchmark Report Q4 2024
Quarterly Trends Across Google, Meta, Amazon, and More
Quarterly Trends Across Google, Meta, Amazon, and More
The Tinuiti Digital Ads Benchmark Report is based on anonymized performance data from advertising programs under Tinuiti management, with annual digital ad spend under management totaling over $4 billion. Samples are restricted to those programs that have remained active and maintained a consistent strategy over the time periods studied. Unless otherwise noted, all figures are based on same-client growth. The trends and figures included are not meant to represent the official performance of any advertising platform or the experiences of every advertiser.
Note: The data below is from 2024. Head here to see our most recent report.
Tinuiti is the largest independent performance marketing firm across Streaming TV and the Triopoly of Google, Facebook, and Amazon, with $4 billion in digital media under management and over 1,000 employees.
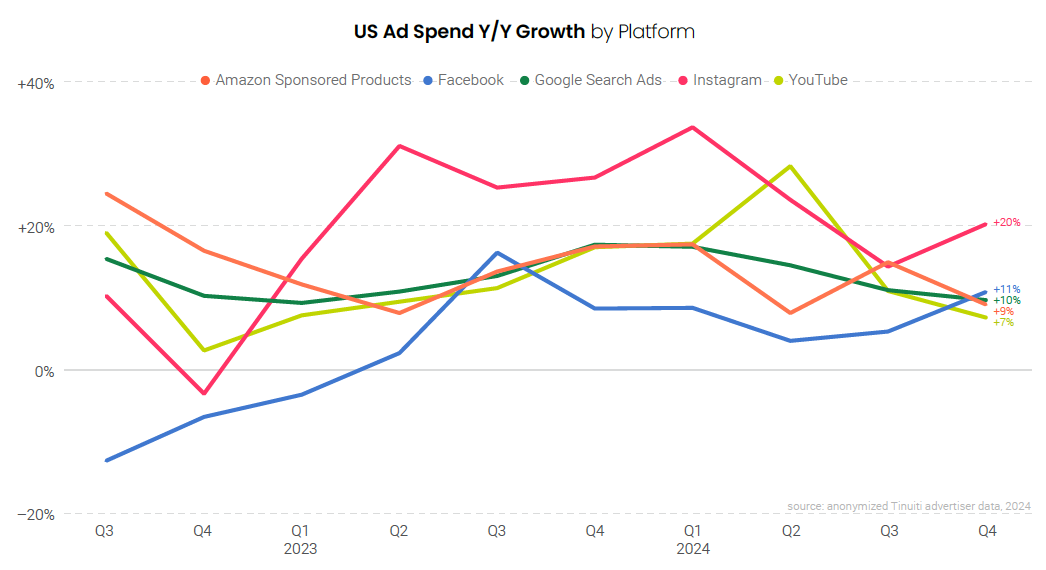
Spend growth for Meta-owned properties Facebook and Instagram picked up steam in the fourth quarter, and Meta overall grew 15% year over year, up from 9% growth in Q3. While other major platforms and formats like Google paid search, Amazon Sponsored Products, and YouTube ran into tougher year-ago comparisons in the final quarter of 2024, Meta growth slowed down in Q4 2023 such that comps were softer.
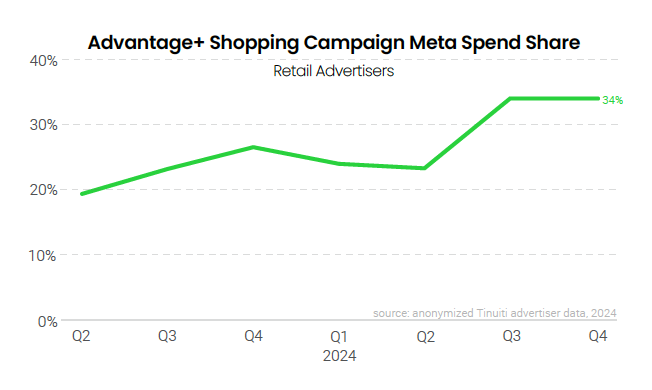
In addition to softer year-ago comparisons, Meta’s Q4 growth was helped along by the continued growth of Reels inventory, which hit an all-time high impression share for Facebook, while also seeing meaningfully higher share compared to last Q4 for Instagram. Advantage+ shopping campaigns also rose in importance year over year, growing from 27% of retail/ecommerce advertiser spend in Q4 2023 to 34% in Q4 2024 and helping brands to effectively convert Meta platform users into customers.
YouTube spend growth slowed from 11% in Q3 to 7% in Q4, as the cost of ad impressions on the platform fell 16% year over year. Viewers are increasingly consuming YouTube content via connected TV, which accounted for 39% of all YouTube ad spend in Q4 2024, up from just 26% a year prior. YouTube ad spending on TVs was up a whopping 60% year over year.
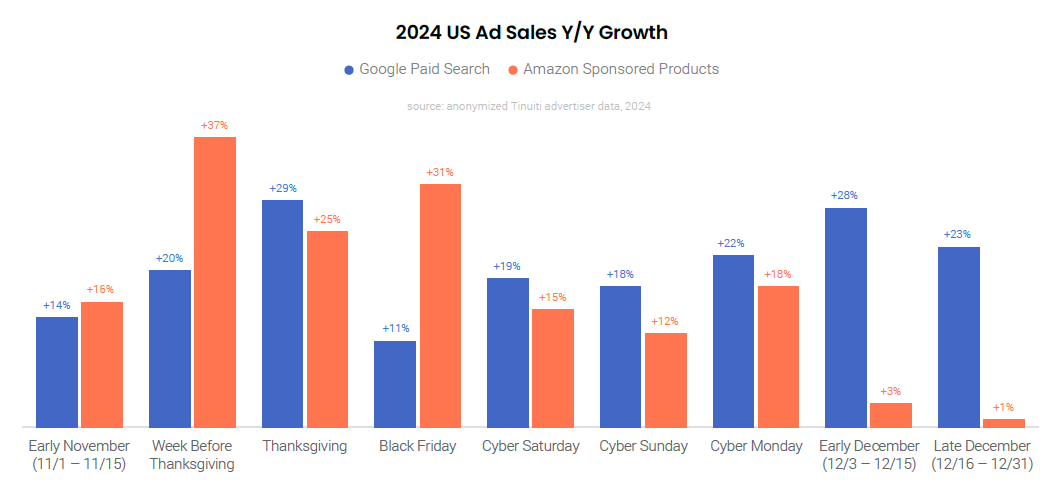
For both Google search and Amazon advertisers, growth slowed in line with expectations as a result of tougher year-ago comparisons, but the quarter was not without its wrinkles. A shortened holiday shopping season created by the latest Thanksgiving date since 2019 shifted key promotional days like Black Friday and Cyber Monday later into the calendar year.
For Amazon, which kicked off its holiday promotional messaging well in advance of Thanksgiving, this meant that sales for advertisers were pulled ahead of Turkey Day, with the week before Thanksgiving seeing a 37% jump in sales attributed to Sponsored Products. Growth was also strong for Google search sales, which grew 20% year over year in the week leading up to Thanksgiving.
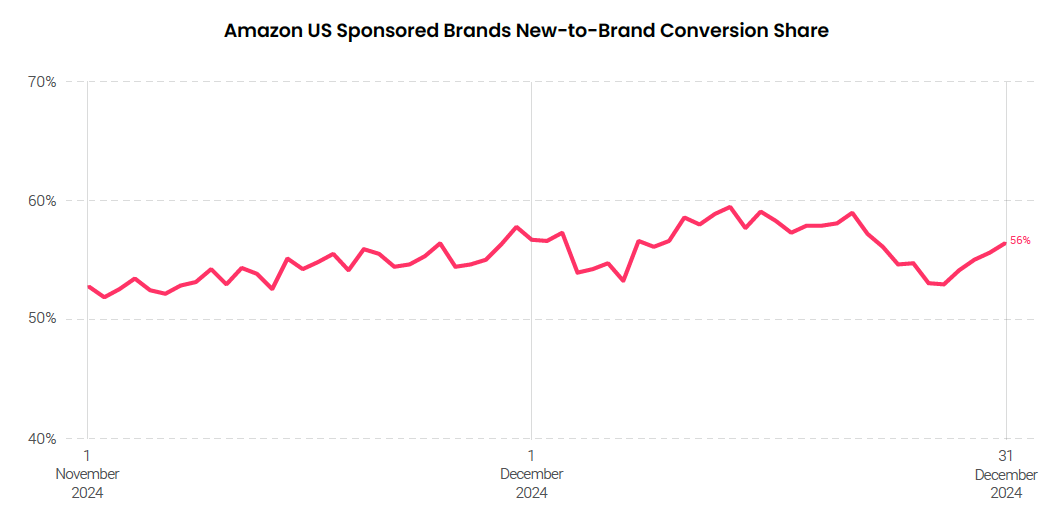
Amazon sales growth slowed in December, but advertisers were more likely to find new-to-brand customers later in the holiday season. These customers, defined by Amazon as shoppers that have not purchased from advertisers in the last twelve months, accounted for the greatest share of Sponsored Brands conversions in the final days before orders could no longer be delivered in time for Christmas. This is a trend regularly observed in the final days of holiday shopping as shoppers increasingly purchase from new brands when time is running out.
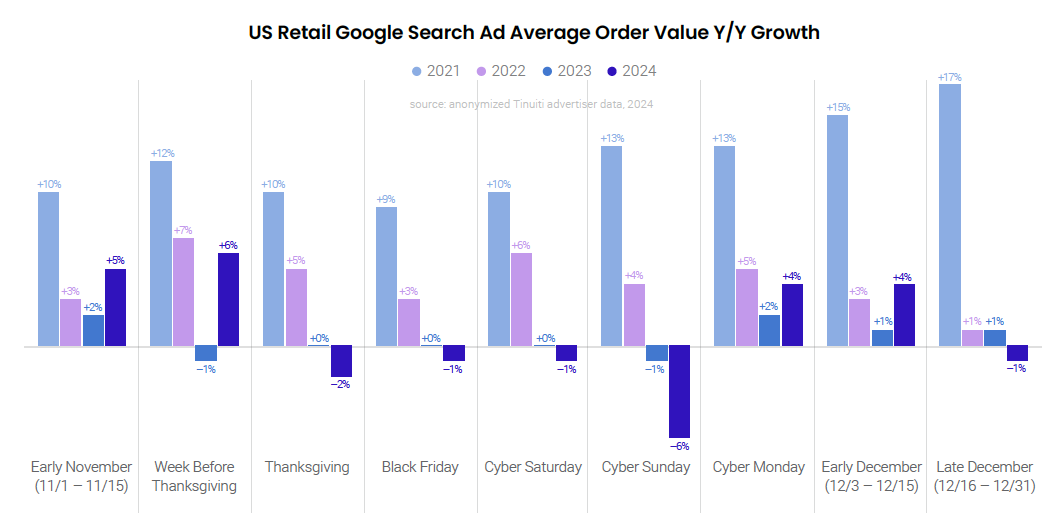
Sales growth was strong for Google search advertisers throughout Q4 despite average order value growing just 1% on average throughout November and December, as inflationary effects on holiday shopping AOV have been modest in each of the last two years. Back in 2021, AOV increased more than 10% year over year throughout much of the holiday shopping season as product prices soared.
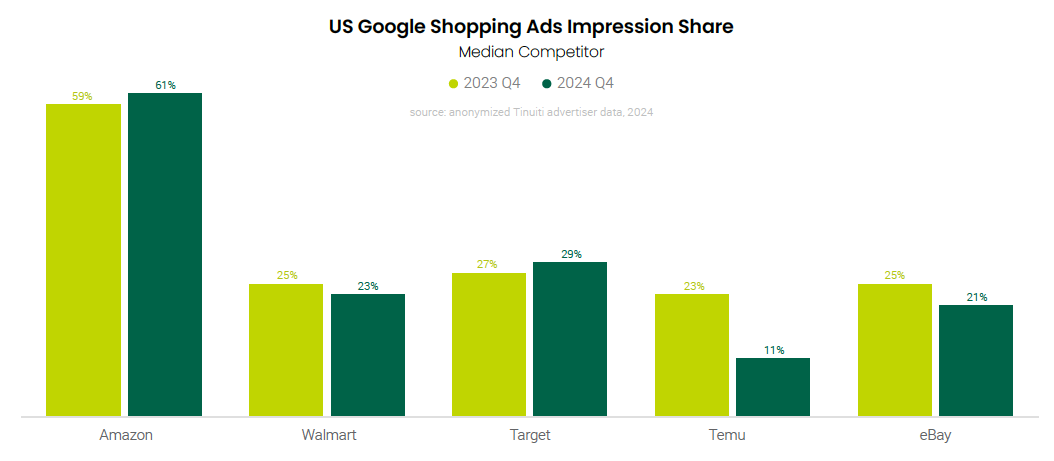
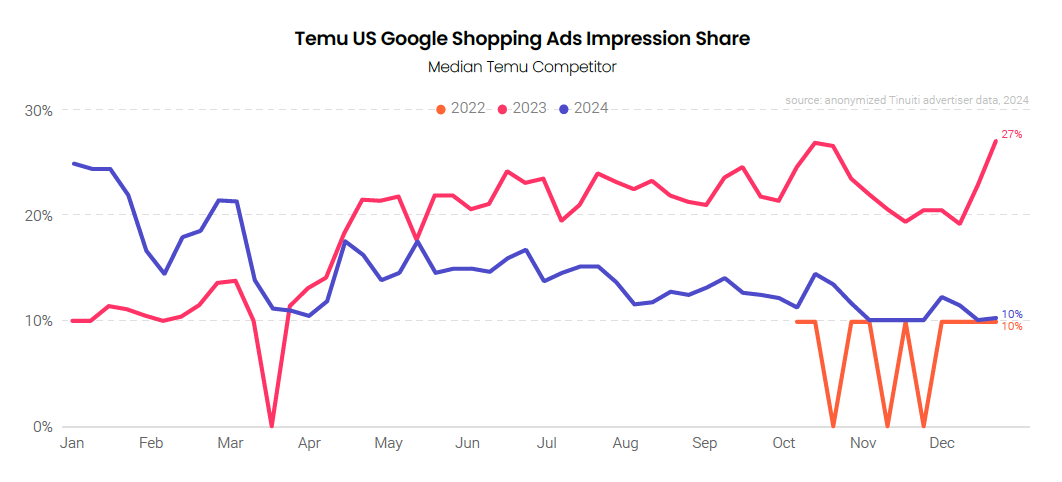
While US Google shopping advertisers still experienced stiff competition from the likes of Amazon in ad auctions in 2024, Temu took a big step back in its Google ad presence throughout the holiday shopping season. Temu’s impression share for the median advertiser that saw it as a competitor in Google shopping Auction Insights reports dropped from 23% in Q4 2023 to just 11% in Q4 2024, and fewer Tinuiti advertisers saw Temu appear in ad auctions at all.
Walmart and Target also saw dips in impression share, though to a much smaller degree. Target impression share edged up year over year.
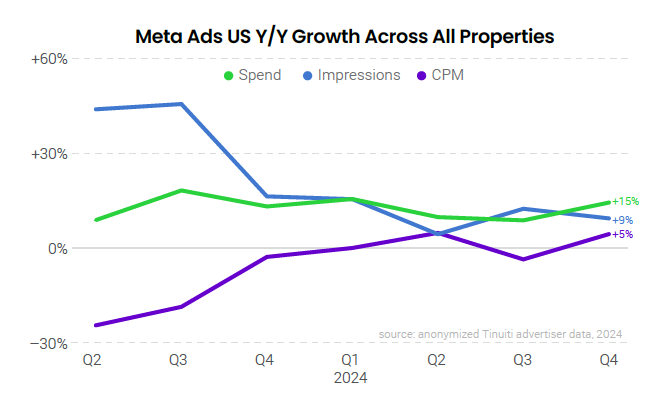
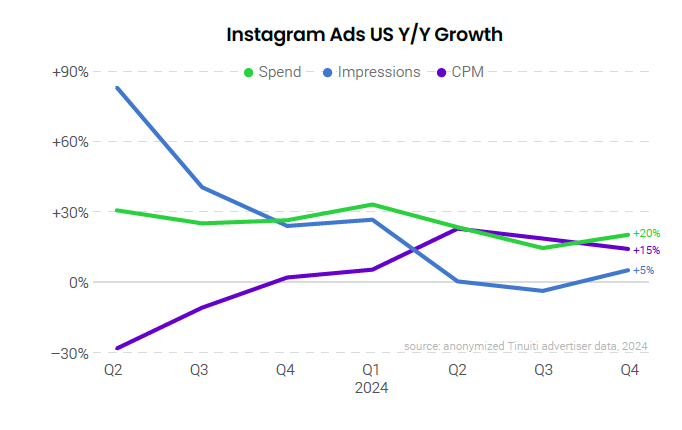
Advertisers ramped up investment across Meta properties by 15% year over year in Q4, an acceleration from 9% growth in the third quarter as fourth quarter year-ago spend growth comps were softer than the quarter prior. Impression growth slowed to 9% in Q4, while CPM rose 5% year over year, an acceleration from the 3% decline observed in Q3. Pricing growth was strongest in December as Cyber Monday got pushed into the final month of the year with a late Thanksgiving.
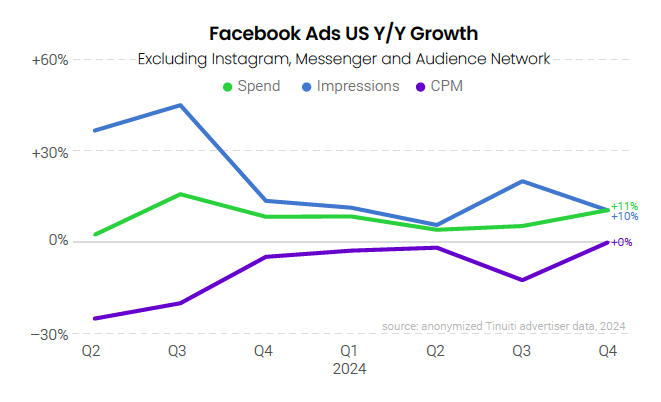
For the first time since Q3 2022, Facebook CPM growth wasn’t in the red in Q4 2024 as it was flat year over year for the final quarter. Spend growth on Meta’s largest platform accelerated from 5% in Q3 to 11% in Q4, in line with expectations given that growth dropped from 16% in Q3 2023 to 8% in Q4 2023. The 11% increase in spend in Q4 is the fastest growth observed on Facebook since Q3 2023.
Advertisers increased investment in Instagram ads 20% year over year in Q4, a jump from 14% growth in Q3 even as advertisers ran into a slightly tougher year-ago comparison in the fourth quarter. CPM rose 15% in Q4, the fifth straight quarter of positive growth on Instagram, while impression growth improved from a 4% decline in Q3 to a 5% increase in the final quarter of the year.
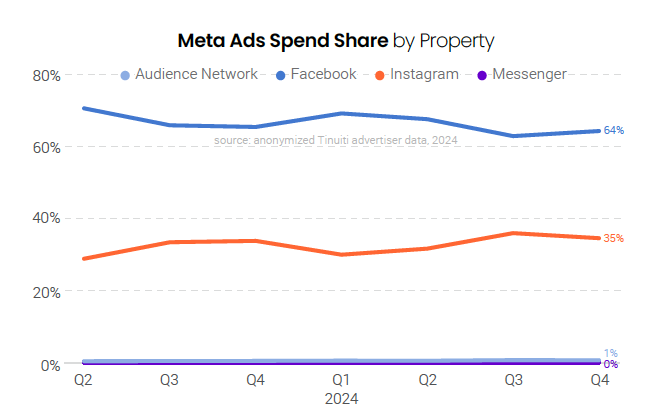
While Instagram share of total Meta ad spend rose year over year, Facebook continues to be the most important platform for Meta as it accounted for 64% of spend in Q4 2024. Instagram spend share stood at 35% in the final quarter, while the Audience Network accounted for 1% of spend. Though still a tiny share of total spend, Audience Network share has ticked up from 2023 when its share was below 0.5% for most of the year.
Retail/ecommerce advertisers spent 34% of Meta budget on Advantage+ shopping campaigns (ASCs) in Q4 2024, the same share observed in Q3 2024. The AI-powered campaign type has grown in popularity since its inception, but some advertisers experienced periods of under or over-delivery in Q4 that couldn’t be explained. As such, some advertisers are reassessing their investment in ASCs, and Meta itself has backed off of recommending advertisers put all conversion-focused ad spend into the campaign type.
For many years, Instagram Feed ad placements were the primary placement for Instagram advertisers, but Feed share has steadily slipped over the last several quarters and stood at just 29% in Q4. Part of the explanation is the rise of Reels ads, which accounted for 18% of ad impressions in Q4 2024, up from 11% last Q4. Stories ads have also grown, rising from 39% share in Q4 2023 to 47% a year later.

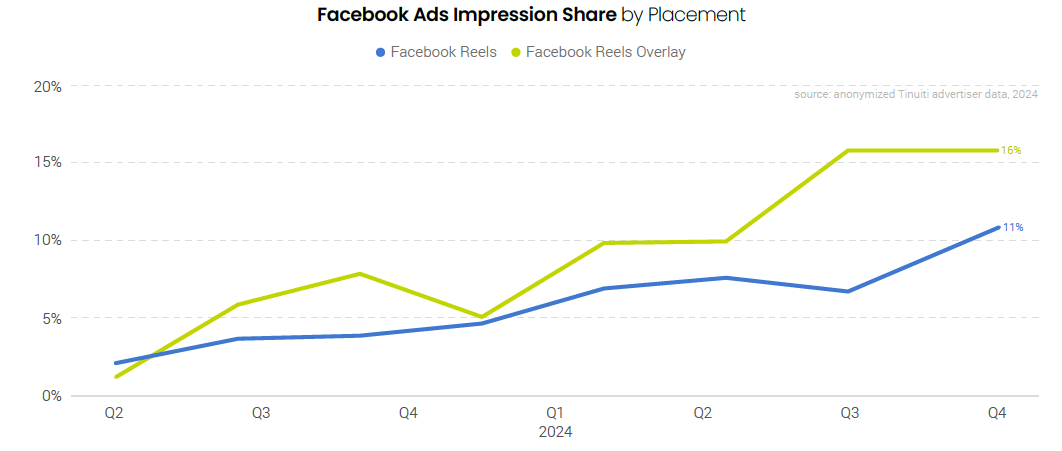
Reels video ads were responsible for 11% of all Q4 2024 Facebook ad impressions, up from 5% impression share a year earlier. Reels overlay ads, which are banner/sticker ads featured on top of Reels videos, accounted for an additional 16% of impressions in the fourth quarter, up from 5% in Q4 2023. Combined, the two formats accounted for 27% of all Facebook ad impressions, nearly tripling their combined impression share from the year prior as Reels are now hugely important for advertisers.
The median advertiser active on TikTok since at least Q4 2023 ramped up ad spend on the platform by 13% year over year in Q4 2024. While this is a steep drop from the 28% increase observed in Q3, advertisers ran up against a much tougher comp in the fourth quarter, with spend in Q4 2023 soaring an impressive 64% year over year. While questions continue to swirl over the fate of the platform, existing advertisers largely carried on as usual in Q4 given that there are still many questions over whether or not TikTok will go away for good.

Spend rose 20% year over year for the median Snapchat advertiser in Q4 2024, a slight deceleration from 21% in the third quarter. Impressions rose 14% in the final quarter of the year, with CPM up 4%. Snapchat rolled out ads to its AI-powered chatbot feature My AI in 2024, and while advertisers aren’t currently able to target based on the context of the query, it may become an interesting source of well-targeted ad placements in the future.

Pinterest CPM rose 21% year over year for the median advertiser in Q4 2024, rebounding from a 17% decline in the third quarter. Spend rose 8% in Q4 after growing 22% in Q2 and 12% in Q3, while impressions fell 11% in the final quarter of 2024. In late 2024, Pinterest rolled out Performance+ campaigns, which are very similar to Meta’s Advantage+ campaigns. The proximity of the announcement to the winter holiday season prevented many advertisers from leaning into Performance+ in Q4, but brands are excited to try it in 2025.

TikTok advertisers that were also active on Meta spent 19% as much spend on TikTok as on Meta in Q4, the same share as Pinterest and higher than the 15% observed for Snapchat. Among Tinuiti clients, there are nearly three times as many TikTok advertisers active on the platform as there are Pinterest advertisers active on that platform, and more than four times as many TikTok advertisers as Snapchat advertisers. As shown in this chart, however, the advertisers that are active on each allocate meaningful budget to these smaller platforms.

Total spending on Google search ads, including text, Performance Max, and standard Shopping campaigns, was up 10% Y/Y in Q4 2024, down slightly from 11% growth a quarter earlier. While Google click growth remained at 3% Y/Y for the third straight quarter, CPC growth continued to decelerate after peaking in early 2024. Average Google search ad CPC was up 7% in Q4 2024.

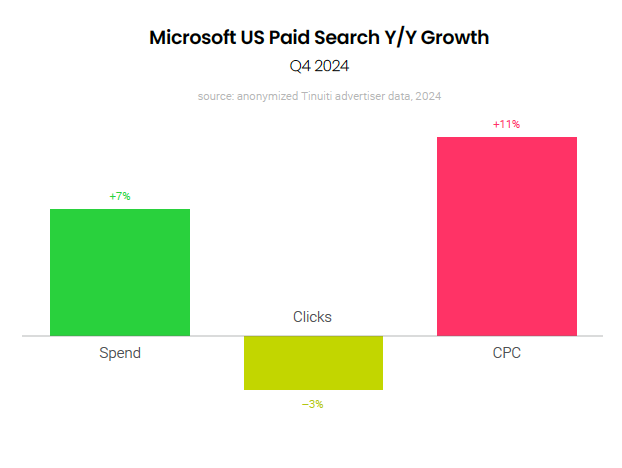
Microsoft search ads, including Performance Max, shopping, and text ad formats, saw spending growth of 7% Y/Y in Q4 2024. Similar to Google, Microsoft saw stronger growth on the pricing side than the volume side as the average Microsoft search ad CPC was up 11% Y/Y while clicks fell 3% Y/Y. Microsoft’s search ads display across Bing, Yahoo, and DuckDuckGo, as well as many smaller sites.
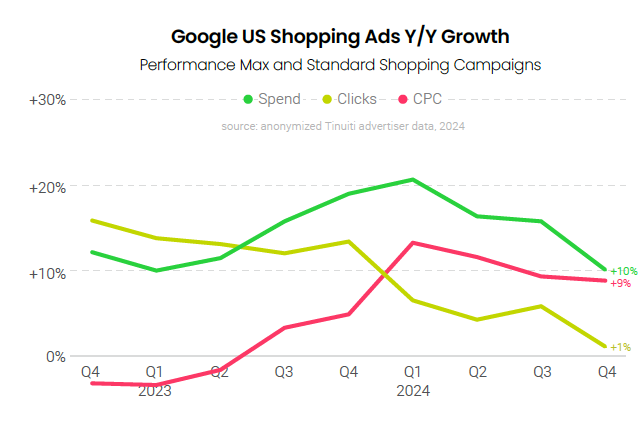
Although Google shopping advertisers faced less competition from Temu in Q4 2024 than a year earlier, Amazon remained aggressive in auctions and year-ago click growth comps were relatively strong. Ultimately, Google shopping ad click growth was just 1% Y/Y in Q4 2024, down from 6% a quarter earlier. Average shopping ad CPC growth remained steady at 9% Y/Y.
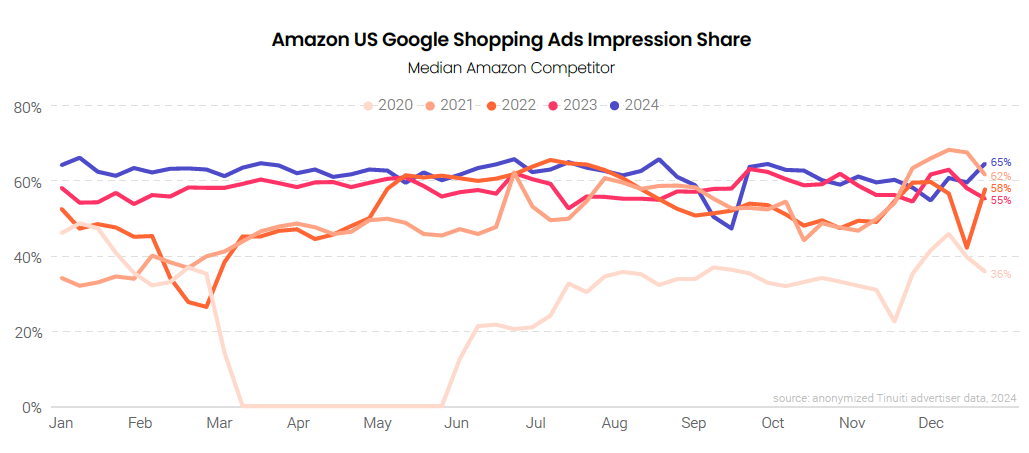
An indicator of its presence in ad auctions, Amazon’s share of Google shopping ad impressions against the median retailer fell sharply in mid-September, but recovered to close out Q3 2024. Over Q4 2024, Amazon’s impression share ran slightly higher than a year earlier for most weeks, according to Google Auction Insights data, but Thanksgiving coming nearly a week later in 2024 than in 2023 may have led to some noisiness in the early December comparisons.
After making a major splash in Google shopping and other digital ad auctions in 2023, Temu appeared to dial back its ad spending over the course of 2024. In Q4, Temu’s typical impression share in Google Auction Insights data was “< 10%”, which is the minimum level that Google reports to advertisers. At the same time, a smaller share of retailers saw Temu listed as a competitor at all in Google’s Auction Insights.
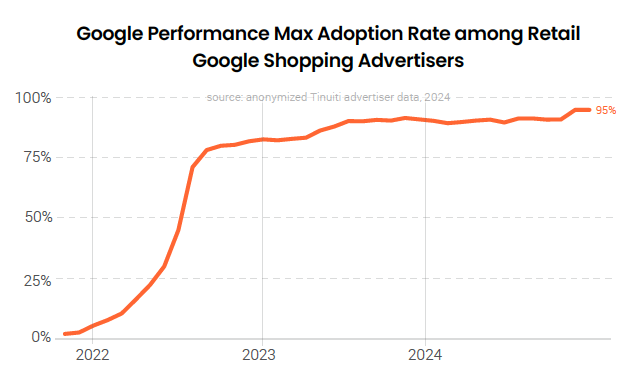
By the end of 2024, over 95% of retail advertisers running shopping ad listings with Google had adopted Performance Max campaigns. A year earlier, PMax adoption stood at 91%, a level that more or less persisted until November 2024. The bulk of PMax adoption initially took place in Q3 2022 when Google migrated Smart Shopping campaigns to the PMax model. In the quarters since, the incremental inventory that PMax provides, along with the innovations Google has focused on PMax have drawn in additional advertisers.
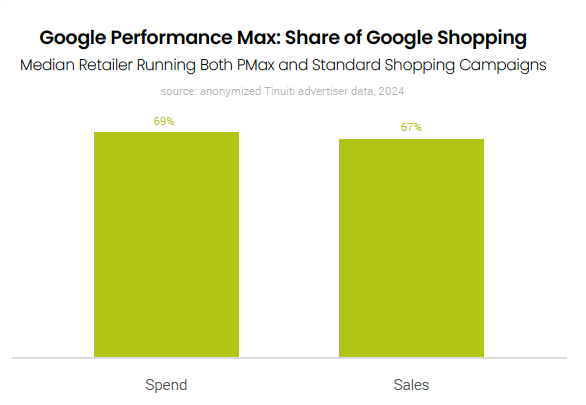
Among advertisers running both Performance Max and standard Google Shopping ad campaigns, PMax accounted for 69% of shopping ad spending in Q4 2024 for the median retailer. Although a significant share of PMax spending is generated by historically higher-funnel inventory like video and display, brands are generating a similar return on ad spend from PMax as standard Shopping campaigns, with PMax accounting for 67% of sales among these advertisers.
Video and other non-shopping search and display inventory accounted for a little under 30% of Google Performance Max spending in Q4 2024, which was up slightly from a quarter earlier. Video spend share has largely held steady at around 5% since late 2023, but other non-shopping sources, which includes text ads, saw a rising share of PMax spend over most of 2024.

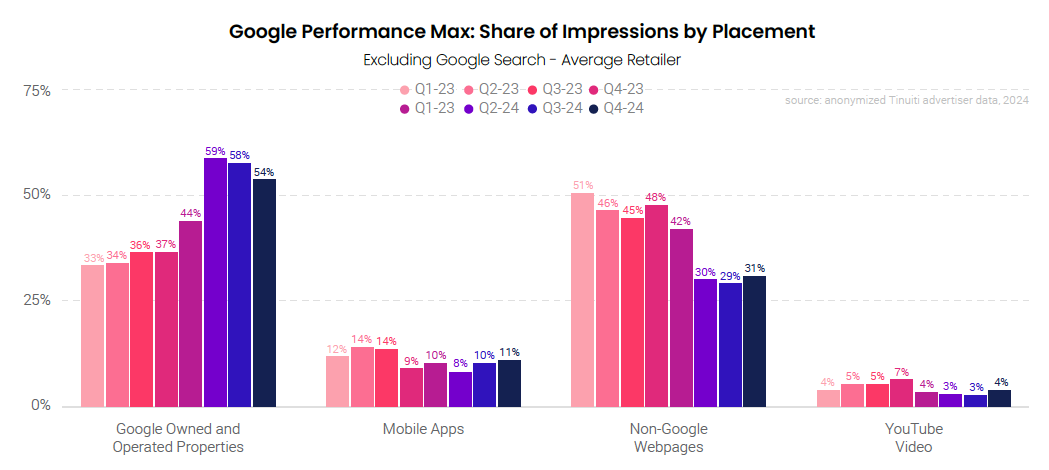
For PMax ad listings appearing outside of search, Google is still generating a majority of the ad impressions itself. In Q4 2024, YouTube accounted for 4% of these non-search PMax placement impressions, while other Google owned and operated properties accounted for another 54%. Non-Google webpages produced 31% of PMax placement impressions in Q4, while mobile apps produced 11%. Non-Google share fell sharply in mid-2024 when Google began allowing account level exclusions for specific search partner sites.
The median retailer running both PMax and standard Google Shopping campaigns generated a similar return on ad spend for each, with PMax ROAS running just 4% lower in Q4, an improvement from a 7% deficit for the previous two quarters. Even as non-shopping inventory has grown as a contributor to PMax spending, PMax has seen an improvement in conversion metrics relative to standard Shopping campaigns. Sales per click for PMax was just 1% lower than that for standard Shopping campaigns in Q4 2024 compared to 13% lower in Q4 2023.

Google search text ad clicks grew 5% in Q4 2024, the strongest rate of growth since the first half of 2023. In recent quarters, the rise of both Performance Max campaigns and Google’s AI overviews have both held the potential to negatively impact traditional text ad volume, but brands generally saw improved non-brand text click-through rates in Q4. With text CPCs up 4% Y/Y, spending on text ads grew 9% in Q4, up from 7% in Q3.

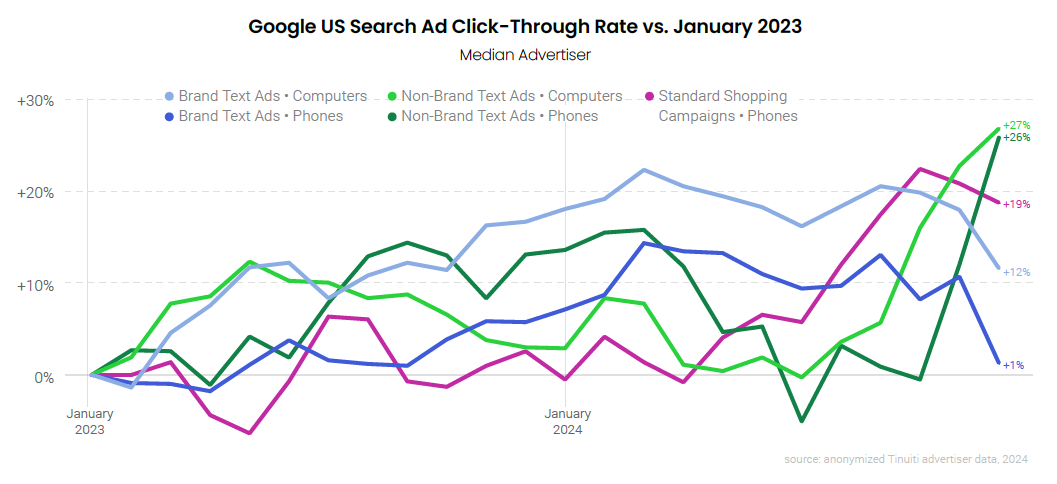
Following Google’s widespread launch of AI overviews in May 2024, click-through rates for multiple text ad segments, particularly the mobile non-brand segment, declined for the median advertiser. While many factors influence ad click-through rates, these results suggested there may have been some negative impact to text ad volume from AIOs. While Google remains committed to AIOs, click-through rates shot up for non-brand texts ads over Q4, helping to deliver stronger volume gains for text ads overall.
The cost of clicks on Amazon’s primary search ad format fell 2% year over year in Q4, a significant drop from 9% growth in Q3. CPC growth soared from 8% in Q3 2023 to 19% in Q4 2023, such that brands had much stiffer year-ago pricing comps in the final quarter of the year. Sponsored Products spend rose 9% year over year, slowing from 15% in the third quarter, as spend growth comps also firmed up in Q4.

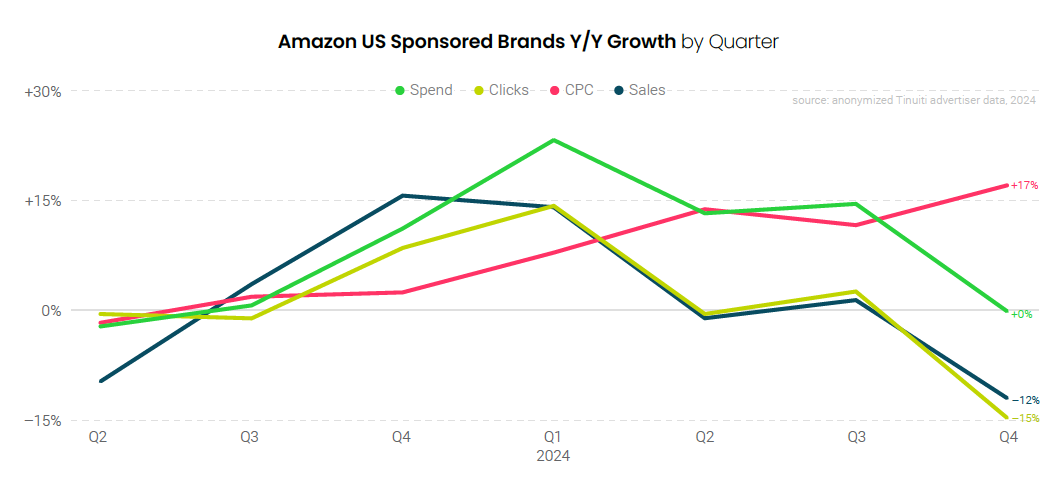
Investment in Sponsored Brands ads held flat year over year in the fourth quarter, with a 15% decline in clicks and a 17% increase in CPC. That marked a deceleration from 15% spend growth in Q3, as advertisers ran up against much tougher year-ago comparisons in Q4 than in Q3. Sales attributed to the format fell 12% year over year, continuing a trend of year-over-year declines in Sponsored Brands ROAS observed throughout 2024.
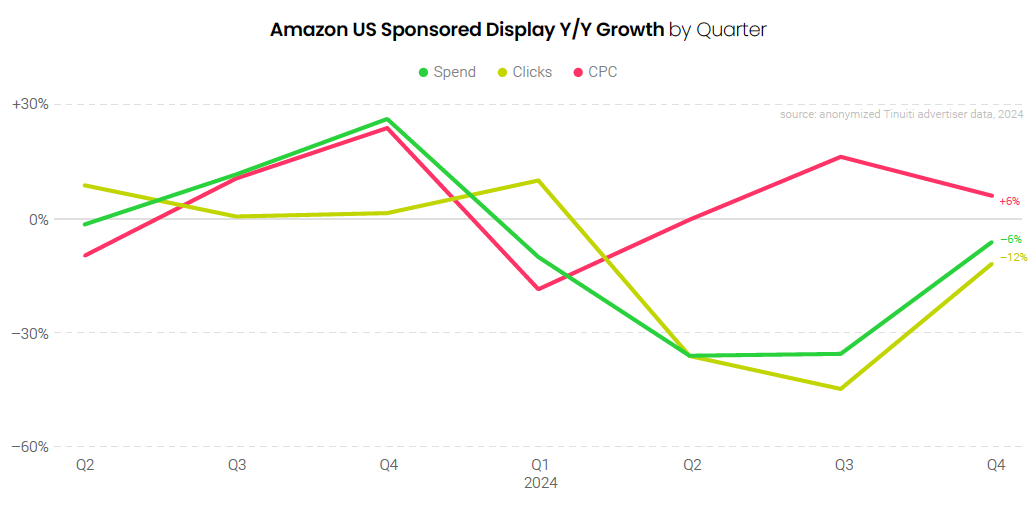
Amazon advertisers decreased investment in Sponsored Display ads year over year every quarter of 2024, and in Q4 spend was down 6% compared to the year prior. Clicks decreased 12% year over year, while CPC rose 6%. While the share of total Amazon investment attributed to Sponsored Display campaigns has slipped, the Amazon demand-side platform continues to grow in importance, such that display advertising is still becoming a bigger part of Amazon ad budgets over time.
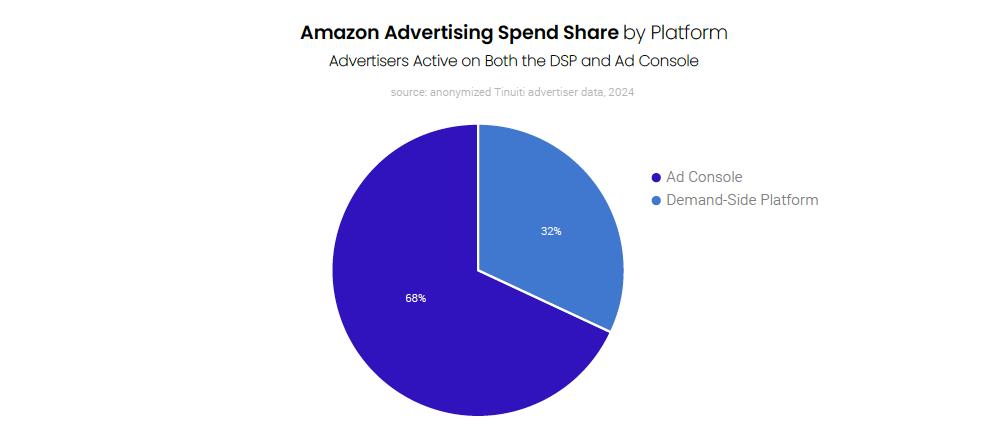
Among advertisers active on both the Amazon demand-side platform (DSP) and Ad Console in Q4, 32% of all Amazon investment was spent on the DSP, compared to 68% on the Ad Console. This figure does not include spend from non-endemic brands that aren’t active on the Ad Console but do invest the Amazon DSP, a group that has only grown since the launch of Amazon Prime Video ads in early 2024.
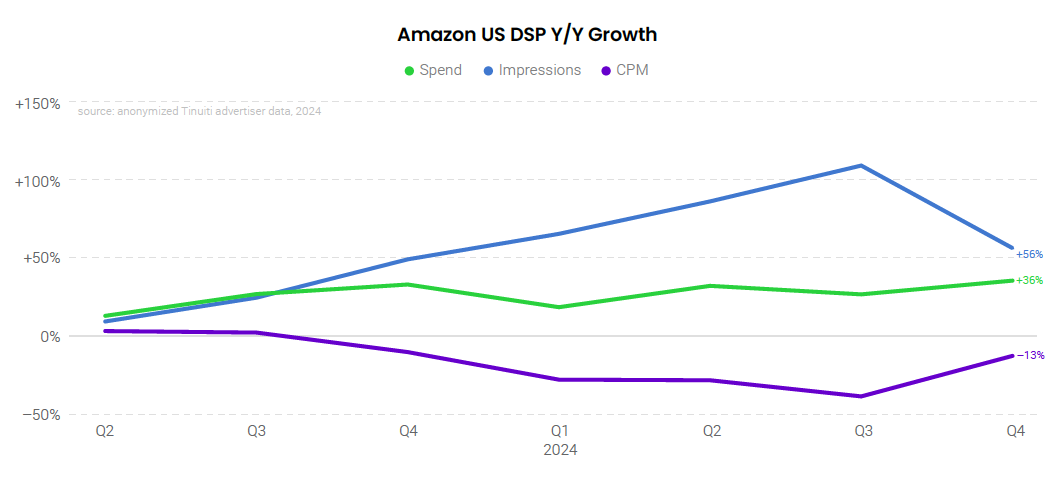
Spend on the Amazon DSP soared 36% year over year in the fourth quarter, an acceleration from Q3 and the strongest growth for Tinuiti advertisers since Q4 2021. Part of this strong growth is attributed to the introduction of Prime Video ad inventory, which was rolled out in Q1 2024 and has quickly been adopted by many advertisers. Total DSP impressions rose 56% year over year in the fourth quarter, while CPM fell 13%.
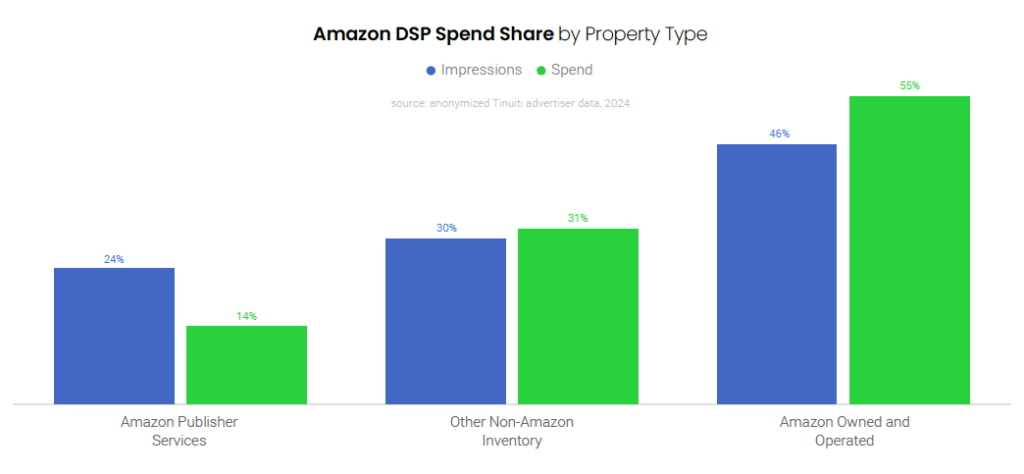
Amazon’s website, app, and other owned properties accounted for 55% of Amazon DSP spend in the final quarter of 2024. Amazon Publisher Services inventory was responsible for 14% of spend, with the remaining 31% of spend coming from other non-Amazon inventory. As has long been the case, Amazon owned and operated properties had a lower impression share than spend share in Q4, as CPM is higher for Amazon properties than for other placements.
Walmart advertisers increased investment in the retail giant’s primary search ad format 53% year over year in the final quarter of 2024, the strongest growth observed for Tinuiti advertisers since Q4 2023. As was the case in Q3 2024, the increase in spend was largely driven by growth in CPC, which rose 51% in the fourth quarter. Clicks rose 1%, a slight uptick from flat growth in the third quarter.

In Q4 2024, 12% of all Walmart search advertising spend was attributed to Sponsored Brands and Sponsored Videos, up from 4% in Q4 2023 as adoption of these campaign types has grown over the last year. Over 2/3 of Walmart search advertisers deployed Sponsored Brands ads to some extent in the final quarter of the year, while 47% ran Sponsored Videos campaigns.

Sponsored Products account for the lion’s share of Walmart search ad spend, and in Q4 the campaign type had much lower CPC than Sponsored Brands and Sponsored Videos campaigns. In the case of Sponsored Videos, the campaign type has historically had a $1.30 minimum CPC for advertisers to participate in auctions, but Walmart updated that minimum to $0.80 at the start of November. This will likely make Sponsored Videos campaigns more attractive to advertisers moving forward.

Self-serve display advertising has already become a key part of how many Walmart advertisers are wielding Walmart’s advertising suite. In Q4, 32% of all Walmart self-serve advertising spend went to display advertising for brands investing in both display and search, compared to 68% attributed to search formats of Sponsored Products, Sponsored Brands, and Sponsored Videos ads.

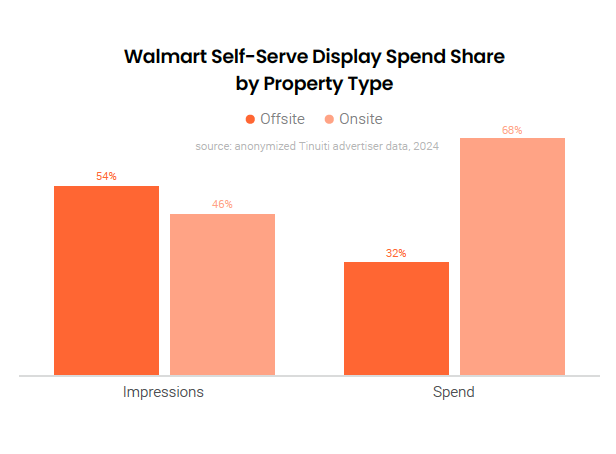
Advertisers can use Walmart’s display advertising tools to target inventory both on and off of Walmart’s website and app. In the final quarter of 2024, 68% of all Walmart display advertising spend went to inventory on Walmart’s website and app, compared to 32% attributed to placements off of Walmart-owned properties. As is the case with the Amazon DSP, placements on Walmart’s owned properties carried a higher CPM than other inventory and onsite inventory
accounted for only 46% of impressions.
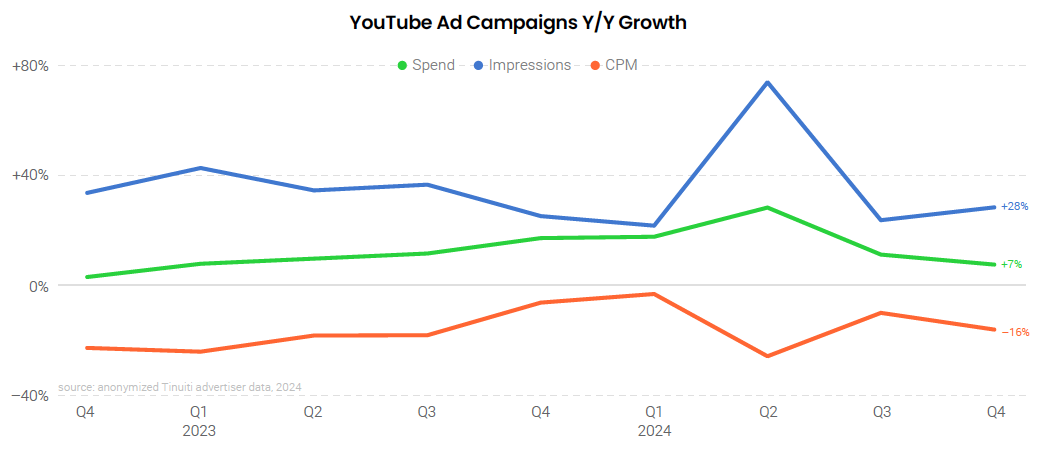
Advertiser spending on standard YouTube video ad campaigns was up 7% Y/Y in Q4 2024, down from 11% growth a quarter earlier. YouTube impression growth remained strong, and even accelerated from 23% Y/Y in Q3 to 28% in Q4, but the average YouTube CPM fell by 16% Y/Y in the final quarter of the year. Importantly, advertisers have more ways than ever to purchase inventory on YouTube, including through YouTube Select reserved buys, as well as through Performance Max and Demand Gen campaigns.
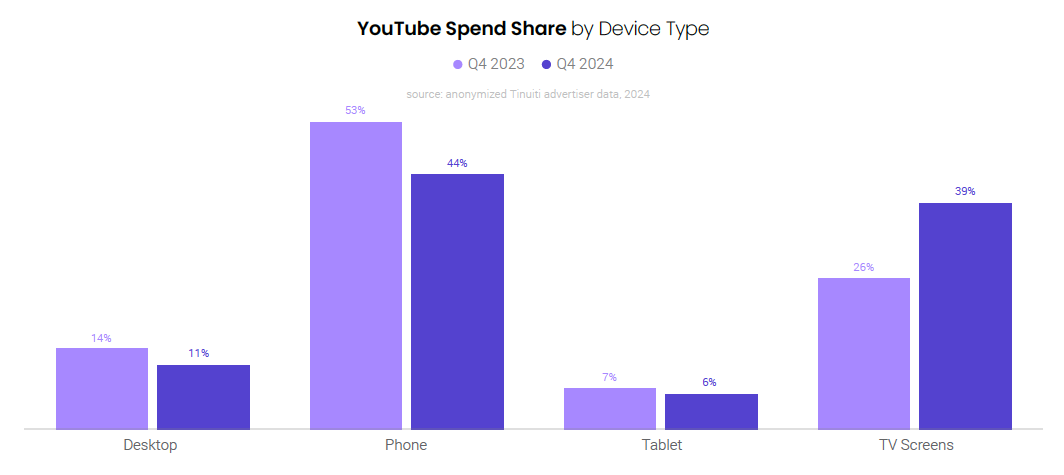
Connected TVs accounted for 39% of YouTube ad campaign spending in Q4 2024, up from 26% in Q4 2023. YouTube TV spending was up 60% Y/Y in Q4, far outpacing YouTube’s overall spending growth of 7%. Phones still drew the largest share of YouTube ad dollars at 44%, but that was down from a majority of spending in Q4 2023. Desktop contributed another 11% of YouTube spending in Q4 2024, while tablets contributed 6%.
Outside of YouTube, streaming video ad spending, including on major platforms like Netflix, Max, Prime Video, and Tubi, was up 19% Y/Y in Q4 2024 up from 16% growth a quarter earlier. Streaming impressions were up 18% in Q4, while average CPM was flat Y/Y. Since launching ads in January 2024, Amazon Prime Video has helped boost streaming ad spending, adding about four points to overall Y/Y streaming spending growth.

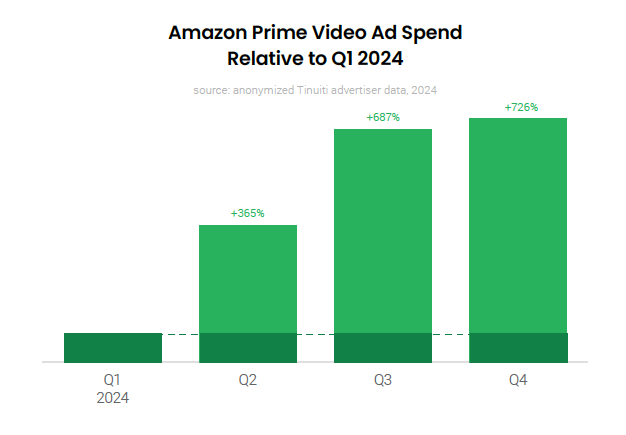
With more advertisers coming on board and others increasing their investment over time, spending on Amazon Prime Video ads was a little over eight times higher in Q4 2024 than it was in Q1 2024. Prime Video ads launched at the tail end of January 2024, so even most early adopters didn’t launch ads until February. Over the full second quarter of the year, spending on Prime Video ads shot up by nearly five times, before nearly doubling from Q2 to Q3.
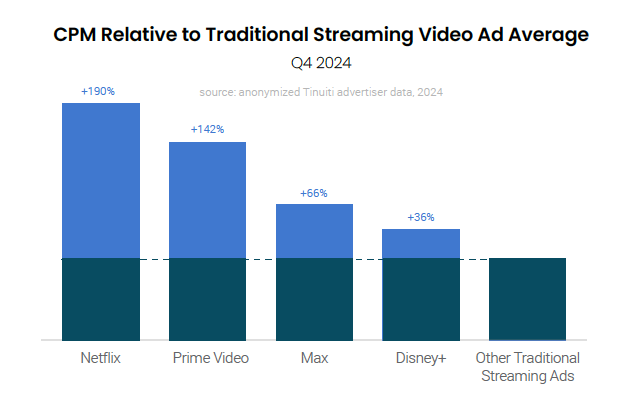
Brands advertising on Netflix paid an average CPM that was 2.9 times that of their average CPM across all traditional streaming ad platforms. Amazon Prime Video has also commanded a strong CPM since its launch of ads early in 2024. Prime Video CPM was 2.4 times the traditional streaming ad average in Q4 2024. This was ahead of Max and Disney+, where CPM was 1.7 times average and 1.4 times average, respectively.
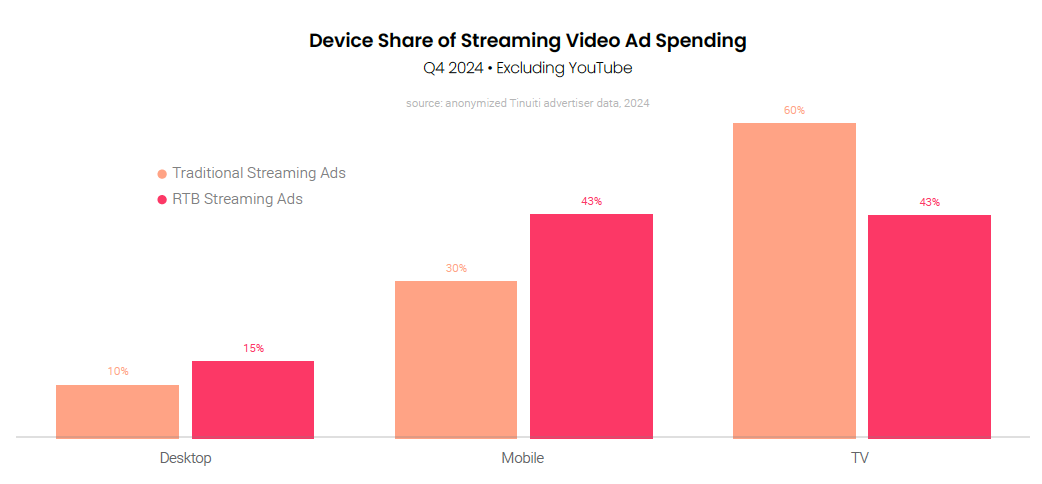
TV screens accounted for 60% of traditionally-purchased streaming video ad spending in Q4 2024, which was up slightly from a quarter earlier. Computers produced just 10% of traditional streaming ad spending while phones and tablets produced 30%. Mobile devices were a larger contributor to streaming ads purchased through real-time bidding, accounting for 43% of spend. TVs accounted for 43% of RTB spending as well, while computers accounted for 15%.
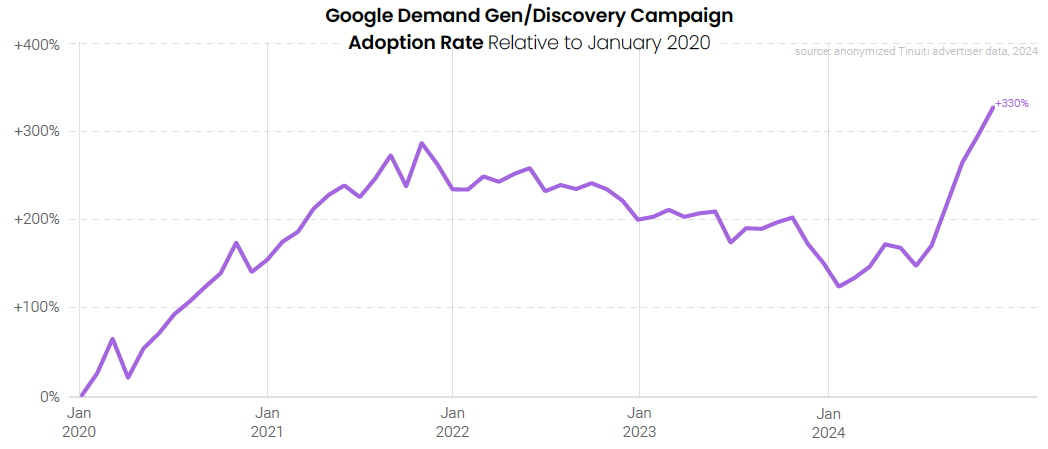
The adoption rate of Google Demand Gen campaigns shot up in Q4 2024 reaching a new all-time high. The previous peak occurred three years earlier before Google transitioned its Discovery campaigns to the newer Demand Gen model. While video is already a significant contributor to Demand Gen spending, Google announced in September 2024 that it would convert Video Action Campaigns to Demand Gen beginning in Q2 2025, making it important for brands to better orient themselves with Demand Gen now.
Although adoption of Google Demand Gen campaigns was up sharply in Q4 2024, existing advertisers didn’t increase their investment in Demand Gen much compared to a year earlier. Same-site spending on Demand Gen campaigns was up 5% Y/Y in Q4, up from running flat the previous two quarters. Demand Gen impressions grew 14% Y/Y in Q4, while average CPM fell by 7%.

For brands that have consistently run Google Demand Gen campaigns since Q4 2023, video ads accounted for 36% of Demand Gen spending to close out 2024. That was triple the spend share that video accounted for in December of 2023 and video’s share of Demand Gen spend is likely to only increase further when Google transitions Video Action Campaigns to the Demand Gen model in Q2 2025.

Advertiser spending on Google Display Network campaigns was up 11% Y/Y in Q4 2024, a small acceleration from 10% growth a quarter earlier. Impression growth for the GDN was strong at 24% Y/Y, but average CPM fell 10% to close out 2024. Google has officially reported nine straight quarters of revenue declines for its “Other Ads” segment that includes the GDN, but it saw stronger results in Q3 than Q2.

Check out our most recent Digital Ads Benchmark Report for more exclusive insights.
