Digital Ads Benchmark Report Q4 2023
Quarterly Trends Across Google, Meta, Amazon, And More
Quarterly Trends Across Google, Meta, Amazon, And More
The Tinuiti Digital Ads Benchmark Report is based on anonymized performance data from advertising programs under Tinuiti management, with annual digital ad spend under management totaling over $4 billion. Samples are restricted to those programs that have remained active and maintained a consistent strategy over the time periods studied. Unless otherwise noted, all figures are based on same-client growth. The trends and figures included are not meant to represent the official performance of any advertising platform or the experiences of every advertiser.
Note: The data below is from 2023. Head here to see our most recent report.
Tinuiti is the largest independent performance marketing firm across Streaming TV and the Triopoly of Google, Facebook, and Amazon, with $4 billion in digital media under management and over 1,000 employees.
Looking across the major digital ad platforms of Facebook, Instagram, Amazon Sponsored Products, Google search, and YouTube, spending growth closed out 2023 on much stronger footing than it began the year.
While Facebook was the only one of these platforms to see a deceleration in growth between Q3 and Q4, it still saw the biggest lift in growth from the first quarter of the year to the last.
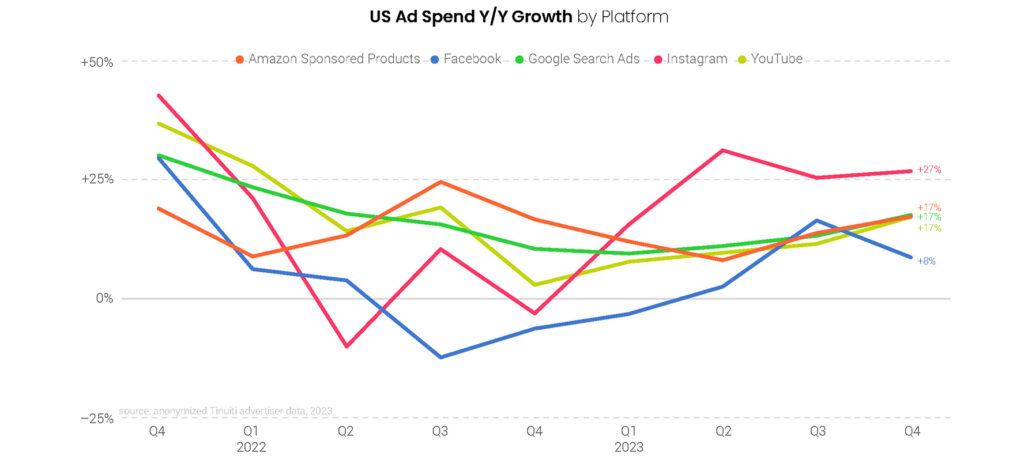
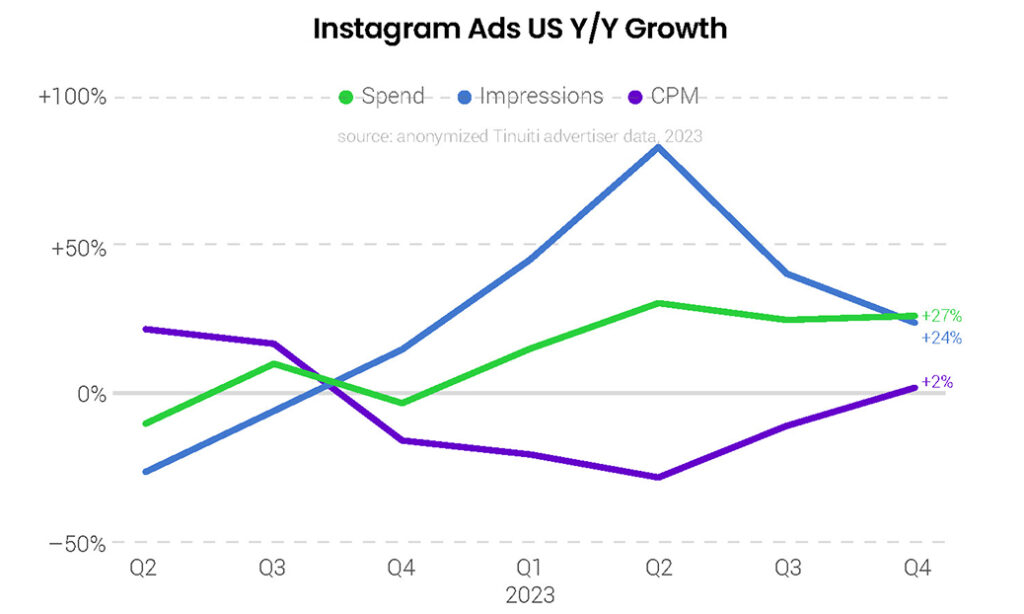
Meta’s other major property, Instagram, continued to see the strongest growth across these five platforms with spending up 27% year over year in Q4. Across Facebook and Instagram combined, spending was up 13% in Q4, compared to running flat in Q1.
Both Facebook and Instagram saw newer inventory sources grow in importance over 2023, and advertisers have taken advantage of Meta’s AI-powered Advantage+ shopping campaigns at increasing rates. Advantage+ shopping campaigns rolled out in Q3 2022, but already accounted for 27% of retail Meta spend in Q4 2023.
For its part, Google has also leaned heavily on AI-based campaigns, having transitioned its Smart Shopping campaigns to Performance Max campaigns in Q3 2022 and its Discovery campaigns to Demand Gen campaigns beginning in Q4 2023. Of the two, Performance Max has had the bigger impact, having been adopted by over 90% of brands running shopping listings with Google and helping drive spending on Google shopping ads up 19% Y/Y in Q4, as well as total Google search spending up 17%.
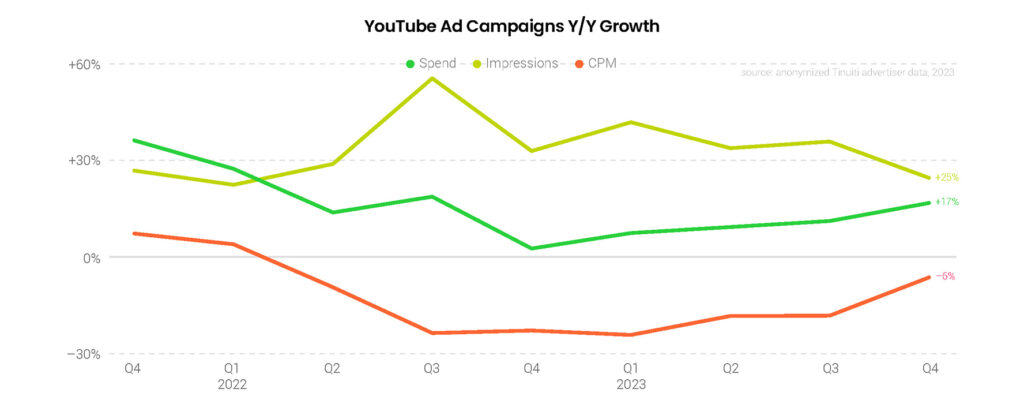
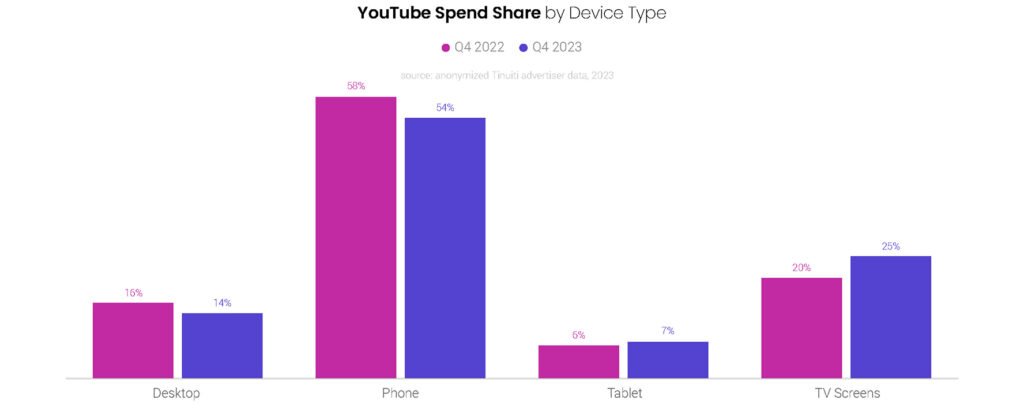
YouTube is also benefiting from ads created by Google’s Demand Gen and Performance Max campaigns, including on YouTube Shorts, but standard YouTube ad campaigns have seen strong growth on their own, with spending up 17% Y/Y in Q4. TV screens were once again the fastest growing device segment for YouTube ads in Q4, with spending up 44% year over year.
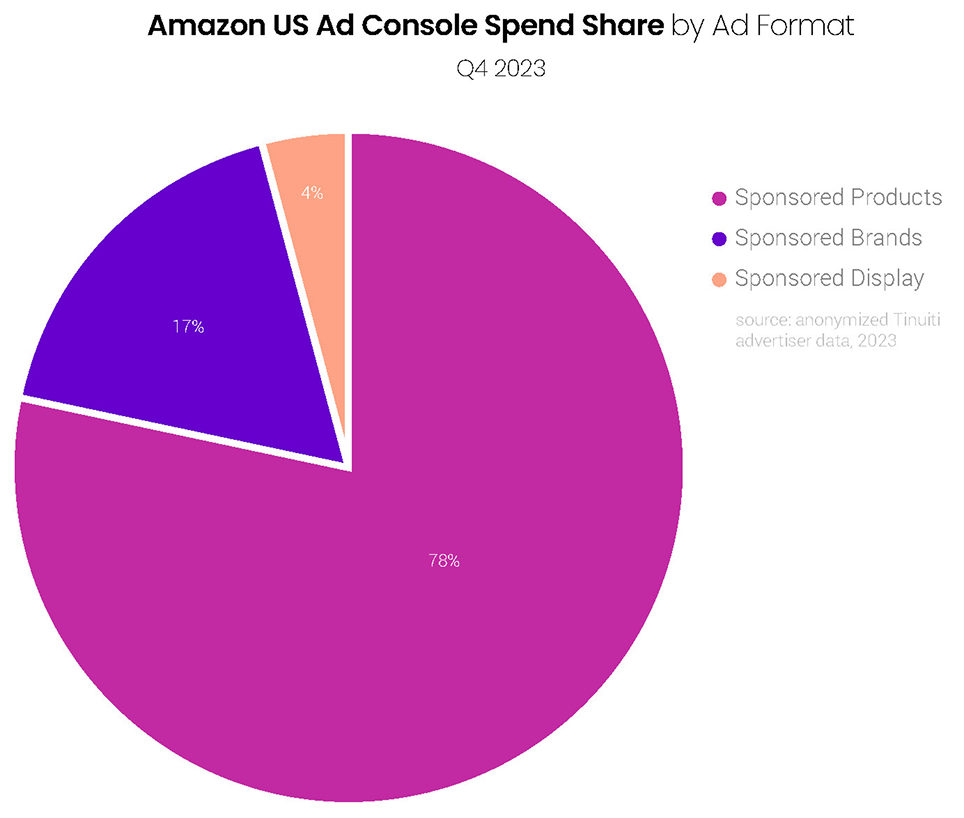
Accounting for over three-fourths of Amazon Ad Console spending in Q4 2023, Sponsored Products ad spending was up 17% Y/Y, a high for the year. Although Amazon moved to expand the reach of Sponsored Products to off-site inventory on platforms like Pinterest in the second half of 2023, the impacts to traffic volume have been minimal so far.
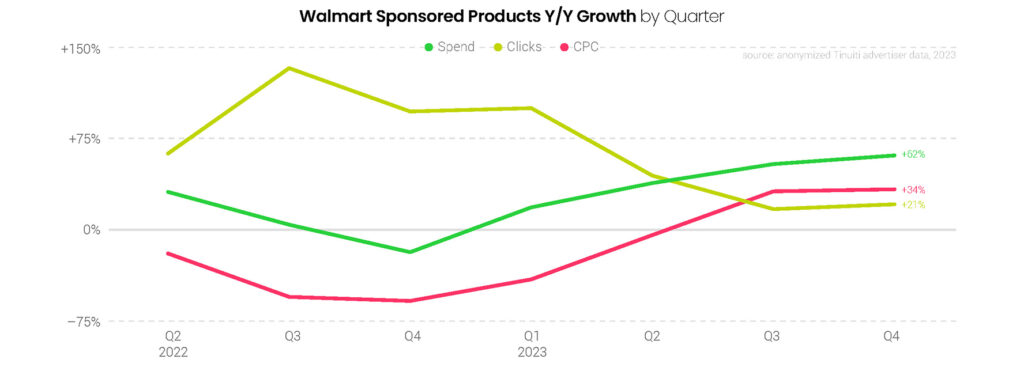
As two rising platforms in the digital ads industry, Walmart and TikTok both saw stronger spending growth in Q4 2023 than the bigger players with Walmart Sponsored Products spending up 62% Y/Y, while TikTok ad spending was up 64%. Walmart has seen a strong turnaround in growth for its CPCs, which had fallen sharply due to a change to Walmart’s auction mechanics in mid-2022.
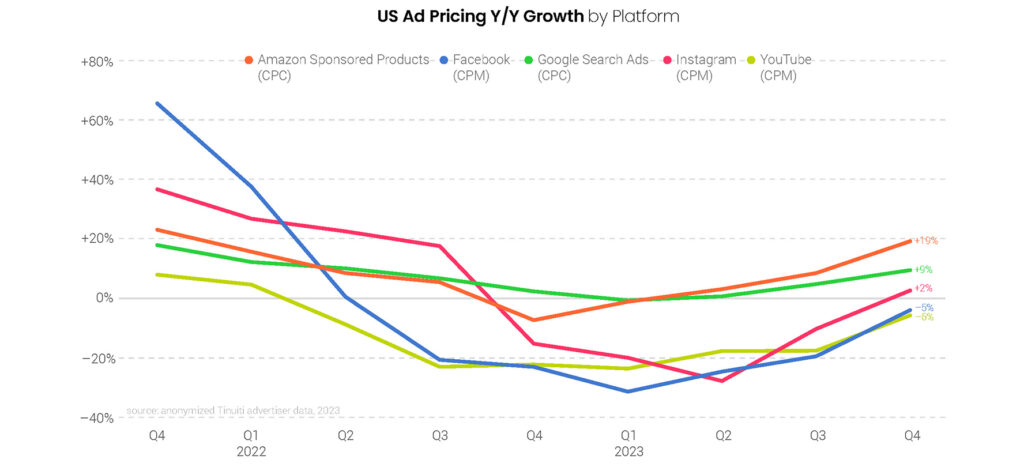
Amazon Sponsored Products, Facebook, Instagram, Google search, and YouTube all saw higher pricing growth in Q4 2023 than in Q3, with all but Google seeing a double-digit acceleration in growth. Pricing growth for platforms like Google and Amazon that are typically managed with a focus on CPC continue to see the highest pricing growth, but the CPM-focused platforms are closing the gap.
Like other digital ad platforms, Facebook and Instagram saw weakening pricing trends in the second half of 2022 with growth bottoming out in early 2023. Both Facebook and Instagram saw CPM declines near 30% during this period. As concerns about a US recession have subsided and year-ago comps have gotten weaker and weaker, pricing growth now has some tailwinds for Meta’s platforms and those of others.
Average CPC growth rates for Google search ads and Amazon Sponsored Products didn’t fall as far as the CPM growth rates for Facebook and Instagram did in the last six quarters, but they did hit negative territory, with Sponsored Products seeing an 8% CPC decline in Q4 2022. In the quarters since, Sponsored Product CPC growth has picked up by 27 points, more than any other major platform.
Although both Google search and Amazon Sponsored Products ads saw 17% advertiser spending growth over Q4 2023, consumer demand growth varied considerably from that level for each platform throughout the quarter, with brands seeing the strongest sales results in November before a cooldown in December.
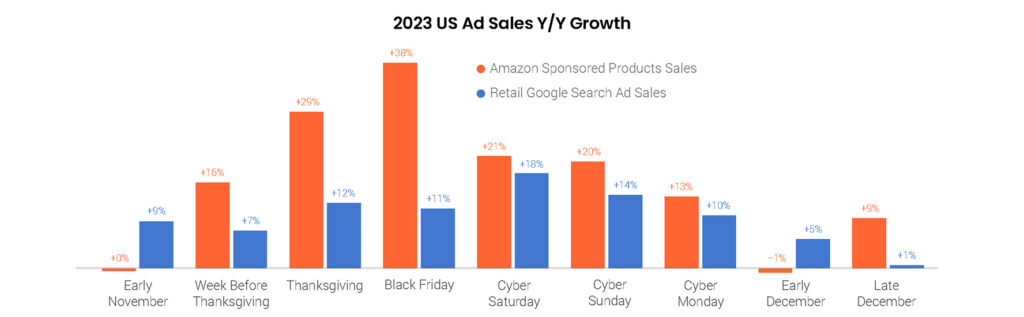
Across both Google and Amazon ads, Q4 growth in the sales attributed to ads was strongest during the period from Thanksgiving through Cyber Monday, commonly known as the Cyber Five. For Amazon ads, sales growth peaked on Black Friday at nearly 40% Y/Y, and Google saw its strongest sales growth for retailers the very next day at 18% Y/Y. While retailers have steadily been pulling holiday offers earlier in the shopping season, it continues to be the case that consumers have been conditioned over the years to expect the best prices and discounts to occur around Black Friday and Cyber Monday.
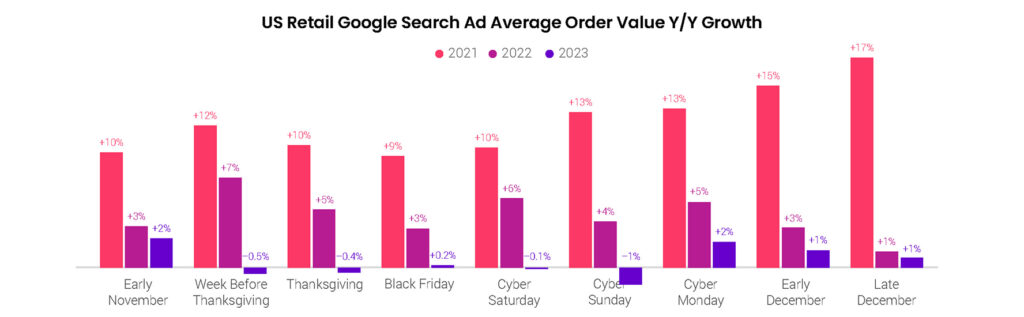
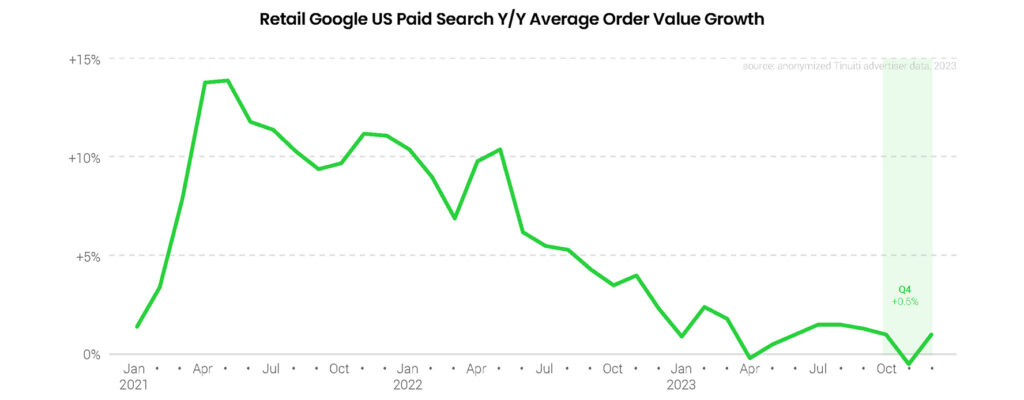
In terms of the drivers of holiday sales gains from digital ads, brands have seen a significant shift in recent years as average order value (AOV) growth has slowed. While higher product prices helped drive bigger AOVs for Google search advertisers in 2021 and 2022, that effect has been more muted over the last several quarters as inflation rates have retreated.
From the beginning of November through the end of December 2023, Google search AOV was roughly flat year over year, compared to low to mid-single-digit growth in 2022 and double-digit growth in 2021. For the full fourth quarter, Google search ad AOVs averaged just 1% growth.
While AOVs may no longer be driving sales per click growth in year-over-year terms, brands still saw massive swings in sales per click as the holiday shopping season progressed, as expected. Compared to early November results, sales per click soared just ahead of and during the Cyber Five, but fell sharply after Cyber Monday. For Amazon, which ran an eleven-day promotional period in the lead up to Cyber Monday, sales per click ran below early November levels for a period into early December.
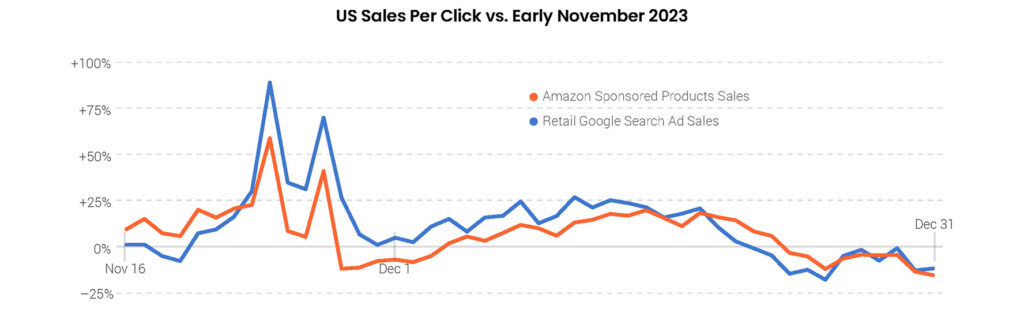
Both Google search and Amazon Sponsored Products ad sales per click rose throughout much of December, but while Google sales per click fell sharply beginning six days before Christmas, Amazon was able to sustain relatively high sales per click for several more days. Brands have seen this phenomenon in previous years, and it likely speaks to the confidence consumers have in Amazon to fulfill orders quickly, even during the frantic final days of the holiday shopping season.
Marketers should certainly account for these shifts in the value of ad clicks by making bid adjustments and other optimizations during the holiday season. Building a proper fourth quarter strategy, however, should also involve digging into which types of customers are most likely to be shopping during different time frames.

For example, many brands value new customers more highly than returning customers. In the case of Amazon advertisers, Black Friday and Cyber Monday presented awesome opportunities to get in front of new customers, as the share of Sponsored Brands conversions attributed as new-to-brand spiked on each of these key sales holidays. However, the highest daily new-to-brand conversion shares actually came later in the holiday season, as shoppers grew increasingly likely to purchase from new brands when cutoffs for receiving packages in time for Christmas were about to hit.
Spend growth across Meta properties was much stronger throughout the back half of 2023 than the first two quarters, topping 10% in both Q3 and Q4 after averaging 4% growth over Q1 and Q2. Advertisers increased spend 13% year over year in Q4, with a 16% increase in impressions and 3% decline in CPM. Pricing growth steadily recovered throughout the year, going from a 30% Y/Y decline in Q1 to a 3% decline in Q4, as advertisers ran up against easier year-ago comparisons.

The cost of ad impressions on Meta’s Facebook platform declined at least 20% year over year in every quarter from Q3 2022 to Q3 2023, but that decline slowed to just 5% in the final quarter of 2023. Recent declines in CPM are at least partially the result of newer inventory sources like Reels video and overlay ads growing in importance over the last year. Spend grew 8% on the platform, slower than the 16% observed in Q3 but much stronger than either of the first two quarters of the year. Impression growth slowed from 46% in Q3 to 14% in Q4.

For the first time since Q3 2022, Instagram CPM rose year over year, hitting 2% growth in the final quarter of 2023 after declining 11% in Q3. With the recovery in pricing, spend growth accelerated from 25% in Q3 to 27% in Q4, even as impression growth slowed from 41% to 24%. Reels video ads impression share remained roughly steady over the course of 2023, coming in at 11% in the final three months of the year.
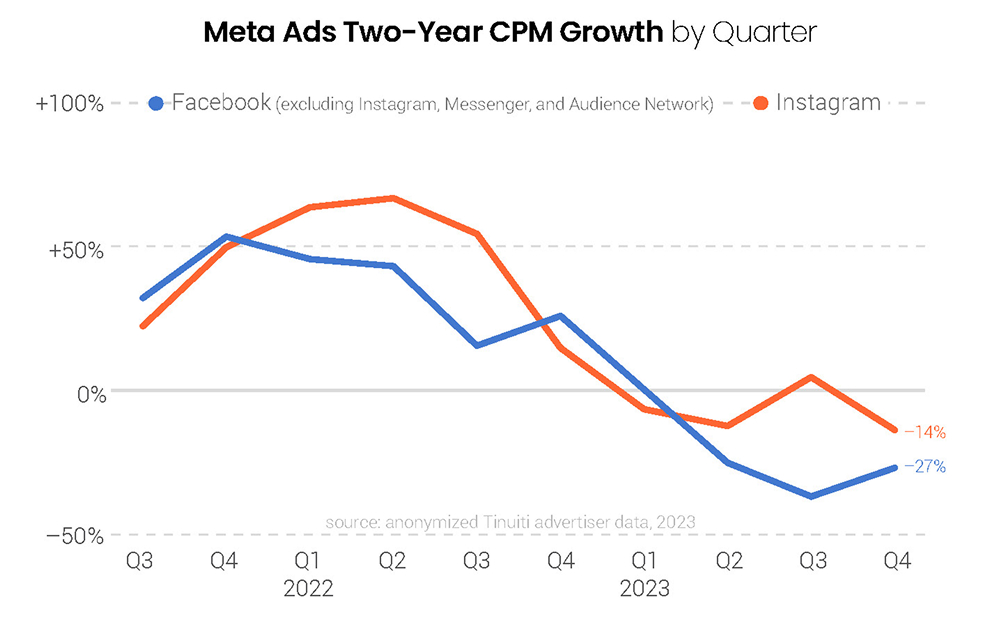
In the final quarter of the year, Facebook advertisers saw CPM decline 27% relative to Q4 2021, the third straight quarter in which Facebook declined by at least 25% on a twoyear basis. Despite Instagram CPM growing 2% in year-over-year terms in the fourth quarter, the f irst positive growth since Q3 2022, impression pricing still fell 14% on a two-year basis. Pricing has been softer over the last year in part due to the rise of newer inventory sources like Reels across both Facebook and Instagram.
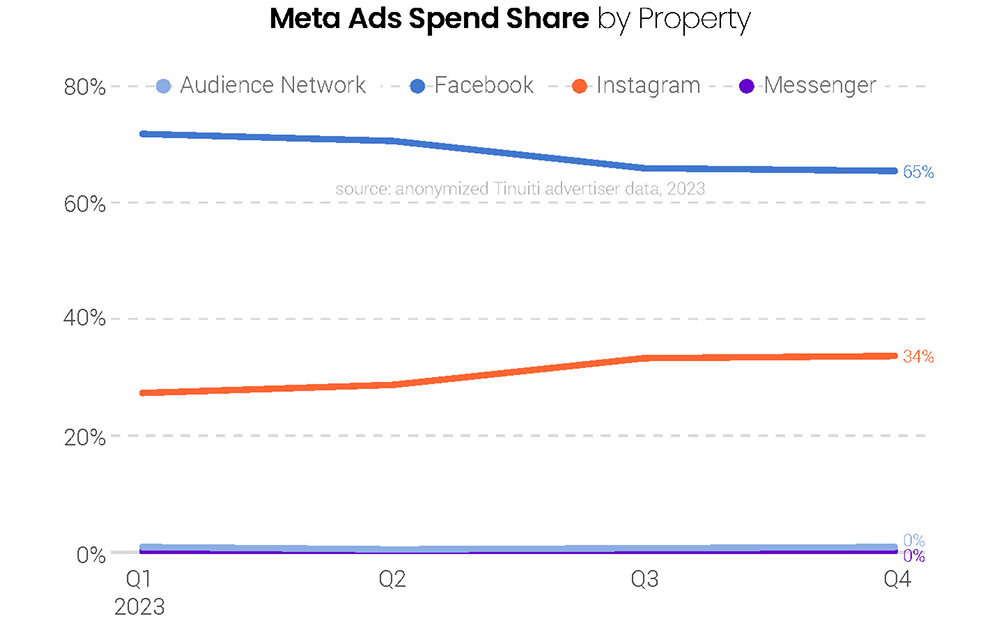
The share of total Meta Ads spend attributed to Facebook was 65% in Q4, as the oldest of Meta’s platforms continues to be the most important for advertisers. Instagram share has grown over the course of 2023, coming in at 34% in each of the final two quarters of the year. The Audience Network, which was hit harder by Apple’s App Tracking Transparency prompt than other Meta platforms, continues to account for only a tiny share of spend.
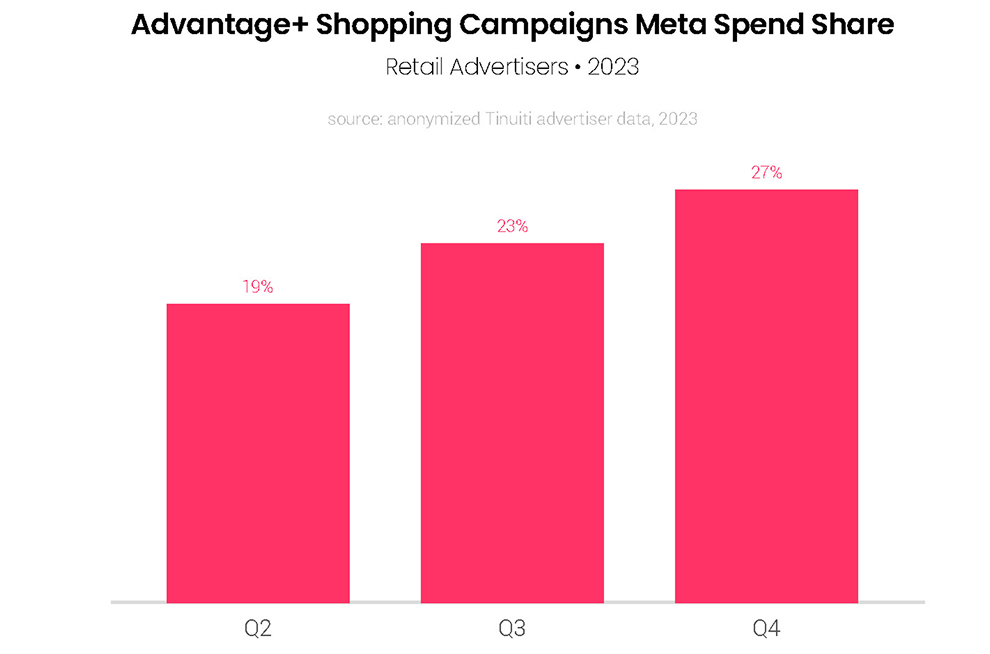
Many retail advertisers have quickly adopted Meta’s AI-powered campaign type Advantage+ shopping, and in Q4 2023 27% of all Tinuiti retail spend across Meta properties went to Advantage+. That’s up from 23% in Q3 and 19% in Q2, as the campaign type’s performance has made it a key part of retailers’ Meta advertising strategy since its limited rollout in August 2022. Advantage+ automates many aspects of ad creation and creative optimization.
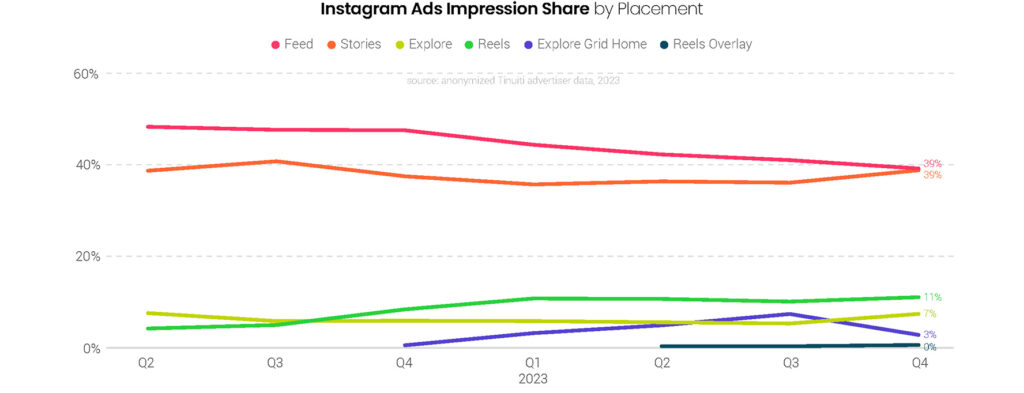
In Q4 2023, Instagram Feed placements accounted for 39% of ad impressions on the platform, down from 41% the quarter prior, and equivalent to the share attributed to Instagram Stories. Reels placements accounted for 11% of ad impressions, up from 8% in Q4 2022, while Explore and Explore grid home placements combined for 10% impression share. Reels overlay ads still account for only a trickle of impressions, but may yet grow more meaningful as evidenced by the format’s share of Facebook impressions.
In addition to the importance of Reels on Instagram, the feature has already become a prominent part of Facebook use as well. In Q4 2023, Reels and Reels overlay ads combined to drive 10% of all Facebook ad impressions, twice the share observed in Q4 2022. Overlay units, which place banner and sticker ads on top of Reels videos, accounted for 5% of Facebook ad impressions in Q4 2023, well ahead of the 0.06% of impressions they accounted for on Instagram where overlay ads were only introduced in Q2 2023.

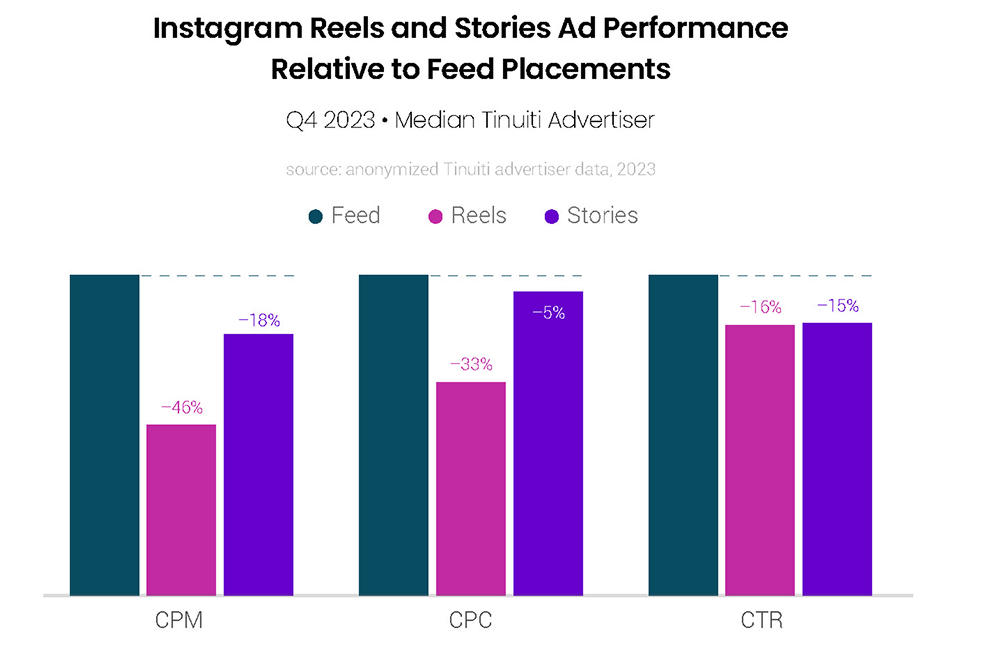
The cost of Reels video ad impressions was 46% lower than that of Instagram Feed ad impressions in the final quarter of 2023, with the cost of clicks coming in 33% lower. Stories ads also have a meaningfully lower CPM than Feed ads, but CPC was just 5% lower, as the difference in CPM is largely the result of the difference in expected CTR for the two placements. It remains the case that Reels video CPC should grow closer to Feed over time, but advertisers are still a ways away from that.
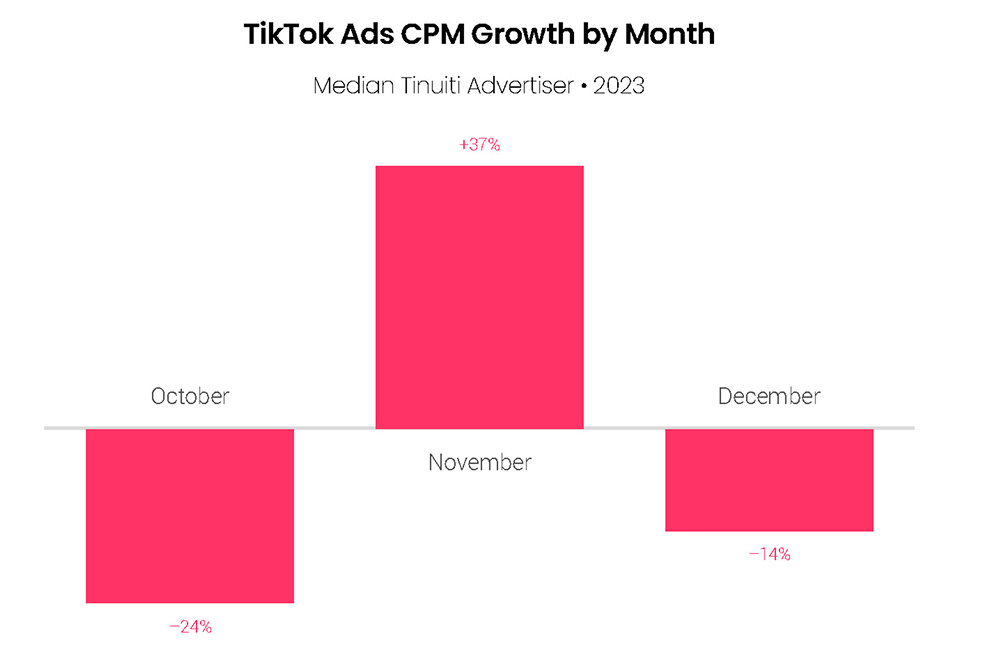
Spending on TikTok advertising grew 64% year over year for the median Tinuiti advertiser in Q4 2023, the fastest growth observed since the previous Q4 when spend grew a whopping 81%. Impression growth more than doubled from 21% in Q3 2023 to 44% in Q4. TikTok CPM rose 14% in the final quarter, the fastest pricing growth observed since the first quarter of 2023 after two straight quarters of year-over-year CPM declines in the middle of the year, as brands ramped up spending on the platform to reach holiday shoppers.

The cost of TikTok ad impressions soared 37% year over year for the median Tinuiti advertiser in November, a huge acceleration from the 24% year-over-year decline observed in October. CPM growth then quickly fell back to negative territory in December, finishing the year down 14% compared to the same month last year. Importantly, ad pricing is affected not only by the competitive forces impacting ad auctions, but also by advertisers deploying different ad types over time.
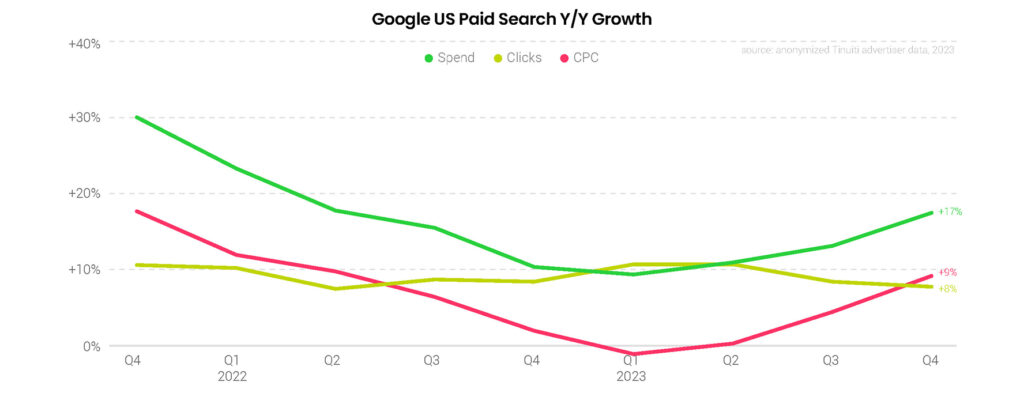
Bolstered by strong holiday demand in November, spending on US Google search ads rose 17% Y/Y in Q4 2023, an acceleration from 13% growth in Q3. Google click growth held steady at 8% Y/Y, while CPC growth accelerated to 9% Y/Y. Google search CPCs fell year over year to begin 2023, but growth has rebounded in the quarters since, particularly for Google’s text ads.
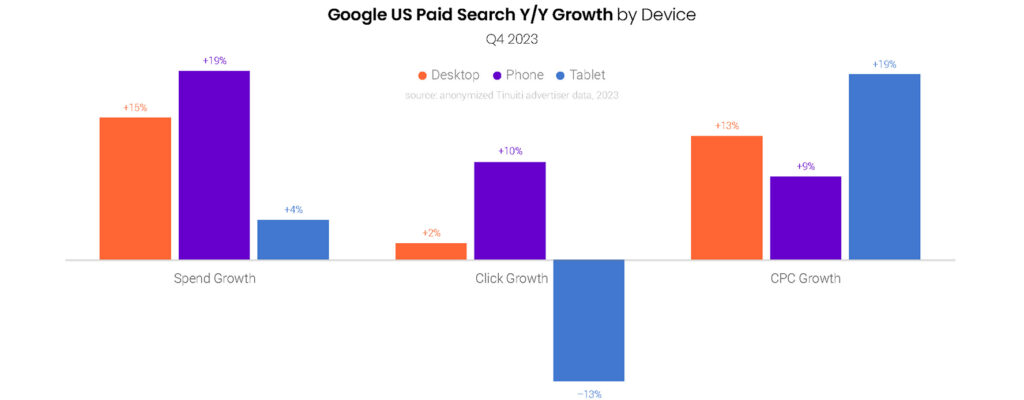
Accounting for over three-quarters of Google search ad clicks, phones delivered 19% Y/Y spending growth in Q4 2023, with clicks up 10% Y/Y and average CPC up 9%. Desktops and laptops saw Google search spending rise 15% Y/Y, but on just a 2% increase in clicks as CPCs rose 13%. Tablets continued to generate a smaller share of Google search traffic, with search ad clicks down 13% Y/Y. Tablet CPCs were up 19% Y/Y though, leading to a 4% increase in spend.
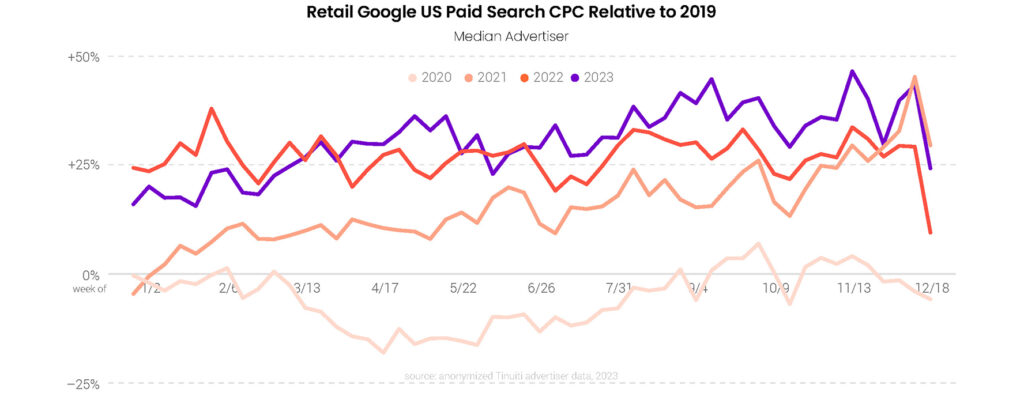
Over the course of Q4 2023, retailers’ Google search ad CPCs were up by an average of 36% over 2019 levels. Google CPCs had dropped in mid-2020, but recovered by the end of that year. CPCs then accelerated sharply during 2021, before stagnating over 2022. After a relatively weak start to 2023, Google CPCs picked up over the year, ultimately hitting a peak of a 47% increase over 2019 levels during the week of Thanksgiving 2023.
Year-over-year growth in the average value of retail orders produced by Google search ads was modest in Q4 2023, averaging a little under 1%. Average order value growth spiked in early 2021 against relatively week comps from the early months of the pandemic. Although official US inflation measures peaked in June 2022, search AOV growth peaked about a year earlier.
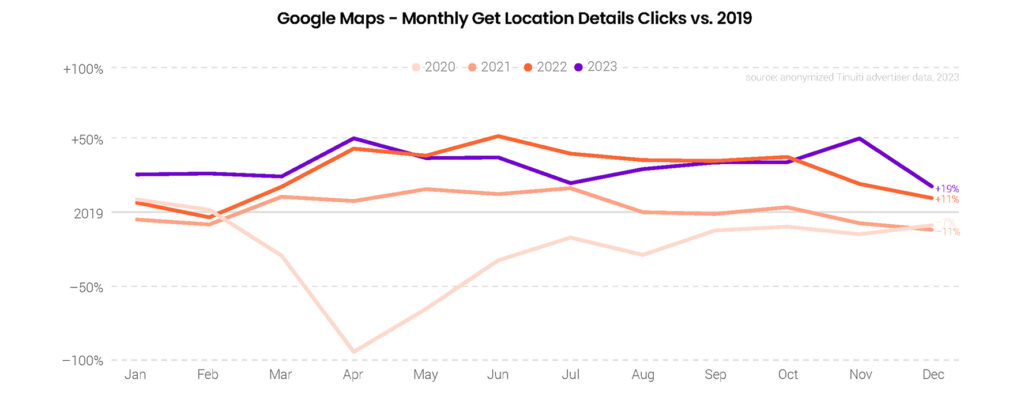
Echoing the trends retailers saw in online sales produced by Google search ads, growth in searches for brick-and-mortar store locations spiked in November, before cooling off in December. Compared to 2019 levels, Get Location Details clicks produced by Google Maps were up 52% in November, up from 36% growth in October. In December, retailers saw just a 19% increase in Get Location Details clicks compared to 2019 levels, which was a low for the year.
Spending on Google text ads was up 16% Y/Y in Q4 2023, up from 11% growth a quarter earlier. Text ad CPC growth accelerated for the third quarter in a row, reaching 16% Y/Y in Q4. At the same time, text ad clicks were roughly flat Y/Y. To a modest extent, traditional text ad campaigns may be getting cannibalized by Performance Max campaigns, which advertisers can use to generate text ads, typically to supplement a traditional text ad program.

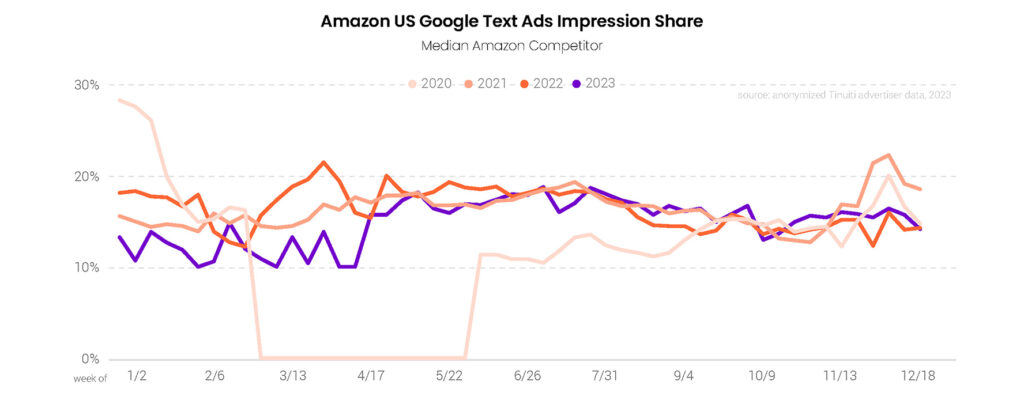
After starting 2023 on a weak note, Amazon’s presence in Google text auctions trended similarly to 2022 for the back half of the year, including throughout the height of the holiday shopping season. While Amazon’s share of text ad impressions spiked in early December of 2020 and 2021, it largely held steady during the same period in 2022 and 2023.
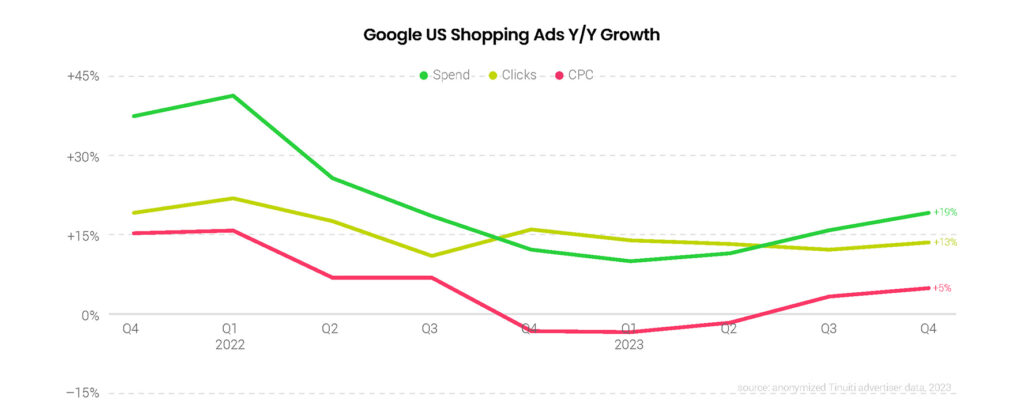
Spending across Google Shopping and Performance Max campaigns was up 19% Y/Y in Q4 2023, an acceleration from 16% growth a quarter earlier. Shopping ad click growth was 13% Y/Y in Q4, a slight increase from Q3. Google shopping CPC growth accelerated to 5% Y/Y in Q4, after having run in negative territory for the first two quarters of the year. The contribution of PMax campaigns to year-over-year shopping spending growth remained relatively strong in Q4 2023 as a number of brands adopted PMax over the course of 2023.
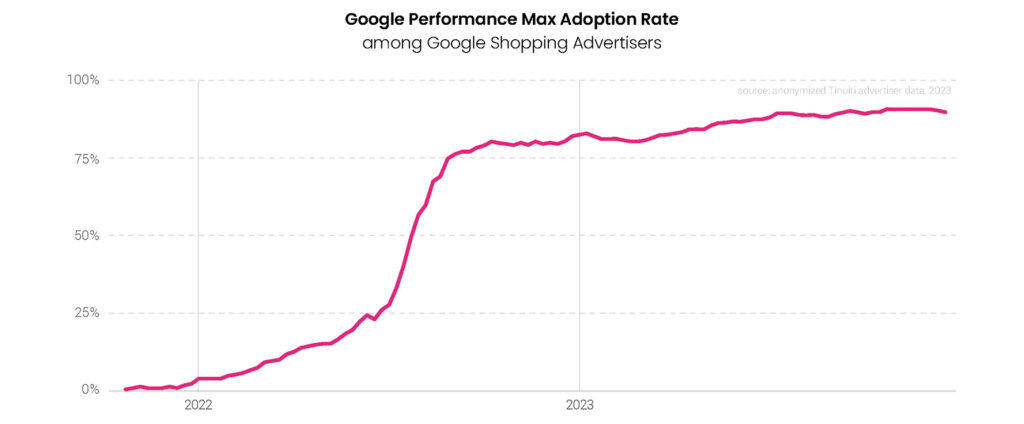
Among retail advertisers running shopping ad listings with Google during the peak of the holiday shopping season in Q4 2023, 91% included Performance Max campaigns in the mix. A year earlier, 80% of retailers had adopted PMax campaigns. After rising over the course of 2023 and with little room left to rise, adoption of Performance Max campaigns does appear to have leveled off.
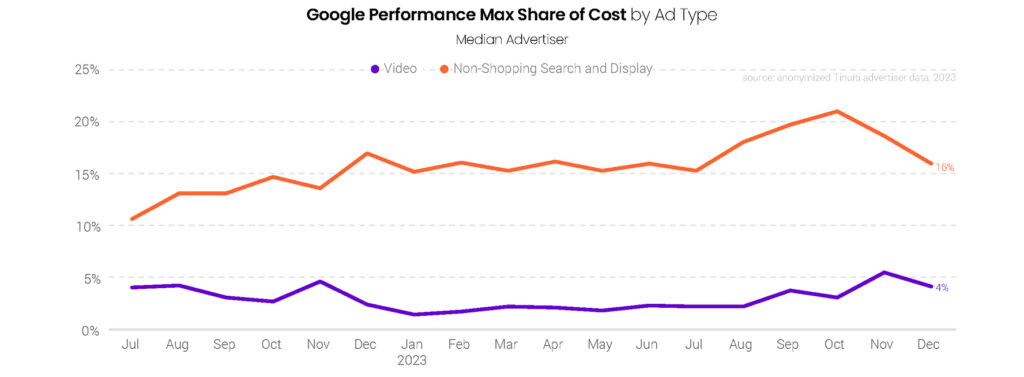
While PMax remains driven primarily by shopping ad listings, the contribution of video and non-shopping display and search ads, including text ads, has been trending higher over time. In Q4 2023, video accounted for 6% of PMax costs in November, an all-time high. The share of PMax spend produced by non-shopping search and display listings hit an all-time high of 21% a month earlier. Over the full quarter, video and other non-shopping inventory contributed an average of 23% of PMax spend, up from 20% in Q3.
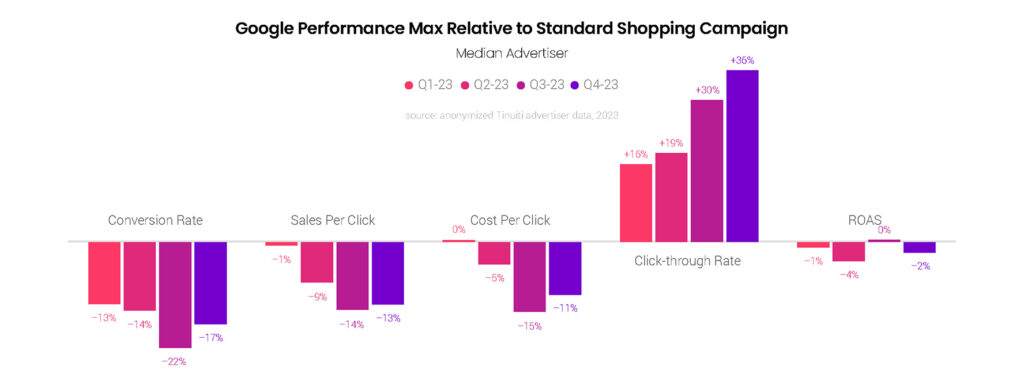
Despite drawing in a larger share of costs from non-shopping inventory in Q4, the performance of PMax campaigns improved relative to standard Google Shopping campaigns across most key metrics. The typical advertiser saw PMax campaigns generate a 13% lower sales per click than standard Shopping campaigns in Q4, but that was up from a 14% deficit a quarter earlier. By keeping CPCs in check, PMax advertisers have been able to achieve a similar ROAS for PMax campaigns as standard Shopping campaigns. In Q4, PMax ROAS was just 2% lower.
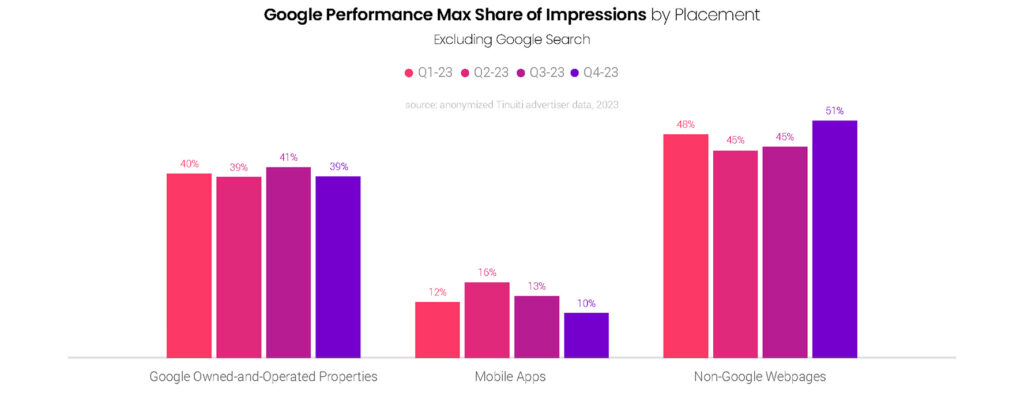
Outside of Google search, other Google owned-and-operated properties accounted for 39% of Performance Max impressions in Q4 2023, which was down slightly from a quarter earlier. Non-Google webpages generated the largest share of these non-search impressions at 51% in Q4, the highest rate brands saw all year. Mobile accounted for 10% of non-search impressions in Q4, down from a high of 16% in Q2.
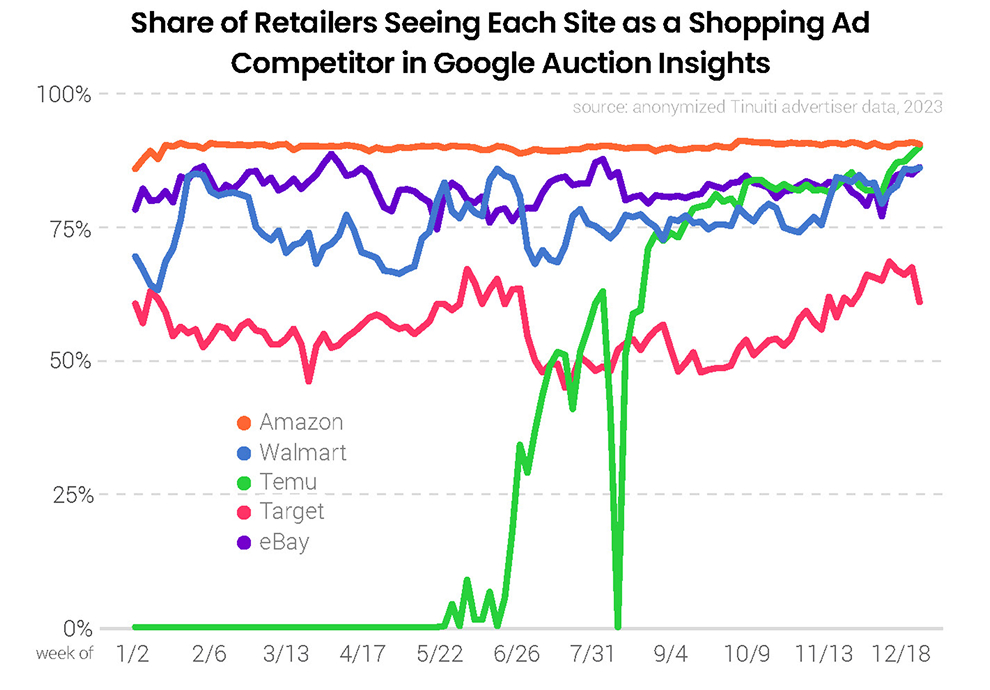
Amazon’s presence in Google Shopping auctions was stronger than it has been in recent years going into the fourth quarter of 2023, but while each of the previous three years saw Amazon push the gas significantly during the peak of the holiday shopping season, Amazon’s share of impressions largely held steady over the course of Q4 2023. Retailers, including Amazon, did face a strong presence from Temu for the first time during the height of the holidays as the relative upstart had only a minimal presence in Shopping auctions at the end of 2022.

In the final week of 2023, 90% of retailers saw Temu listed as a top competitor for Shopping impressions in Google’s Auction Insights report. That rate matched the level that Amazon has consistently achieved over the last two years as the most commonly seen competitor in Shopping auctions. Retailers did not see Temu in Google Shopping auctions at all until the tail end of 2022. Temu’s presence in Shopping auctions ramped up sharply over the first half of 2023, though, and ticked up to close out the year.
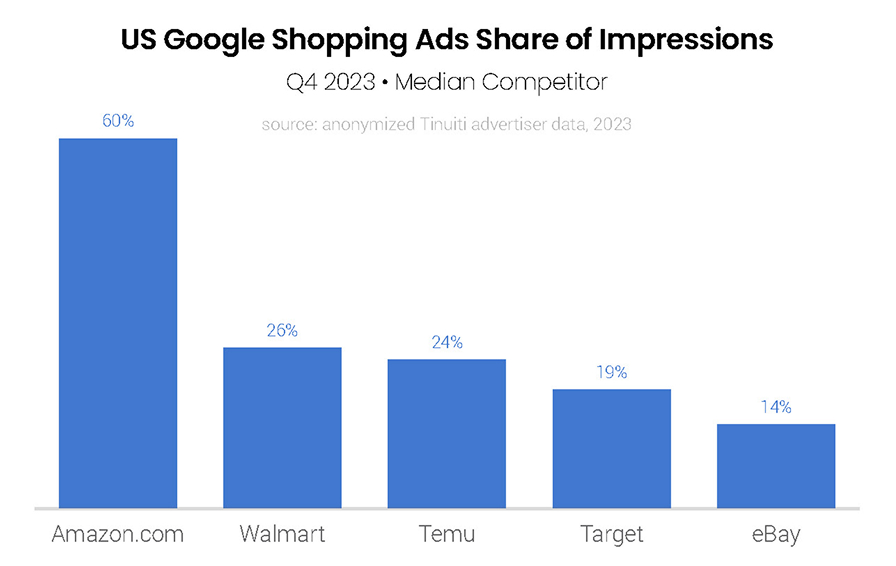
Although Temu competed with nearly as many retailers as Amazon for Google Shopping impressions in Q4 2023, its share of impressions received remained quite a bit lower. When Amazon was eligible for impressions in an auction against a Tinuiti client, its median impression share was just under 60%. For Temu that rate was 24%. Still, Temu’s typical impression share was roughly on par with Walmart and ahead of other major players in the retail space like Target and eBay.
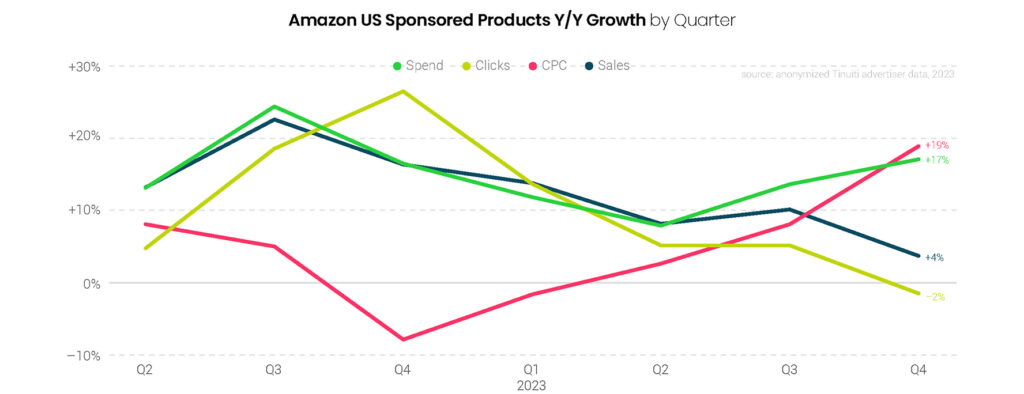
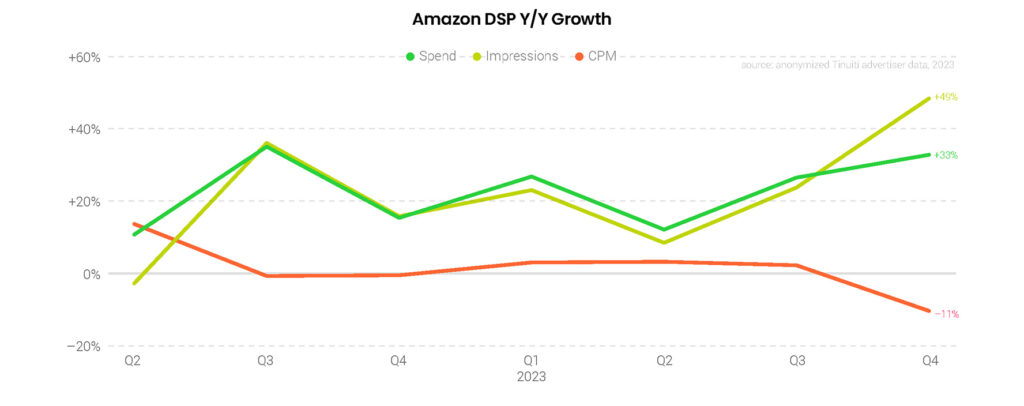
Amazon Sponsored Products advertisers ramped up spend 17% year over year in Q4, up from 14% growth in Q3, as CPC growth more than doubled from 8% in Q3 to 19% in Q4, the highest rate observed since 2021. In Q3 2023, Amazon moved to open the reach of Sponsored Products to off-site inventory on sites and apps like Pinterest. The additional inventory may one day be a meaningful source of traffic, but did not materially impact Q4, as advertisers are seeing only a trickle of clicks from these new sources.
Sponsored Brands spend rose 11% year over year in the final quarter of 2023, up from 1% growth in Q3 and the third straight quarter of acceleration for the second-largest format available through the Amazon Ad Console. CPC growth held steady at 2%, but click growth rebounded from a 1% decline in Q3 to 9% growth in Q4. Sales attributed to the format rose 16%, the second quarter in a row in which sales growth outpaced spend growth.

Advertisers ramped up spending on Amazon Sponsored Display campaigns by 27% year over year in Q4, up from 12% growth in Q3, as CPC growth soared to 25% in the final quarter of the year. This echoes the acceleration in pricing observed for Sponsored Products, although depending on advertiser preference, Sponsored Display ads can be targeted based on the cost of viewable impressions in addition to cost per click.

Advertisers ramped up spending on Amazon Sponsored Display campaigns by 27% year over year in Q4, up from 12% growth in Q3, as CPC growth soared to 25% in the final quarter of the year. This echoes the acceleration in pricing observed for Sponsored Products, although depending on advertiser preference, Sponsored Display ads can be targeted based on the cost of viewable impressions in addition to cost per click.
Amazon advertisers saw Sponsored Products CPC grow at least 16% year over year in each month of Q4, a level of growth not observed on a monthly level since April 2022. Sponsored Brands CPC growth peaked at 6% in November and grew just 2% year over year in the final quarter, compared to 19% growth for Sponsored Products. Still, Q4 marked the strongest Sponsored Brands CPC growth on a quarterly level since Q3 2022.

In Q4 2023, the median advertiser in each of the thirteen major product categories tracked in this report showed positive Amazon Sponsored Products CPC growth year over year, up from eleven out of thirteen in Q3 2023. Further, CPC growth topped 10% for eleven out of thirteen product categories in Q4, up from seven the quarter prior. Sponsored Products CPC growth across Tinuiti’s advertisers hit 19% in Q4 2023, the fastest growth since way back in Q4 2021.

In Q4 2023, the median advertiser in each of the thirteen major product categories tracked in this report showed positive Amazon Sponsored Products CPC growth year over year, up from eleven out of thirteen in Q3 2023. Further, CPC growth topped 10% for eleven out of thirteen product categories in Q4, up from seven the quarter prior. Sponsored Products CPC growth across Tinuiti’s advertisers hit 19% in Q4 2023, the fastest growth since way back in Q4 2021.
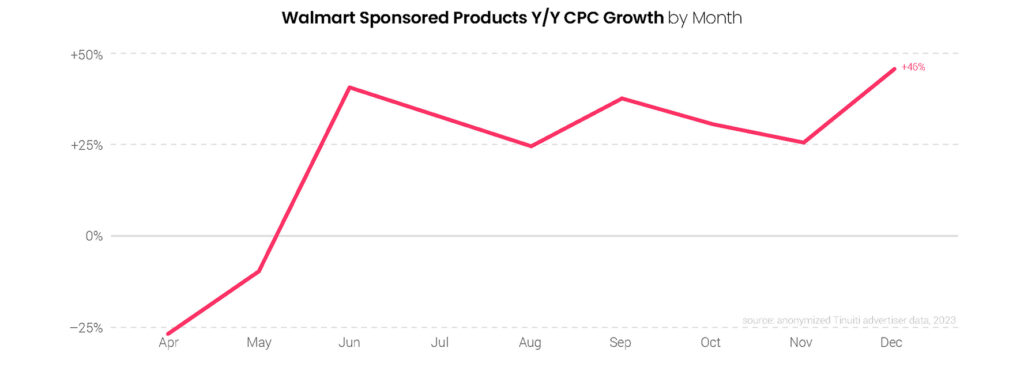
The average CPC of Walmart Sponsored Products ads rose 46% year over year in December, the strongest growth of the year, as competition among advertisers heated up to attract high-converting customers during the holiday shopping season. CPC rose at least 25% year over year in each of the last seven months, as pricing recovered following the Q2 2022 update to switch from a first-price auction to a second-price auction, which sent CPC crashing down for most advertisers.
The average CPC of Walmart Sponsored Products ads rose 46% year over year in December, the strongest growth of the year, as competition among advertisers heated up to attract high-converting customers during the holiday shopping season. CPC rose at least 25% year over year in each of the last seven months, as pricing recovered following the Q2 2022 update to switch from a first-price auction to a second-price auction, which sent CPC crashing down for most advertisers.

The average CPC of Walmart Sponsored Products ads rose 46% year over year in December, the strongest growth of the year, as competition among advertisers heated up to attract high-converting customers during the holiday shopping season. CPC rose at least 25% year over year in each of the last seven months, as pricing recovered following the Q2 2022 update to switch from a first-price auction to a second-price auction, which sent CPC crashing down for most advertisers.

The average CPC of Walmart Sponsored Products ads rose 46% year over year in December, the strongest growth of the year, as competition among advertisers heated up to attract high-converting customers during the holiday shopping season. CPC rose at least 25% year over year in each of the last seven months, as pricing recovered following the Q2 2022 update to switch from a first-price auction to a second-price auction, which sent CPC crashing down for most advertisers.
The average CPC of Walmart Sponsored Products ads rose 46% year over year in December, the strongest growth of the year, as competition among advertisers heated up to attract high-converting customers during the holiday shopping season. CPC rose at least 25% year over year in each of the last seven months, as pricing recovered following the Q2 2022 update to switch from a first-price auction to a second-price auction, which sent CPC crashing down for most advertisers.
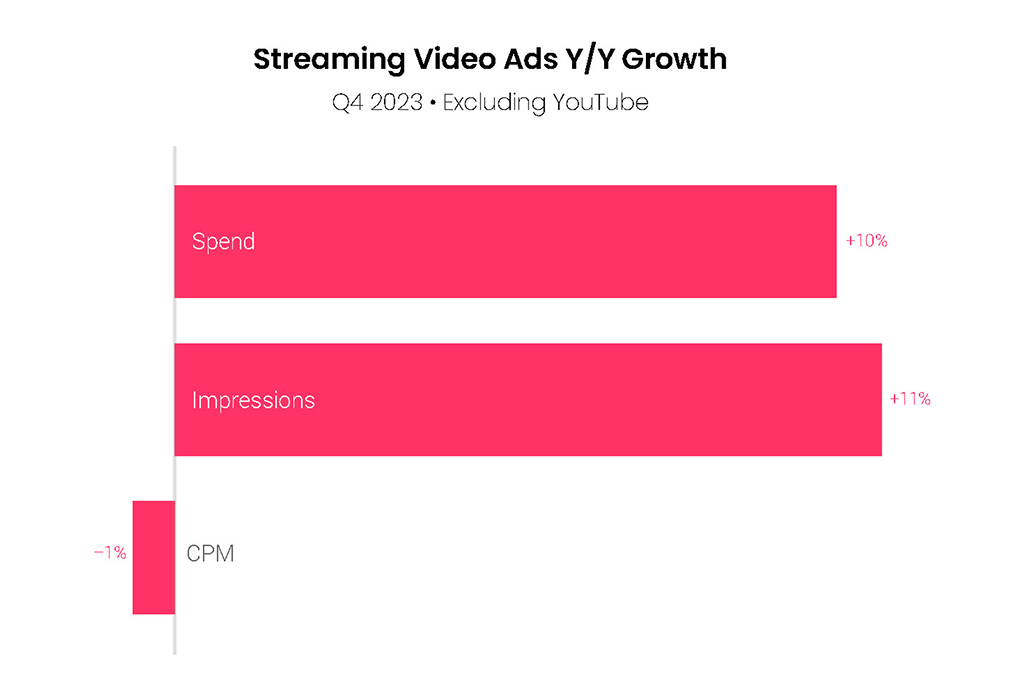
For streaming video ads outside of YouTube, including on platforms like Hulu, Netflix, and Max, advertiser spending rose 10% Y/Y in Q4 2023, up from 7% a quarter earlier. With more premium inventory coming online in recent quarters, streaming video CPM growth was fairly stable over 2023 even as CPMs fell by as much as 24% for YouTube. In Q4 2023, streaming CPMs fell 1% Y/Y, compared to the 6% decline for YouTube.
For streaming video ads outside of YouTube, including on platforms like Hulu, Netflix, and Max, advertiser spending rose 10% Y/Y in Q4 2023, up from 7% a quarter earlier. With more premium inventory coming online in recent quarters, streaming video CPM growth was fairly stable over 2023 even as CPMs fell by as much as 24% for YouTube. In Q4 2023, streaming CPMs fell 1% Y/Y, compared to the 6% decline for YouTube.
For streaming video ads outside of YouTube, including on platforms like Hulu, Netflix, and Max, advertiser spending rose 10% Y/Y in Q4 2023, up from 7% a quarter earlier. With more premium inventory coming online in recent quarters, streaming video CPM growth was fairly stable over 2023 even as CPMs fell by as much as 24% for YouTube. In Q4 2023, streaming CPMs fell 1% Y/Y, compared to the 6% decline for YouTube.
For streaming video ads outside of YouTube, including on platforms like Hulu, Netflix, and Max, advertiser spending rose 10% Y/Y in Q4 2023, up from 7% a quarter earlier. With more premium inventory coming online in recent quarters, streaming video CPM growth was fairly stable over 2023 even as CPMs fell by as much as 24% for YouTube. In Q4 2023, streaming CPMs fell 1% Y/Y, compared to the 6% decline for YouTube.
For streaming video ads outside of YouTube, including on platforms like Hulu, Netflix, and Max, advertiser spending rose 10% Y/Y in Q4 2023, up from 7% a quarter earlier. With more premium inventory coming online in recent quarters, streaming video CPM growth was fairly stable over 2023 even as CPMs fell by as much as 24% for YouTube. In Q4 2023, streaming CPMs fell 1% Y/Y, compared to the 6% decline for YouTube.

For streaming video ads outside of YouTube, including on platforms like Hulu, Netflix, and Max, advertiser spending rose 10% Y/Y in Q4 2023, up from 7% a quarter earlier. With more premium inventory coming online in recent quarters, streaming video CPM growth was fairly stable over 2023 even as CPMs fell by as much as 24% for YouTube. In Q4 2023, streaming CPMs fell 1% Y/Y, compared to the 6% decline for YouTube.

For streaming video ads outside of YouTube, including on platforms like Hulu, Netflix, and Max, advertiser spending rose 10% Y/Y in Q4 2023, up from 7% a quarter earlier. With more premium inventory coming online in recent quarters, streaming video CPM growth was fairly stable over 2023 even as CPMs fell by as much as 24% for YouTube. In Q4 2023, streaming CPMs fell 1% Y/Y, compared to the 6% decline for YouTube.
For streaming video ads outside of YouTube, including on platforms like Hulu, Netflix, and Max, advertiser spending rose 10% Y/Y in Q4 2023, up from 7% a quarter earlier. With more premium inventory coming online in recent quarters, streaming video CPM growth was fairly stable over 2023 even as CPMs fell by as much as 24% for YouTube. In Q4 2023, streaming CPMs fell 1% Y/Y, compared to the 6% decline for YouTube.
For streaming video ads outside of YouTube, including on platforms like Hulu, Netflix, and Max, advertiser spending rose 10% Y/Y in Q4 2023, up from 7% a quarter earlier. With more premium inventory coming online in recent quarters, streaming video CPM growth was fairly stable over 2023 even as CPMs fell by as much as 24% for YouTube. In Q4 2023, streaming CPMs fell 1% Y/Y, compared to the 6% decline for YouTube.
Check out our most recent Digital Ads Benchmark Report for more exclusive insights.
