Digital Ads Benchmark Report Q2 2025
Quarterly Trends Across Google, Meta, Amazon, and More
Quarterly Trends Across Google, Meta, Amazon, and More
The Tinuiti Digital Ads Benchmark Report is based on anonymized performance data from advertising programs under Tinuiti management, with annual digital ad spend under management totaling over $4 billion. Samples are restricted to those programs that have remained active and maintained a consistent strategy over the time periods studied. Unless otherwise noted, all figures are based on same-client growth. The trends and figures included are not meant to represent the official performance of any advertising platform or the experiences of every advertiser.
Note: The data below is from Q2 2025. Head here to see our most recent report.
Tinuiti is the largest independent performance marketing firm across Streaming TV and the Triopoly of Google, Facebook, and Amazon, with $4 billion in digital media under management and over 1,000 employees.
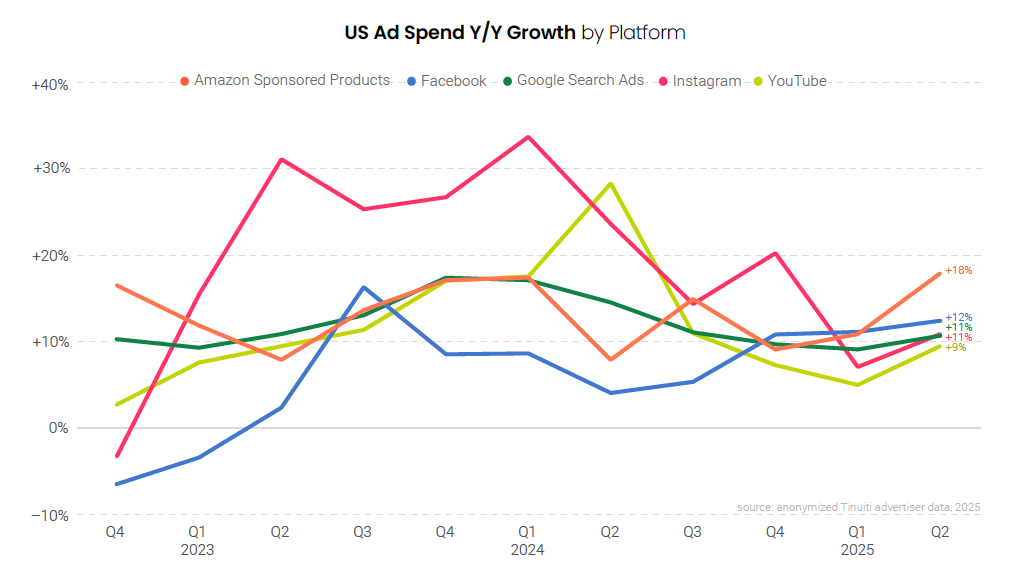
Ad spend growth accelerated across Google paid search, Meta, Amazon Sponsored Products, and YouTube in the second quarter, in line with expectations as many platforms saw softer year-ago comparisons in Q2 than in Q1.
While tariffs are directly impacting the spend of some advertisers, in aggregate they have not significantly influenced ad investment to this point. Many brands have taken other measures such as renegotiating contracts and shifting production where possible to protect margin while maintaining ad budgets.
At least part of the reason ad spend has held up is the rollback of the most severe tariffs, with the once 145% rate on Chinese goods reduced to 30% in May, which clearly had a meaningful impact on China-based brands like Shein and Temu. Both Shein and Temu appeared to pause Google shopping ads entirely in mid-April, seemingly as a result of the end of the de minimis exemption. Shein reactivated a little over a month later once the tariff rate was revised to 30%, and Temu started to reappear sparingly in Google shopping Auction Insights reports at the end of June.
There remains significant uncertainty surrounding the ultimate shape of US tariffs and whether any rates established will be more than temporary given the administrations rapidly shifting policies over the last several months.
As was the case in Q1, uncertainty regarding US policy is already harming at least one platform in the form of TikTok, with spend down 20% year over year in Q2 for the median same-store advertiser. While advertisers are not walking away from TikTok, many are diversifying their social media investment to other platforms as the ultimate fate of the Chinese-owned video app remains in limbo.
While advertisers continue to grow investment in YouTube video campaigns, they are also increasingly accessing Google’s video inventory through Demand Gen campaigns, with about half of Demand Gen spend going to video in June. Demand Gen spend rose 23% year over year in Q2, as Google’s April cutoff to create new Video Action Campaigns pushed more spend into Demand Gen.
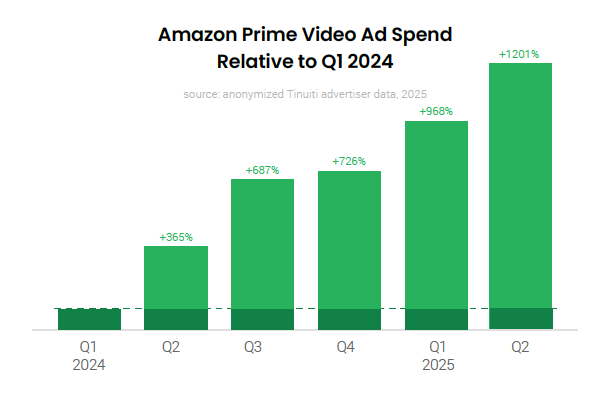
Elsewhere in the world of ad-supported streaming video, brand adoption of Prime Video ads continues to explode, with spend on the platform up 22% from Q1 to Q2. Competitive CPM rates and advanced audience targeting are making Prime Video ads attractive to both endemic brands that sell products directly on Amazon and non-endemic brands that don’t.
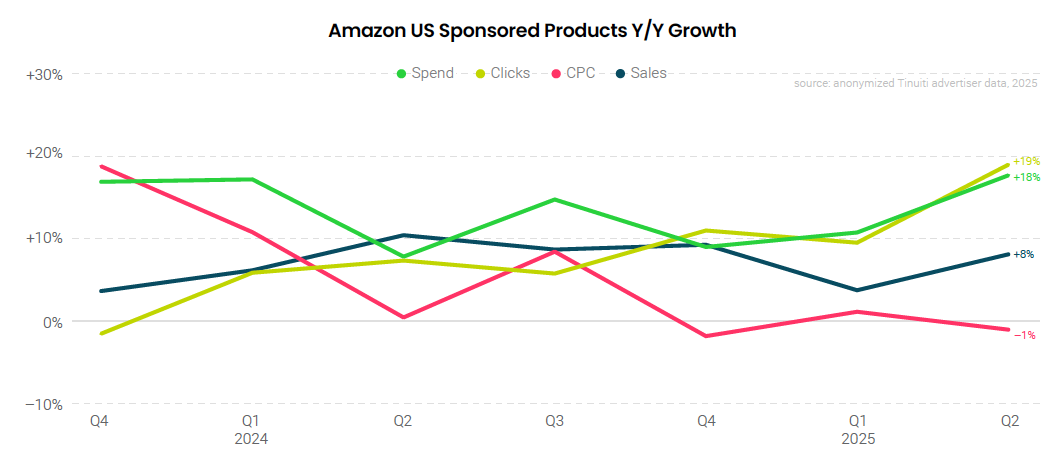
For query-driven ad formats such as Amazon Sponsored Products and Google paid search, ad pricing slowed in the second quarter and increases in click volume drove spend growth, as economic uncertainty did not appear to dampen consumer search demand. Amazon Sponsored Products click growth soared to 19%, the strongest growth observed for the format since Q4 2022, while Google paid search click growth was the highest it’s been since Q4 2023.
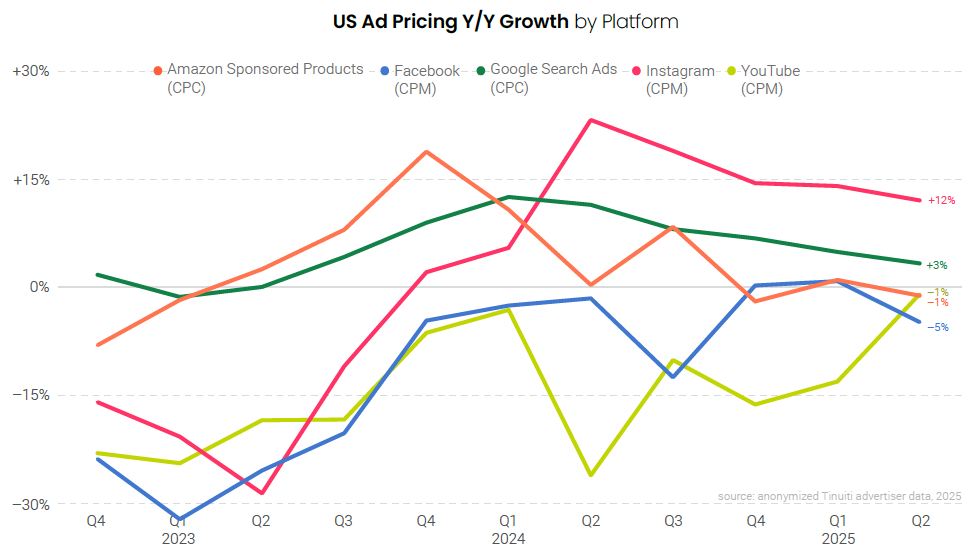
YouTube CPM fell just 1% year over year in Q2, the smallest decline for YouTube video campaigns since Q1 2022, as advertisers ran up against much weaker pricing comps in the second quarter. YouTube Shorts ads have grown significantly over the last couple of years, and while Shorts ads have seen a below-average CPM, they contributed 18% of segmented spending in Q2 2025, which was second only to skippable in-stream ads.
Ad investment in Meta properties rose 12% year over year in Q2, accelerating from 11% growth in the first quarter of the year. Impressions rose 13% in the second quarter, the fastest growth observed since Q1 2024, while CPM was flat compared to the same quarter last year. Meta announced in June that ads will be coming to WhatsApp, adding a new source of ad impressions for advertisers to tap into. Ads on Messenger, Meta’s other messaging app, currently only account for 0.003% of Meta advertising spend.
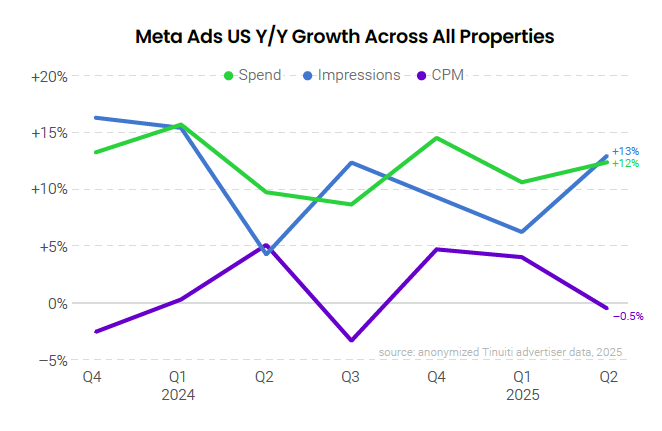
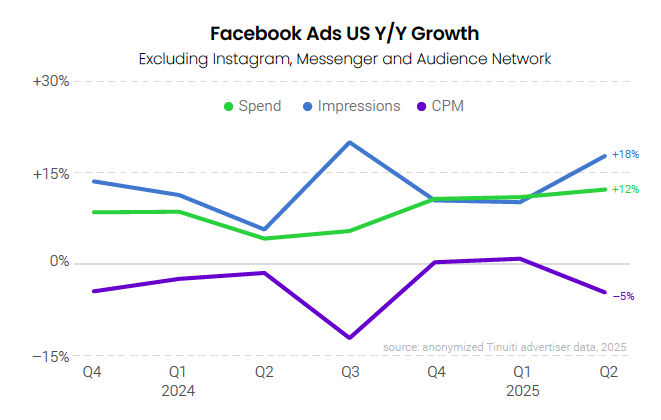
Advertising spend on Facebook, excluding Instagram, Messenger, and the Audience Network, rose 12% year over year in Q2, an acceleration from 11% in Q1. Impressions on Meta’s flagship app/ website jumped 18% year over year in the second quarter, the strongest growth observed since last Q3, while CPM fell 5%. Growth in newer inventory sources like Reels has put downward pressure on Facebook CPM in recent quarters.
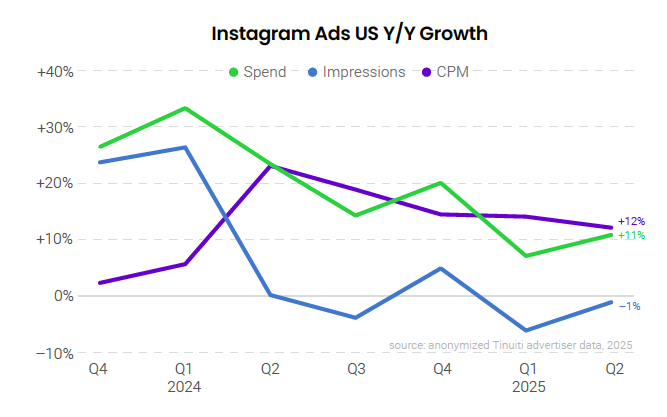
Instagram ad spend rose 11% year over year in Q2, with a 1% decline in impressions and 12% increase in CPM. Spend growth slowed from 34% in Q1 2024 to 24% in Q2 2024, making for easier year-ago comparisons in the second quarter. Average CPM rose 12% year over year in Q2, the fifth straight quarter of double-digit increases but the slowest rate of growth since Q1 2024.
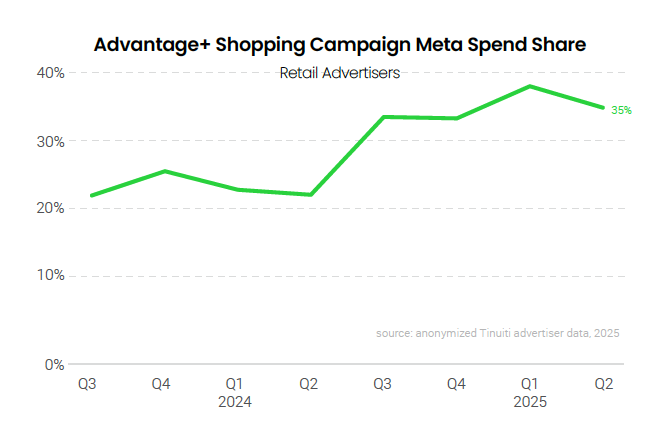
The share of total retail and ecommerce Meta ad spend going to Advantage+ shopping campaigns slipped from 38% in Q1 to 35% in Q2, but was still up from 23% spend share last Q2 and ASCs have now accounted for at least a third of ad spend for four straight quarters. Still, Meta’s AI-powered campaign type hasn’t quite risen to the level of usage that Google’s Performance Max campaigns have.
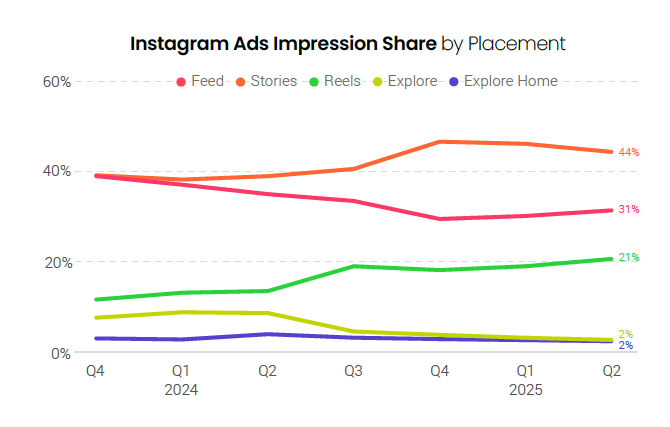
Reels ads accounted for 21% of all Instagram ad impressions in Q2 2025, up from 13% in Q2 2024 and the highest share ever observed for Tinuiti advertisers. Stories ads continue to account for a plurality of all Instagram ad impressions with 44% share in the second quarter. Feed ads, once the placement with the largest ad impression share on Instagram, accounted for 31% of impressions in Q2.
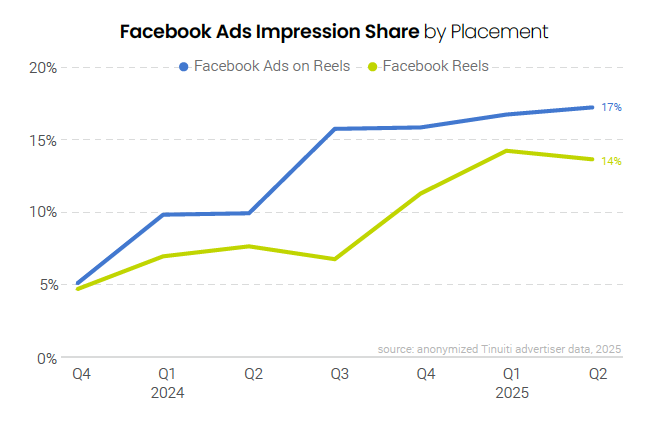
Reels video ads accounted for 14% of Facebook ad impressions in Q2 2025 and Ads on Reels, formerly known as Reels Overlay ads, were responsible for another 17%, the same figures observed for these formats in Q1. While Reels share was steady from Q1 to Q2, the total share of Facebook ad impressions attributed to Reels inventory rose from 17% last Q2 to 31% in Q2 2025, eclipsing the 21% of Instagram ad impressions coming from Reels.
The median Tinuiti advertiser active on TikTok throughout both Q2 2024 and Q2 2025 reduced spend on the platform by 20% year over year, as uncertainty surrounding TikTok’s future continues to impact advertiser plans on the platform. However, 36% of advertisers increased investment year over year in Q2, with an average increase among this group of 107%, as some brands continue to lean into TikTok despite the uncertainty.
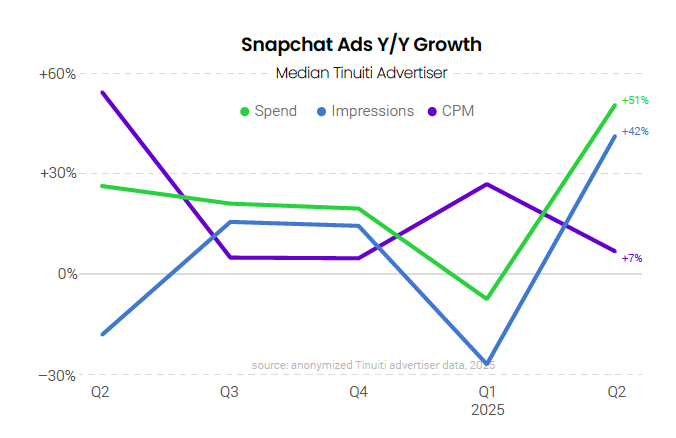
After an 8% decline in Q1, the median advertiser active on Snapchat in both Q2 2024 and Q2 2025 increased investment on the platform by 51% year over year in the second quarter, the strongest growth of the last five quarters. With so much uncertainty surrounding the future of TikTok in the United States, many advertisers are increasingly ramping up investment in other social platforms like Snapchat in an effort to diversify their efforts.
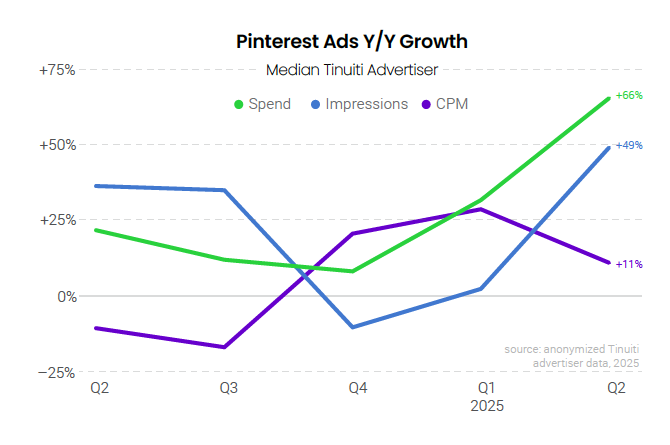
Advertising spend on Pinterest jumped 66% year over year for the median advertiser active on the platform since at least Q2 2024, with a 49% increase in impressions and 11% rise in average CPM. Pinterest’s Performance+ suite of AI and automation tools is helping to drive up investment, with early adopters driving strong results through features like the Performance+ ROAS bidding tool and Performance+ creative.
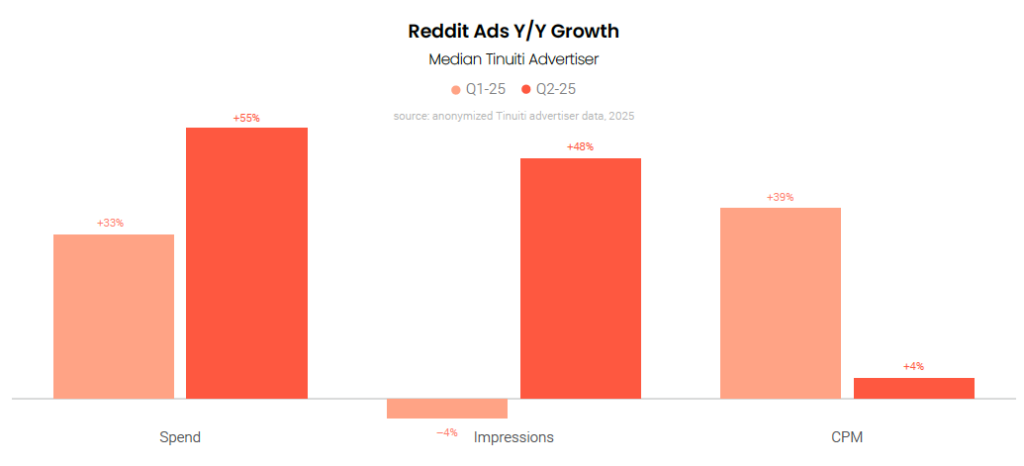
Investment in Reddit advertising jumped 55% year over year for the median advertiser active on the platform in both Q2 2024 and Q2 2025, an acceleration from 33% growth in the first quarter. In addition to strong growth among advertisers that have been on the platform for a while, the number of brands advertising on Reddit jumped 28% year over year in Q2, as Reddit continues to attract net new advertisers looking to tap into its distinct audience and diversify their social spend.
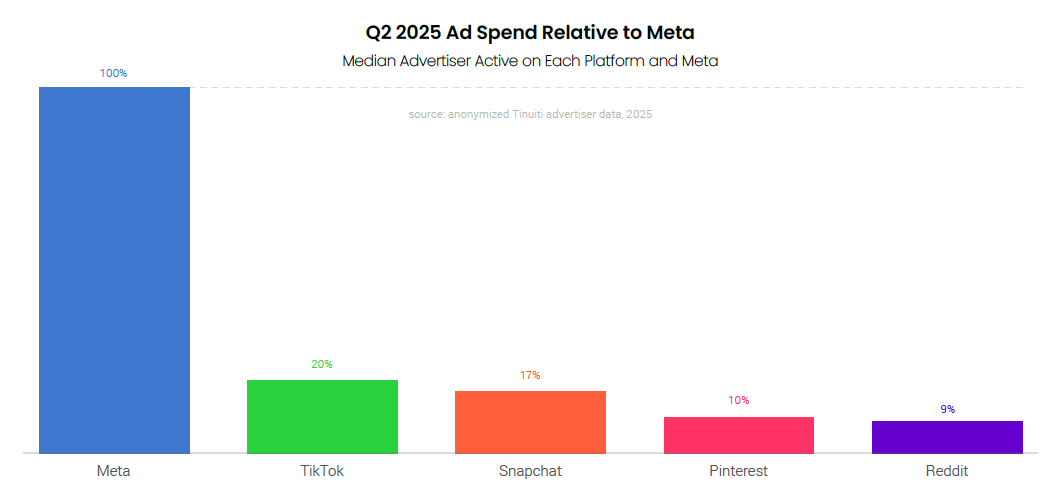
The median advertiser active on both Reddit and Meta in Q2 2025 spent 9% as much on Reddit as on Meta for the quarter, while Pinterest and Snapchat advertisers spent 10% and 17% as much as on Meta, respectively. Despite recent year-over-year declines in spend for many TikTok advertisers, the median brand active on TikTok and Meta still spent 20% as much on TikTok as on Meta in the second quarter as it continues to be an important part of social media budgets for many.
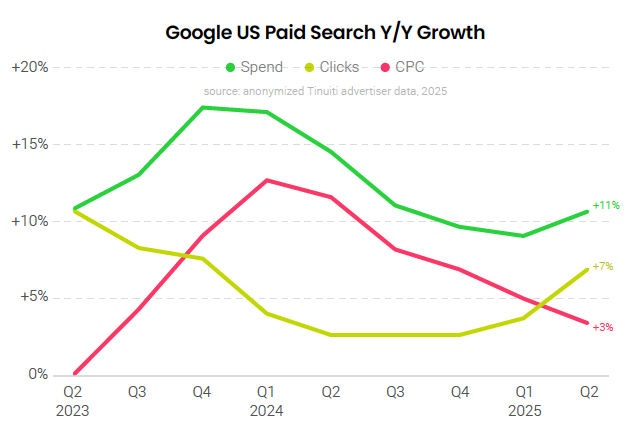
Spending on Google paid search ads was up 11% year over year in Q2 2025, up from 9% growth a quarter earlier. Click growth accelerated to 7% year over year, while CPC growth slowed to 3%. While year-ago comps for Google were weaker in Q2, Tinuiti clients also saw relatively strong click growth from shopping inventory as some of the strongest competitors for shopping impressions either pulled back on their presence in Google shopping auctions or appeared to withdraw from them entirely.
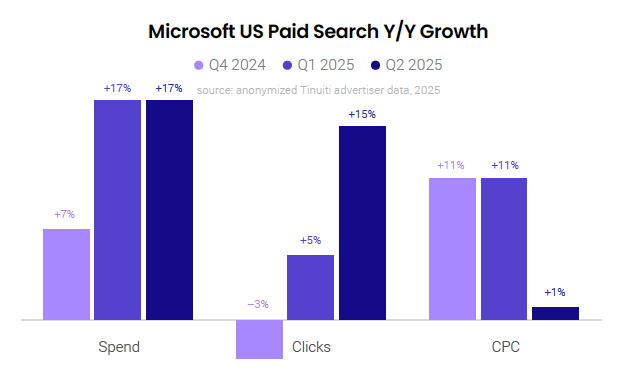
Spending on Microsoft search ads was up 17% year over year in Q2 2025, which matched the results advertisers saw in Q1 2025. Across text and shopping formats, including Microsoft’s version of Performance Max campaigns, Microsoft paid search clicks were up 15% year over year in Q2, up sharply from 5% growth a quarter earlier. CPC growth, however, decelerated sharply from 11% in Q1 2025 to just 1% in Q2.
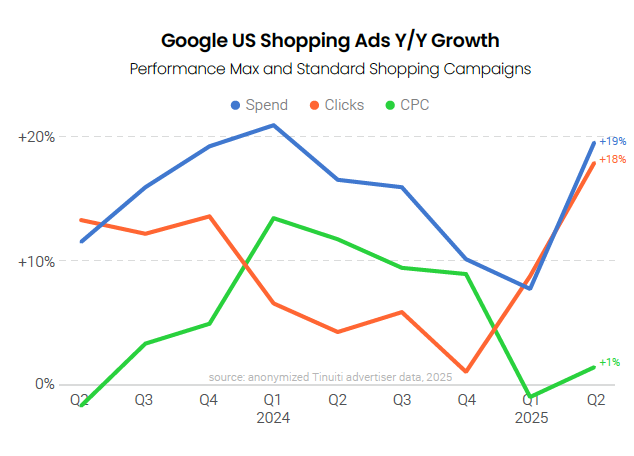
Advertiser spending on Google shopping inventory across both standard Shopping and Performance Max campaigns was up 19% year over year in Q2, compared to just 8% in Q1. Shopping ad clicks rose 18% for Tinuiti advertisers, up from 9% a quarter earlier, while average CPC grew just 1%. Facing heavy new tariffs in the US, both Temu and Shein appeared to stop running Google shopping ads in April. Over late May through mid-June, Amazon also appeared to significantly pull back on Google shopping ads.
With US tariffs on China skyrocketing and the de minimis exemption set to expire just weeks later on May 2nd, Temu abruptly dropped out of US Google shopping auctions in early April with Shein following suit a few days later. Since May, Walmart has also seen a lower share of Google shopping impressions, but its drop has been less precipitous. After the US lowered the tariff rate on Chinese goods from 145% to 30% in mid-May, Shein returned to Google auctions, but Temu did not. Later, from May 21st through June 8th, Amazon also appeared to heavily cut its investment in shopping listings, but that timing does not coincide as neatly with developments with tariffs. In the last week of Q2, Temu did begin to pop back up in some shopping auctions, but its impression share against the median retailer was still effectively zero.
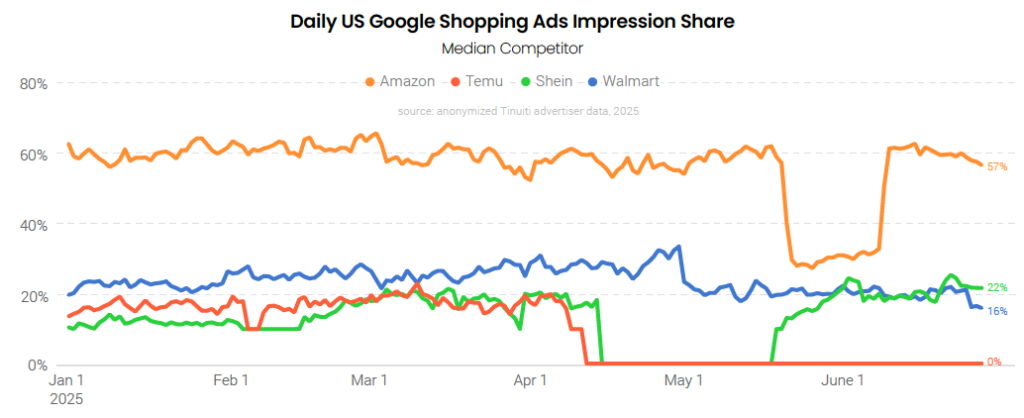
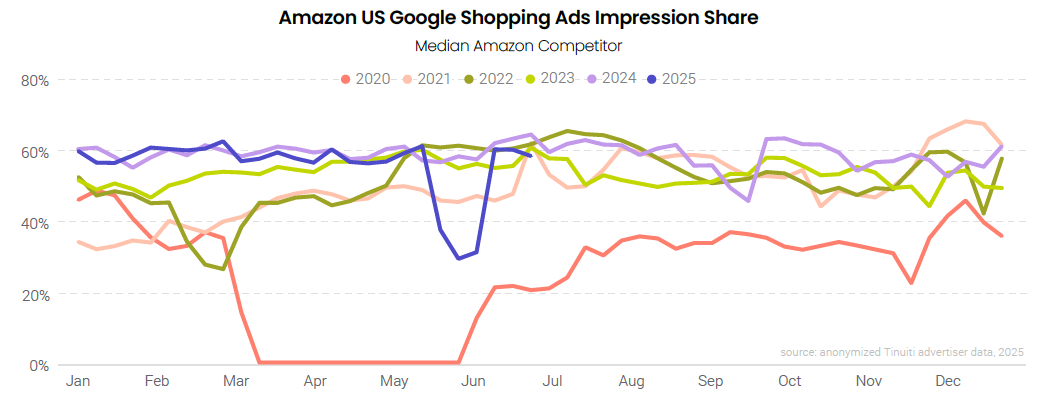
Amazon’s share of Google shopping ad impressions against the median retailer fell 32 points from the week of May 12th to the week of May 26th, which was the largest two-week impression share drop for Amazon since March 10th 2020. At 29%, Amazon’s share of impressions during the week of May 26th was the lowest it has been since another unusual share drop which took place in February 2022. While Amazon has exposure to increased tariffs on Chinese goods, its pullback and return to full strength the week of June 9th occurred during a relatively stable period for tariff policy, so other considerations may have been at play.
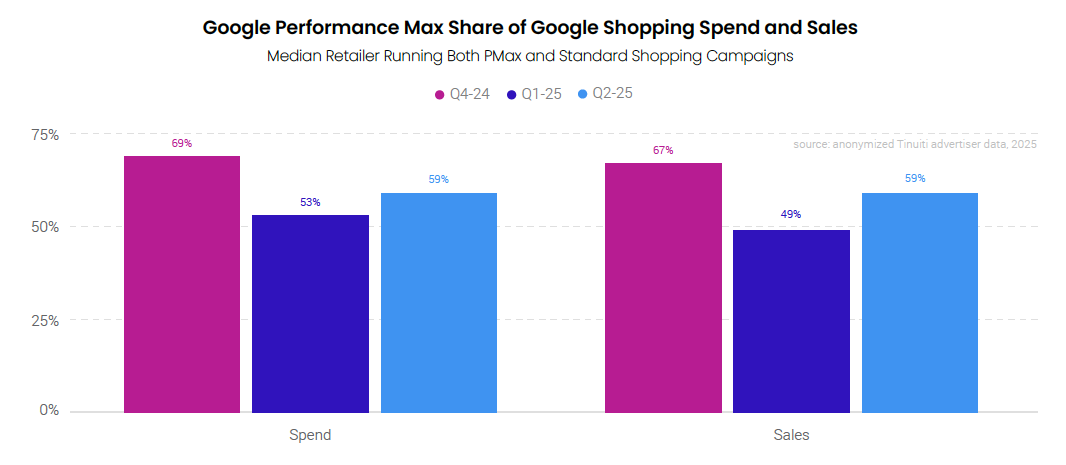
After falling from Q4 2024 to Q1 2025, the share of Google shopping ad spending attributed to Performance Max campaigns picked back up in Q2. For advertisers running both PMax and standard Shopping campaigns, PMax accounted for 59% of shopping spending in Q2, up from 53% a quarter earlier. PMax also contributed 59% of revenue generated by Google shopping listings as return on ad spend for PMax was comparable to that of standard Shopping campaigns.
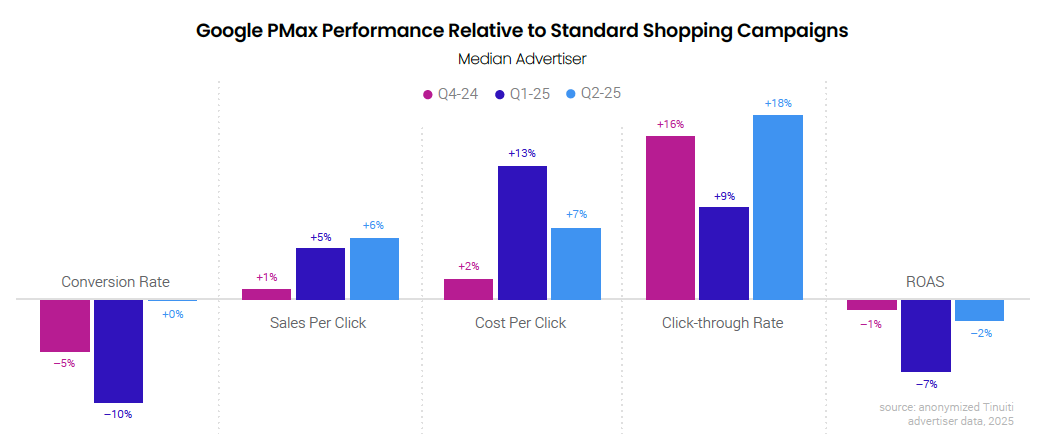
Although they produce impressions from a more diverse range of inventory, PMax campaigns have generated fairly comparable results to standard Shopping campaigns across key metrics. In Q2, ROAS for PMax was just 2% lower than that for standard Shopping campaigns for the median advertiser running both, while conversion rates were nearly equal. PMax has historically seen higher click-through rates than standard Shopping campaigns, however, and in Q2 that advantage was 18%.
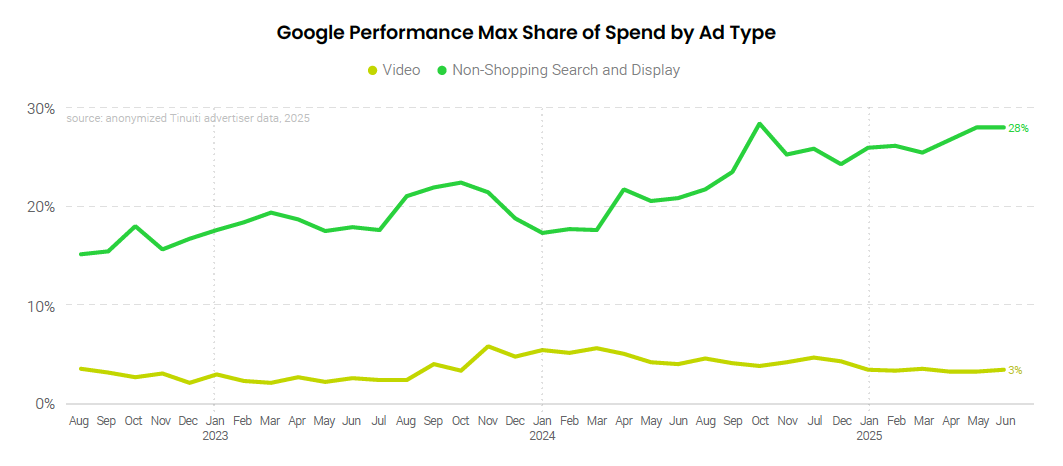
The share of Performance Max spending produced by non-shopping search and display inventory trended higher over Q2 2025. In June, this segment accounted for 28% of Pmax spending, just under an all-time of 29% during a spike in September 2024. Advertisers have seen less movement in the spend share for video ad inventory, which has held steady between 3.2% and 3.5% over the course of 2025.
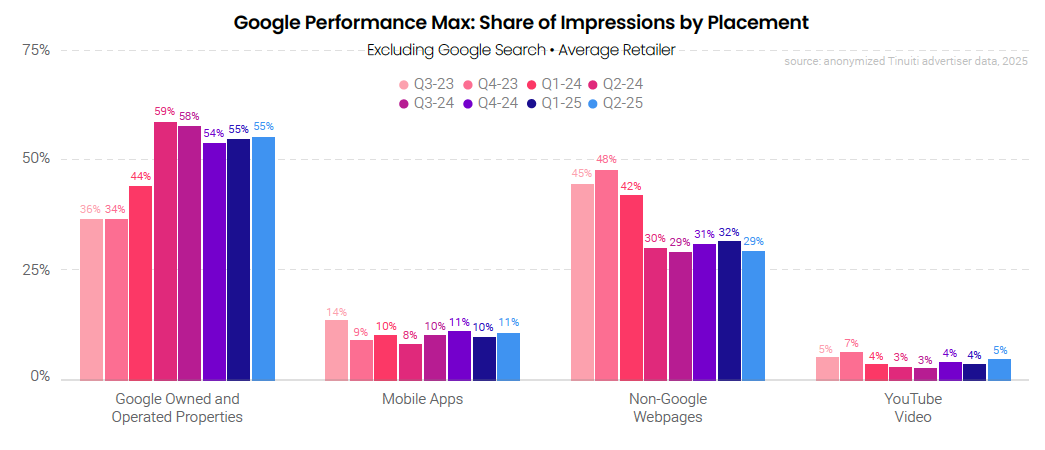
For Performance Max impressions occurring outside of Google search, 55% were on Google owned and operated properties other than YouTube in Q2 2025, the same rate as a quarter earlier. Non-Google webpages produced 29% of PMax placement impressions in Q2 2025, a rate that has been down since early 2024 when Google began applying account-level placement exclusions to the Search partner network. Mobile apps contributed 11% of placement impressions in Q2, while YouTube video contributed 5%.
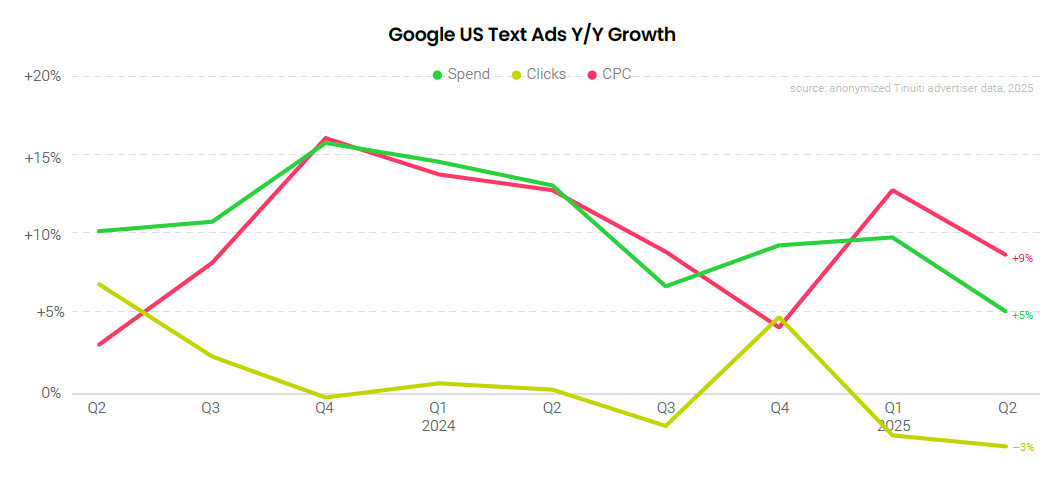
While Google shopping advertisers saw strong acceleration in click growth against weaker comps and with large competitors pulling back, advertisers running Google text ads saw click growth remain in negative territory in Q2 2025. Google text ad clicks fell 3% year over year in Q2, the same decline observed in Q1. Text CPC growth decelerated from 13% in Q1 to 9% in Q2, with spending growth coming in lower in Q2 at 5% year over year.
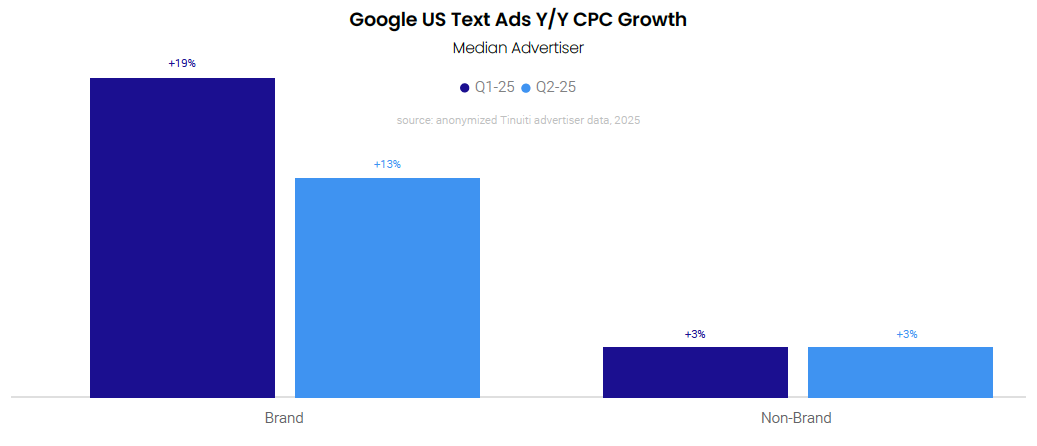
Google advertisers running text ads on their own brand names saw the average CPC for those ads rise 19% year over year in Q1 2025 even as non-brand CPCs were up just 3% year over year. In Q2, brand CPC growth still significantly outpaced non-brand CPC growth, but the gap was narrower. Non-brand CPC growth remained at 3% year over year in Q2, while brand CPC growth decelerated to 13%.
Investment in Amazon’s flagship search format rose 18% year over year in Q2, accelerating from 11% in Q1 as advertisers ran up against weaker year-ago comparisons in the second quarter. Click growth jumped to 19%, the highest growth observed for the format since way back in Q4 2022. Average CPC continues to hold roughly steady year over year, with a 1% decline in Q2 following 1% growth in Q1.
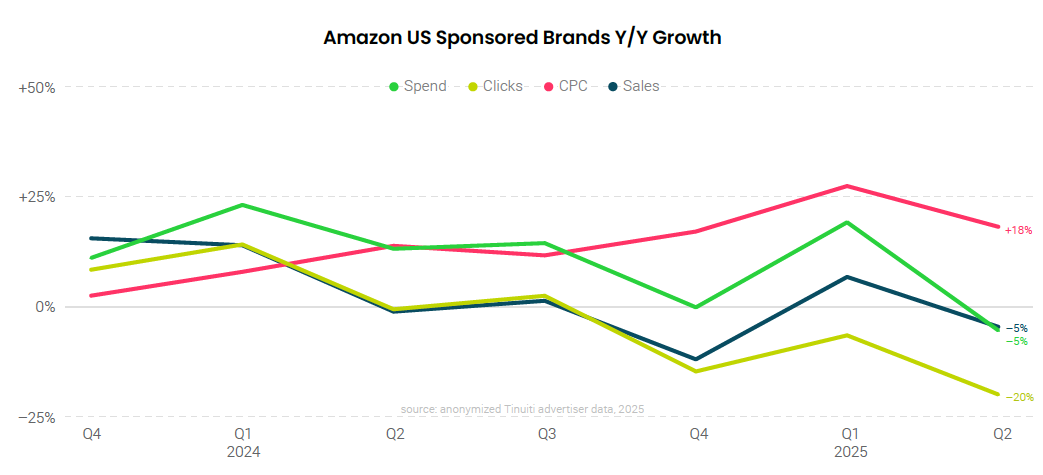
Amazon Sponsored Brands ads are largely trending counter to how Sponsored Products ads are trending, with Sponsored Brands CPC up 18% year over year and clicks down 20% year over year in the second quarter. This marks the fifth straight quarter of double-digit CPC growth for Sponsored Brands, including Sponsored Brands video units. Sales and spend both fell 5% compared to Q2 2024 as advertisers maintained steady ROAS year over year.
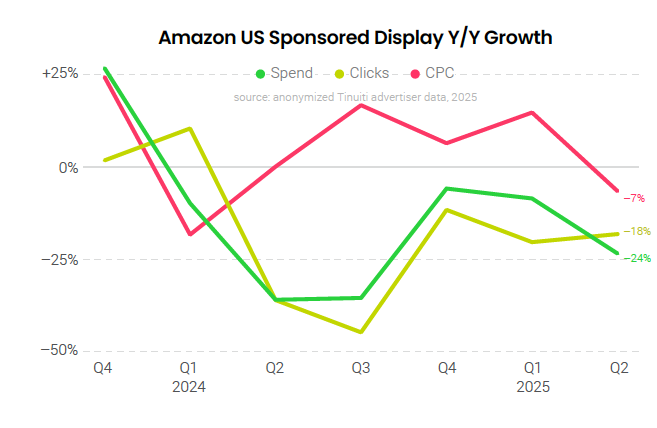
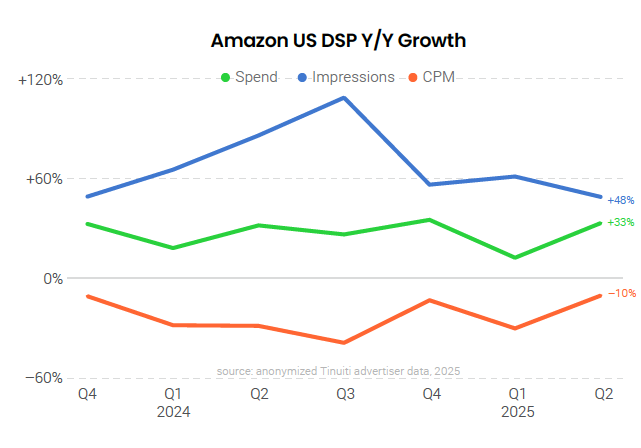
Investment in Amazon Sponsored Display ads declined 24% year over year in Q2 2025, the sixth straight quarter of declines for the format. As the Amazon demand-side platform (DSP) continues to grow in inventory and functionality, many advertisers are prioritizing the DSP over Sponsored Display when it comes to Amazon display dollars, and same-store DSP spend grew an impressive 33% year over year in the second quarter.
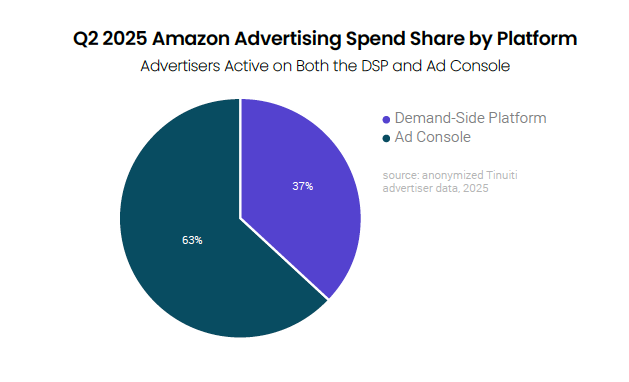
In Q2, endemic Amazon advertisers that invested in both search and DSP campaigns spent 37% of ad spend on the DSP, up from 34% in the first quarter. The DSP has now outpaced Amazon Sponsored Products spend growth in every quarter since the end of 2022, and recent growth has been propelled by the addition of Prime Video ads to DSP inventory since early 2024. The 37% figure does not include DSP investment from non-endemic advertisers that only invest in the DSP.
Same-store Amazon advertisers ramped up spend on the Amazon DSP 33% year over year in the second quarter, with impressions up 48% and CPM down 10%. Prime Video ads are a major reason why the DSP continues to see strong growth, and, in addition to buoying same-store growth, Amazon’s efforts to woo advertisers with competitive streaming video CPM rates continues to attract more new advertisers to the DSP in 2025.
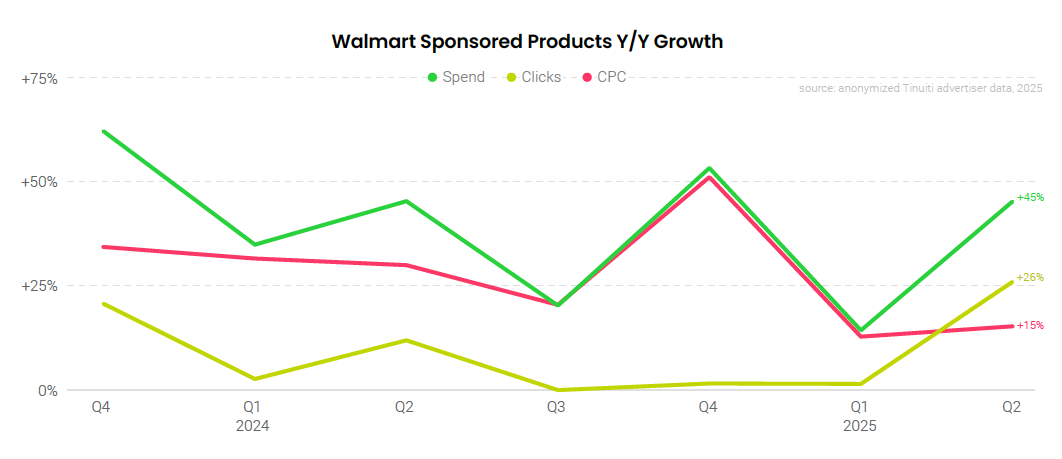
Clicks on Walmart Sponsored Products increased 26% year over year in Q2, the biggest increase observed since Q2 2023. This is also the first quarter in which click growth outpaced CPC growth since Q2 2023, as spend growth had largely been tracking in line with increases in ad pricing since Q3 2024. Sales attributed to Walmart Sponsored Products rose 31% year over year in Q2, lagging the 45% growth in spend on the format.
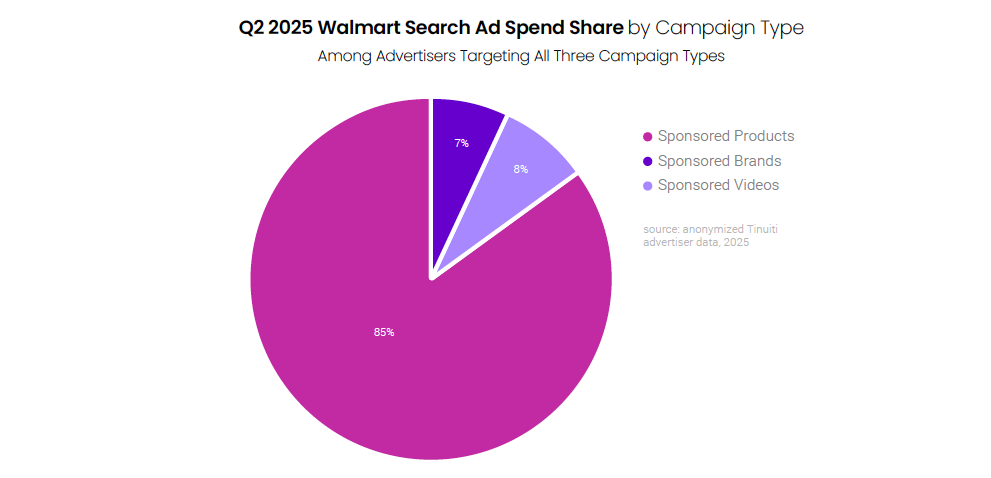
Among brands targeting Walmart Sponsored Products, Sponsored Brands, and Sponsored Videos, 85% of Walmart search investment goes to Sponsored Products. Sponsored Videos, which were widely launched in the back half of 2023, now account for 8% of all spend, with the remaining 7% going to Sponsored Brands. While not all Walmart search advertisers invest in all three formats, the share that do is growing over time.
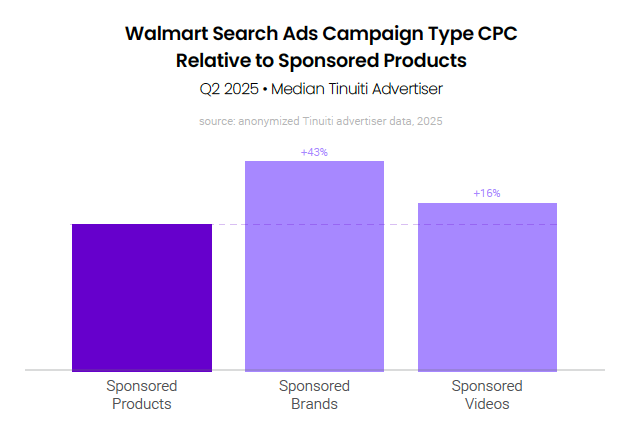
Walmart Sponsored Videos CPC was still higher than that of Sponsored Products for advertisers deploying both in Q2 2025, but the difference has declined from 35% in Q4 last year to just 16% in the second quarter. The shrinking gap is largely the result of Walmart’s move to reduce its former $1.30 minimum bid to participate in Sponsored Videos auctions to $0.80 in November 2024.
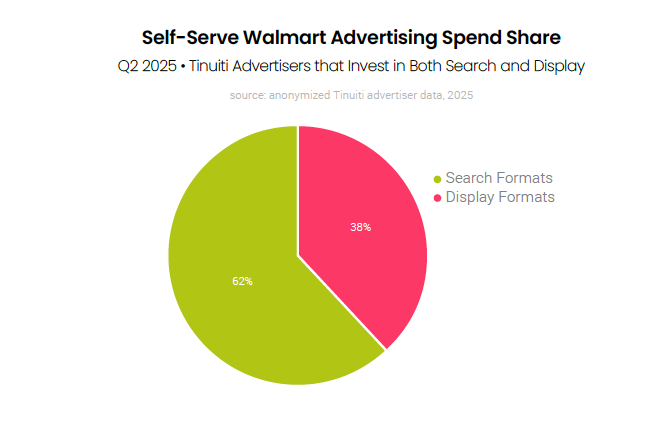
Advertisers tapping into Walmart’s self-serve display and search advertising spent 38% of total Walmart self-serve investment on display formats and 62% on search formats. Self-serve display includes inventory both on and off of Walmart’s website and app, and Walmart search includes Sponsored Products, Sponsored Brands, and Sponsored Videos. In Q3, some managed-serve onsite auction campaigns will be sunset, making self-serve more important for advertisers.
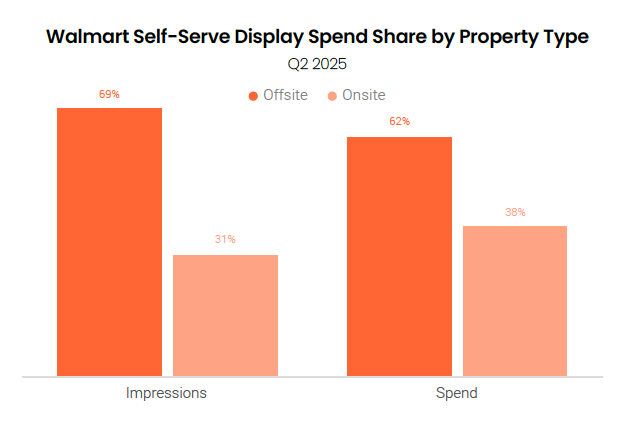
Offsite inventory continues to grow in importance for Walmart self-serve display advertisers and accounted for 62% of spend in the second quarter, up from 48% spend share in Q1. Onsite inventory accounted for 38% of spend but just 31% of impressions in Q2, as CPM is relatively higher for inventory featured on Walmart’s website and app than for offsite placements.
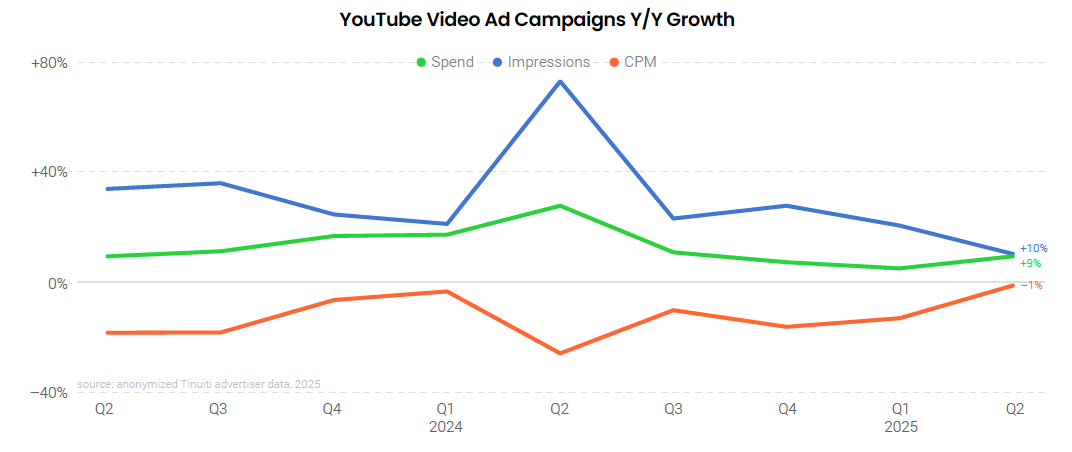
Spending on YouTube video ad campaigns was up 9% year over year in Q2 2025, up from 5% growth a quarter earlier. Impressions for these campaigns rose 10% year over year, while average CPM fell 1%. While YouTube video campaigns are still the primary way advertisers buy YouTube inventory, impressions on the platform are increasingly purchased through other Google campaign types like Performance Max and particularly Demand Gen campaigns. In April, Google removed the ability to create new Video Action Campaigns, while any that remain in July will be converted to Demand Gen campaigns automatically.
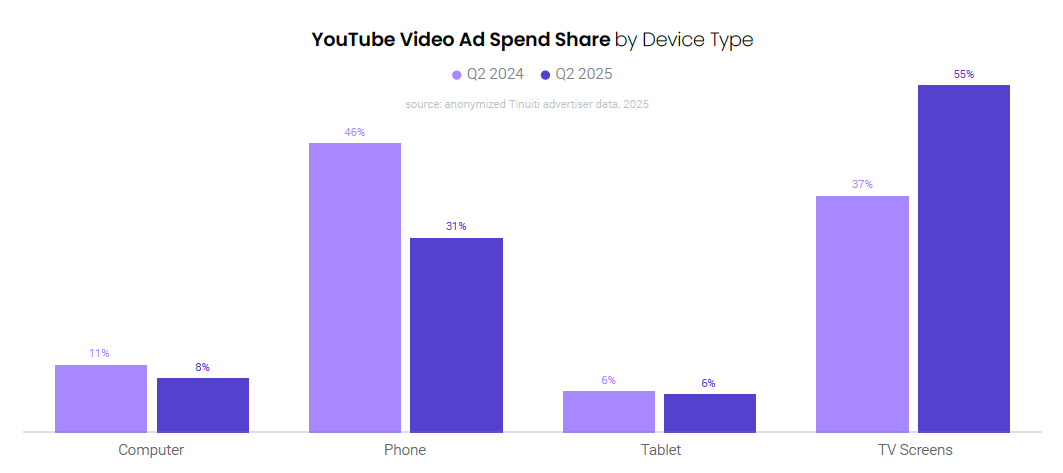
As the primary viewing device across YouTube services, TV screens accounted for 55% of YouTube video ad spending in Q2 2025, up from 37% of spend in Q2 2024. The bulk of those share gains came from phones, which saw a decline in spend share from 46% in Q2 2024 to 31% in Q2 2025. While total spending on YouTube video ad campaigns was up 9% year over year in Q2 2025, TV screen spending was up just under 62%.
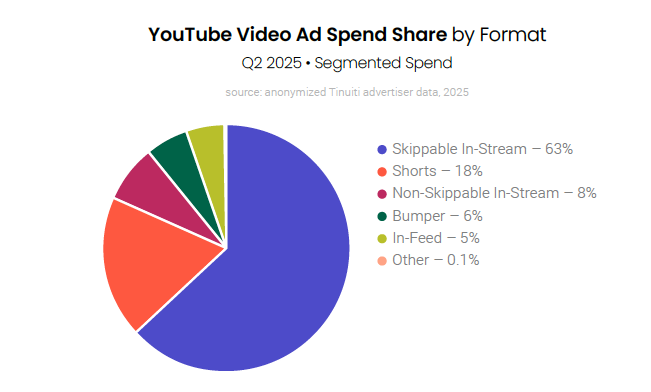
While about half of YouTube video ad spending is reported back to advertisers as unsegmented, across reporting that
is segmented by format, 63% of YouTube spend was attributed to skippable in-stream ads in Q2 2025. YouTube Shorts ads contributed the next largest share of segmented spend at 18%. These formats were followed by non-skippable in-stream ads at just under 8% share, with bumper
ads at 6%, and in-feed ads at 5%.
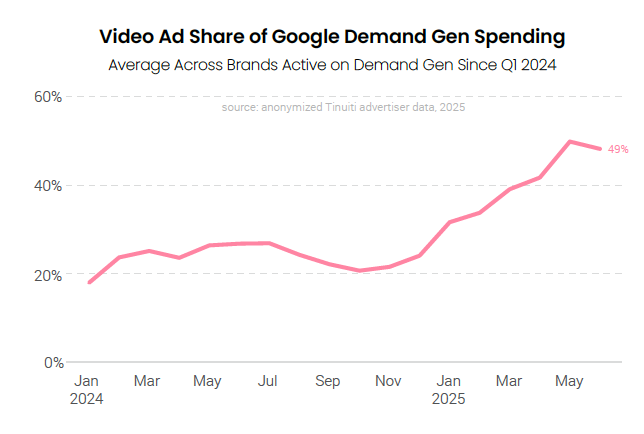
For brands running Google Demand Gen campaigns since the start of 2024, video has become a much larger contributor to total ad spend. In January 2024, video accounted for just 18% of Demand Gen spending, but with Google instituting a transition of Video Action Campaigns to Demand Gen campaigns over Q2 and Q3 2025, video is now contributing around half of Demand Gen spending.
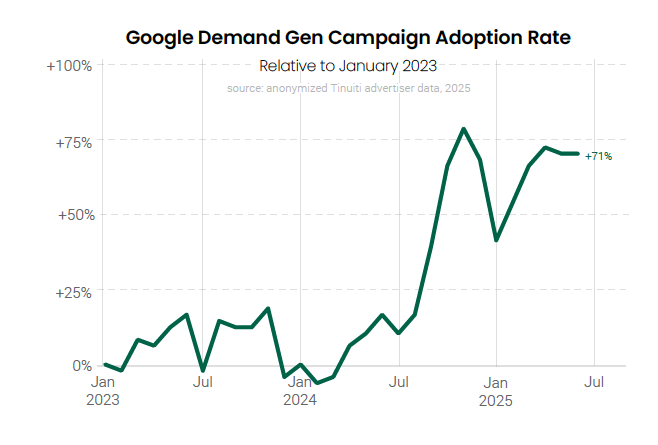
The transition of Video Action Campaigns to the Demand Gen model helped drive much higher adoption rates for Demand Gen campaigns over Q2 2025 compared to the same time a year earlier. Having peaked during the height of the Q4 holiday shopping season, Demand Gen adoption rates cooled to start 2025, but spiked again as advertisers faced the April cutoff when they could no longer create new Video Action Campaigns.
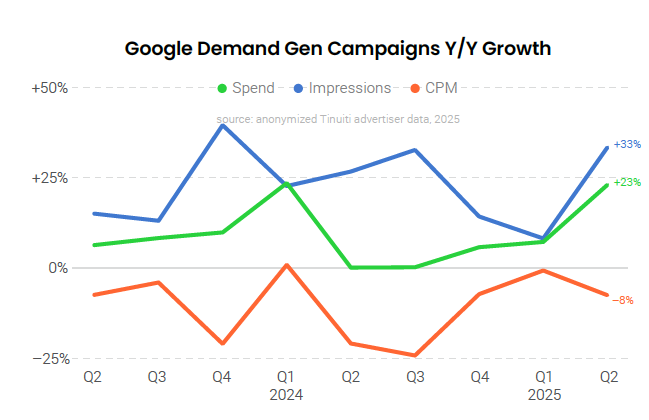
In addition to seeing strong adoption rates in Q2 2025, Google Demand Gen campaigns saw strong year-over-year spending growth among advertisers that were active both this year and last. Same-site spending on Demand Gen campaigns was up 23% year over year in Q2, up from 7% growth a quarter earlier and the strongest growth since Q1 2024. Impression growth for Demand Gen campaigns shot up to 33% year over year, but average CPM declined 8%.
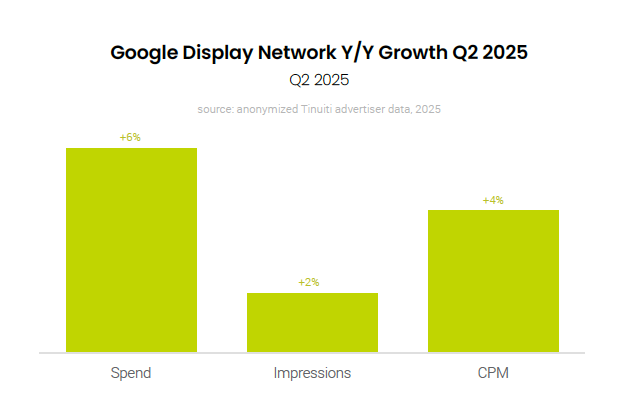
Advertiser spending on the Google Display Network was up 6% year over year in Q2 2025, down from 9% growth a quarter earlier. GDN impression growth was 2% in Q2, up from a small decline in Q1, while GDN CPM growth slowed from 10% in Q1 to 4% in Q2. Google Demand Gen campaigns ads can serve on GDN inventory, but to date, Demand Gen only accounts for a low single-digit share of GDN spending.
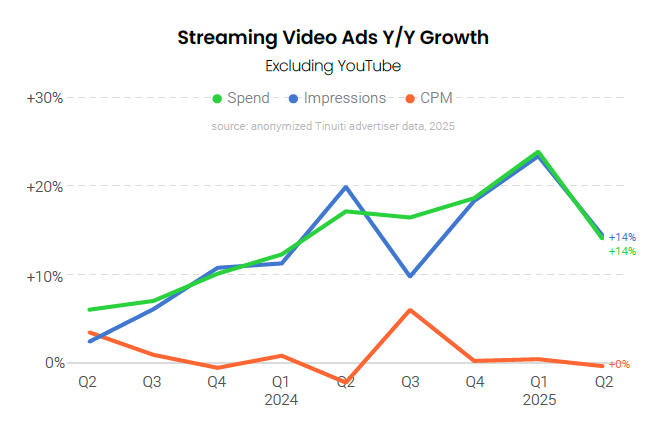
Spending on streaming video ads outside of YouTube was up 14% Y/Y in Q2 2025, down from 24% growth a quarter earlier. While Prime Video ads continue to bolster total streaming spending, their contribution to year over year growth is lessening for early adopters of the platform in Q1 and Q2 of 2024. Streaming CPM growth was flat for the third straight quarter as the streamers have felt pressure to keep their CPMs competitive as the marketplace shifts more toward the ad-supported model.
Across both new and existing advertisers, Prime Video ad spending was up nearly 22% from Q1 2025 to Q2 2025, with spending running roughly three times the level of Q2 2024. The adoption rate of Prime Video ads has increased each of the last five quarters, and advertisers that were active in both Q2 2024 and Q2 2025 increased their investment in the platform on a year over year basis.
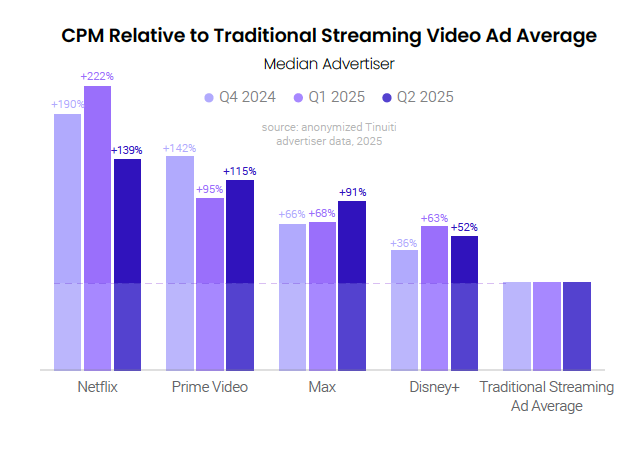
Across four of the biggest streamers, Netflix saw the highest average CPM in Q2 2025, followed by Prime Video, Max, and Disney+. Netflix did see a decline in CPM relative to other streamers from Q1 to Q2, but that was in large part a reflection of a broader group of brands adopting the platform in Q2. With Prime Video and Max seeing slightly higher CPMs relative to average in Q2 than in Q1, the result was greater parity in CPM for the biggest streamers.
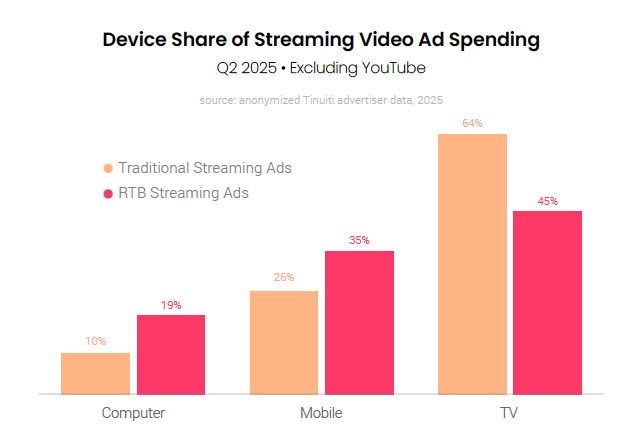
For traditional streaming video ad buys, TV screens accounted for 64% of spending in Q2 2025. Mobile devices, including both phones and tablets, accounted for another 26% of spending, while computers contributed 10%. Those rates were nearly unchanged from a quarter earlier. For streaming video ad buys purchased through real-time bidding platforms, TVs accounted for just 45% of spending, with mobile accounting for 35% and computers accounting for 19%.
Check out our most recent Digital Ads Benchmark Report for more exclusive insights.
