Digital Ads Benchmark Report Q3 2024
Quarterly Trends Across Google, Meta, Amazon, And More

Quarterly Trends Across Google, Meta, Amazon, And More
The Tinuiti Digital Ads Benchmark Report is based on anonymized performance data from advertising programs under Tinuiti management, with annual digital ad spend under management totaling over $4 billion. Samples are restricted to those programs that have remained active and maintained a consistent strategy over the time periods studied. Unless otherwise noted, all figures are based on same-client growth. The trends and figures included are not meant to represent the official performance of any advertising platform or the experiences of every advertiser.
Note: The data below is from 2024. Head here to see our most recent report.
Tinuiti is the largest independent performance marketing firm across Streaming TV and the Triopoly of Google, Facebook, and Amazon, with $4 billion in digital media under management and over 1,000 employees.
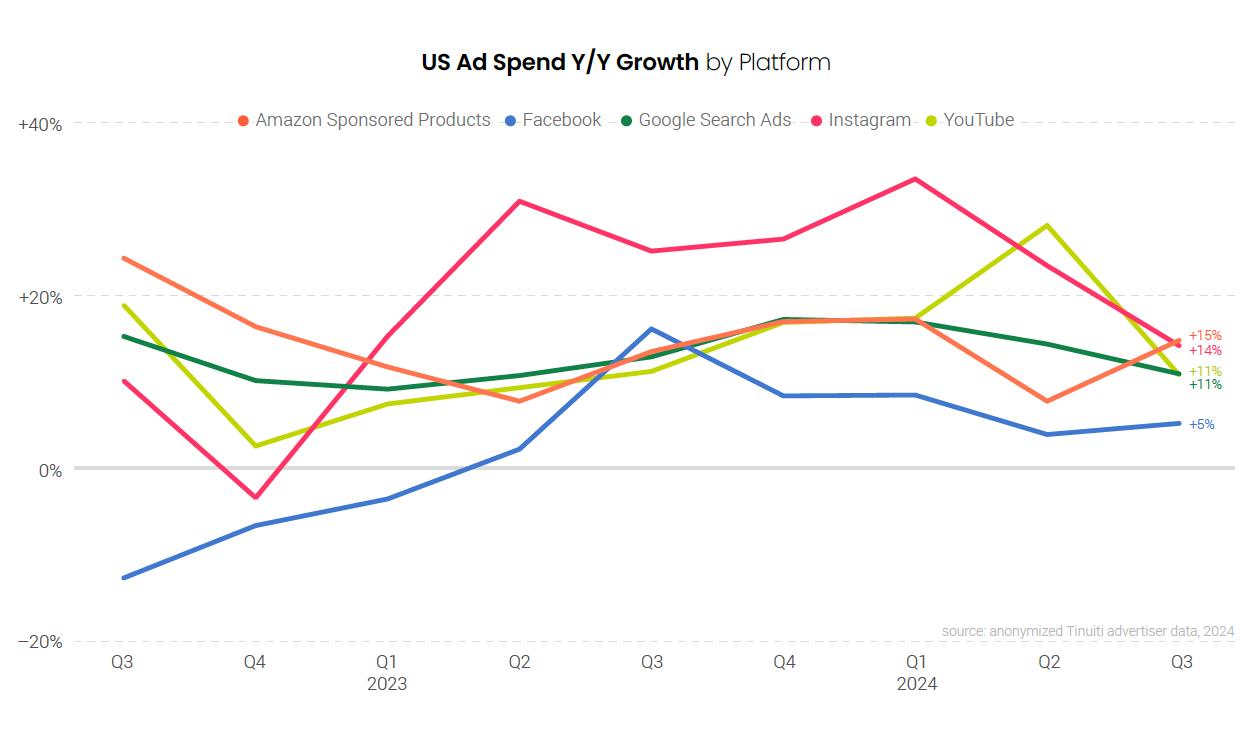
Google advertising growth slowed across both search and YouTube in the third quarter, as each ran up against tougher year-ago comparisons heading into the back half of the year. While Facebook spend growth edged up from 4% in the second quarter to 5% in Q3, Meta growth slowed overall as Instagram spend rose 14% in Q3 compared to 24% in Q2.
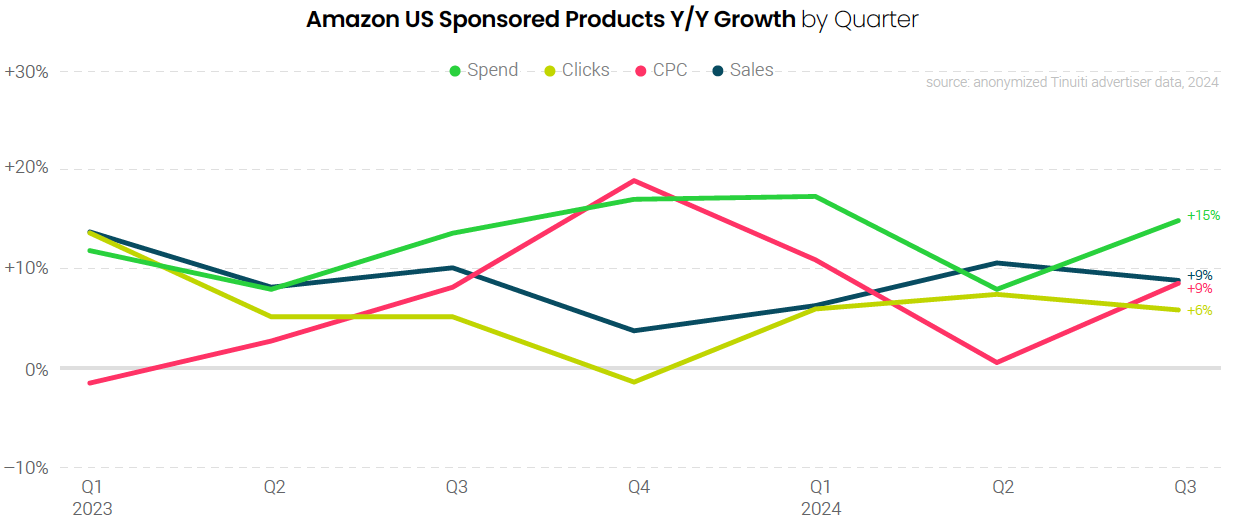
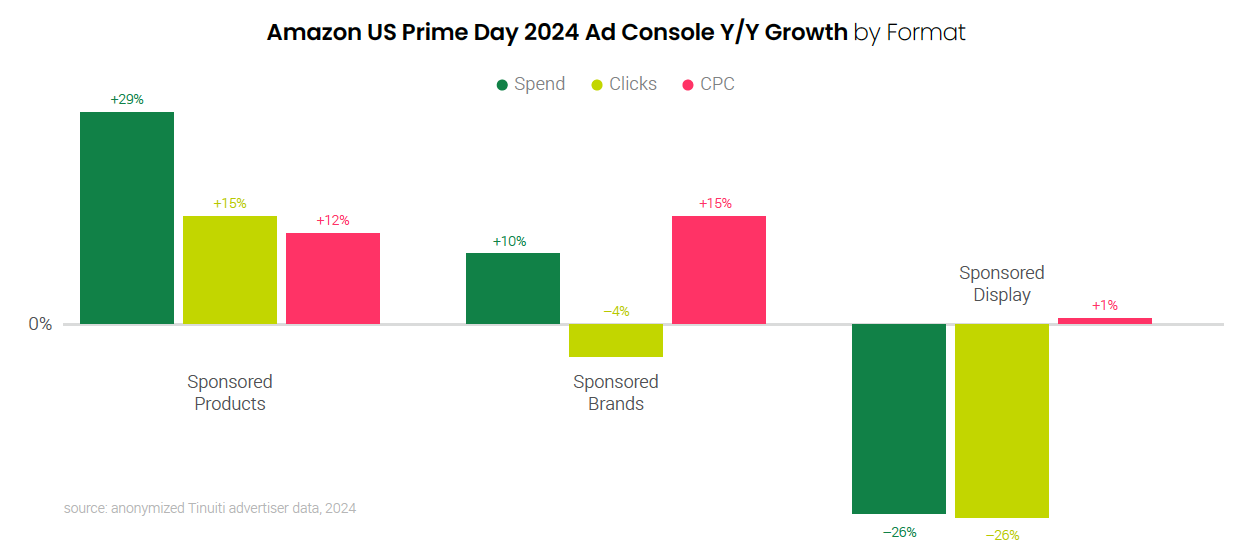
Amazon Sponsored Products stood out in Q3, as growth nearly doubled from 8% in Q2 to 15% in Q3. The third quarter was helped along by strong growth in investment during Amazon’s key Prime Day event, which took place on July 16 and 17. Prime Day Sponsored Products investment jumped 29% compared to the two-day event last year.
Instagram Reels took a major step forward, going from 13% of impressions in the second quarter up to 19% in the third. This marks the biggest quarter-to-quarter jump in impression share ever observed for Tinuiti advertisers, and brings Reels’ contribution to Instagram ad impressions closer to that of Facebook, where Reels video and overlay ads combined for 23% of ad impressions in Q3.
In addition to vertical video, AI-powered Advantage+ shopping campaigns (ASCs) also grew in importance for Meta advertisers in the third quarter. The share of total retail/ecommerce spend going to the campaign type rose to 34%, as advertisers continue to see strong performance from ASCs.
Google paid search advertising across both text ads and shopping (including both traditional Shopping and Performance Max campaigns) grew 11%, down from 14% in the second quarter. However, shopping campaign spend was up 16%, the same figure observed in Q2, as product-based retail ads continue to be an area of strength for Google’s ad business. Amazon, Google’s largest shopping advertiser, hit the brakes on its shopping campaigns in the third week of September for unknown reasons before returning to it typical impression share in the final week of the quarter.
Looking outside of these platforms, Walmart continues to stand out for its robust growth over the last few years. Spend on Walmart Sponsored Products rose 20% in the third quarter, marking the sixth straight quarter that investment in Walmart’s primary search ad format rose by at least 20%. Spend on both TikTok and Snapchat Ads also rose by over 20% in Q3 2024.
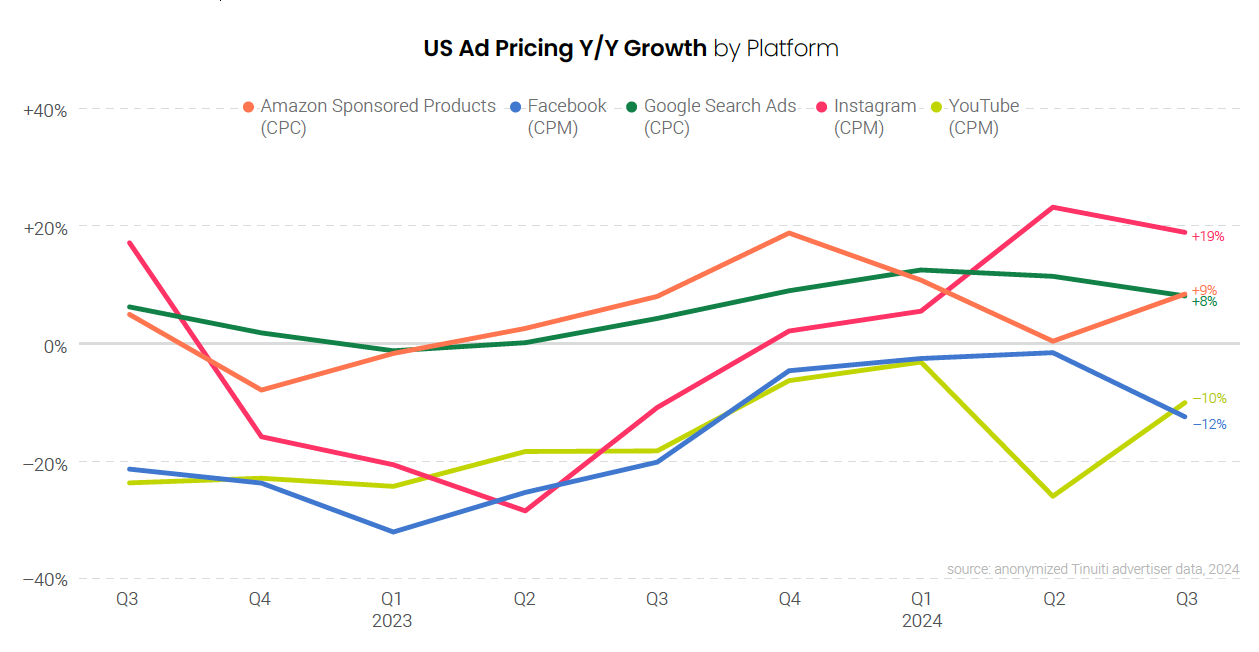
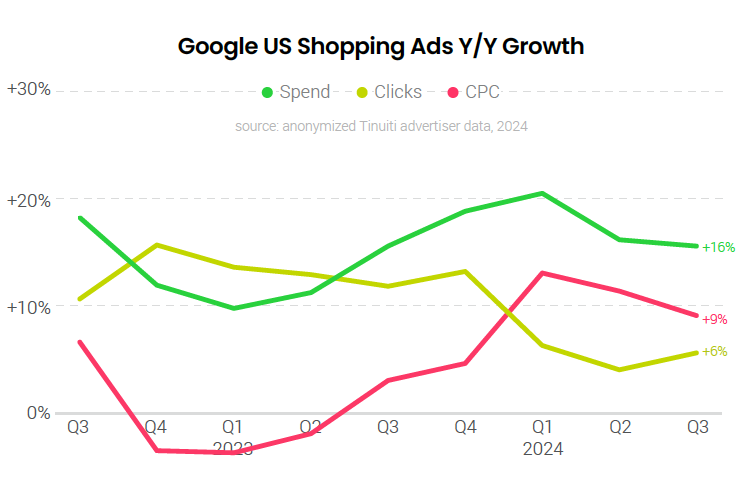
Google CPC growth trended in line with expectations, slowing from 12% growth in Q2 to 8% in Q3. With CPC growth going from 0% in Q2 2023 to 4% in Q3 2023, two-year pricing growth was actually slightly faster in Q3 2024 than it was in Q2 2024.
On Meta platforms, pricing growth decelerated in the third quarter as advertisers ran up against tougher year-ago comparisons. While social platforms are popular opportunities for political campaigns to engage with prospective voters, the influx of political ad dollars has not had a clear impact on Facebook and Instagram pricing trends for non-political advertisers such as those studied for this report. Pricing growth was also softer across all three of TikTok, Snapchat, and Pinterest in Q3 compared to Q2.
Amazon Sponsored Products CPC growth rebounded from flat in the second quarter to 9% growth in Q3. Much like spend growth, the increase in pricing was even stronger during Prime Day than the rest of the quarter, with Prime Day 2024 Sponsored Products CPC up 12% compared to Prime Day 2023.
YouTube pricing growth recovered from the 26% decline observed in the second quarter to just a 10% decrease in Q3. While connected TV has been a key driver of YouTube spending growth in recent quarters, its rise, along with that of new inventory sources like YouTube Shorts has helped depress YouTube pricing overall. Connected TV was again the fastest growing device segment for YouTube in Q3, with spending up 24%, but it saw a lower-than-average CPM, largely due to the strength of desktop CPM.
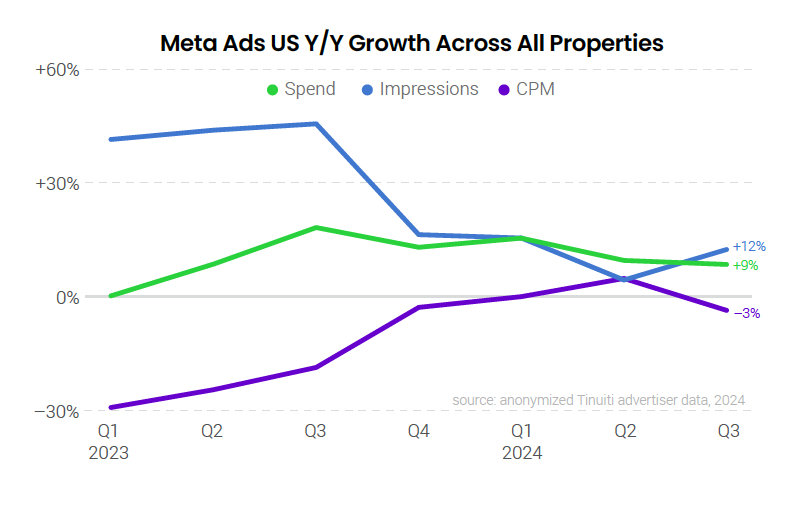
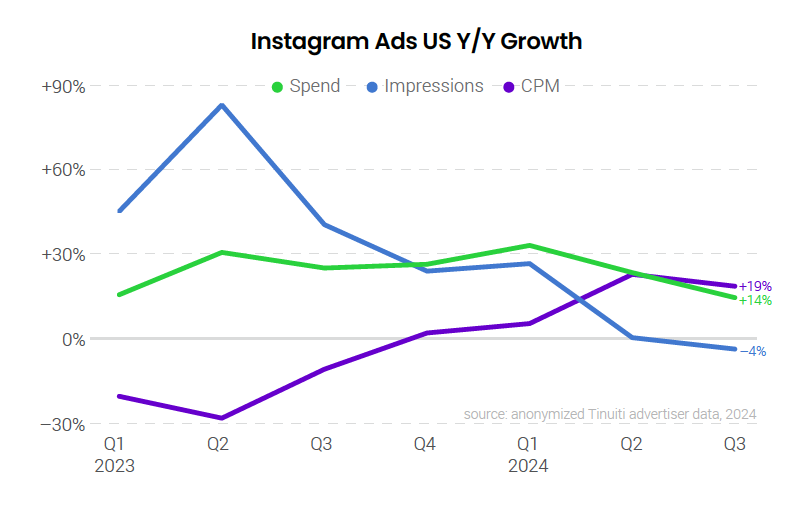
Tinuiti advertisers invested 9% more in Meta properties, including Facebook and Instagram, in Q3 2024 than in Q3 2023, a slight deceleration from the 10% growth observed in Q2. CPM dipped 3% year over year, compared to a 5% increase in Q2, but with CPM declines slowing from Q2 to Q3 in 2023, two-year CPM growth was nearly identical in the second and third quarters of 2024. Impressions rose 12% in Q3, accelerating from 4% growth in Q2.
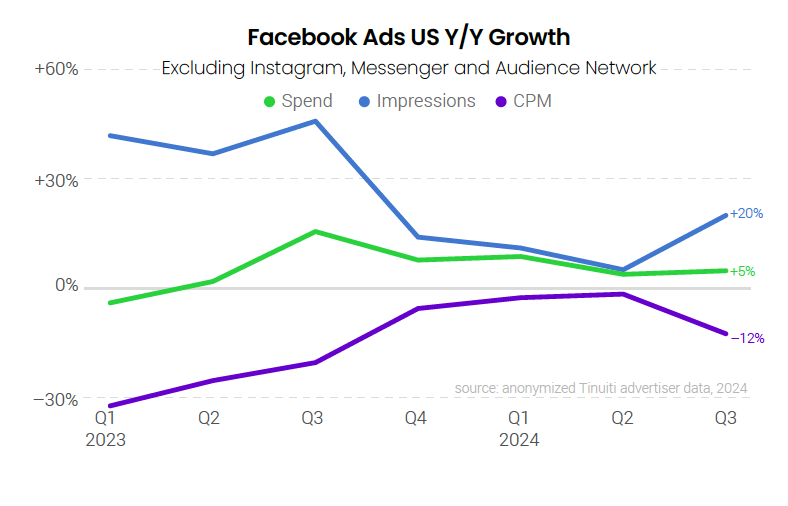
The cost of ad impressions on Facebook fell 12% year over year, but impression growth rebounded from 5% in Q2 up to 20% in Q3 to drive spend up 5% year over year in the third quarter. Reels ads continued to play a major role in driving impression growth for Facebook advertisers. While Facebook is one of the major recipients of digital ad dollars from political campaigns, there has not been a noticeable impact on pricing trends as the US draws closer to November.
Advertisers increased investment in Instagram 14% year over year in Q3, slower than the 24% growth observed in Q2 but still nearly three times the rate of growth of Facebook ad spend in the third quarter. Impressions declined 4% year over year, but pricing rose 19% year over year, the second straight quarter of double-digits increases in pricing.
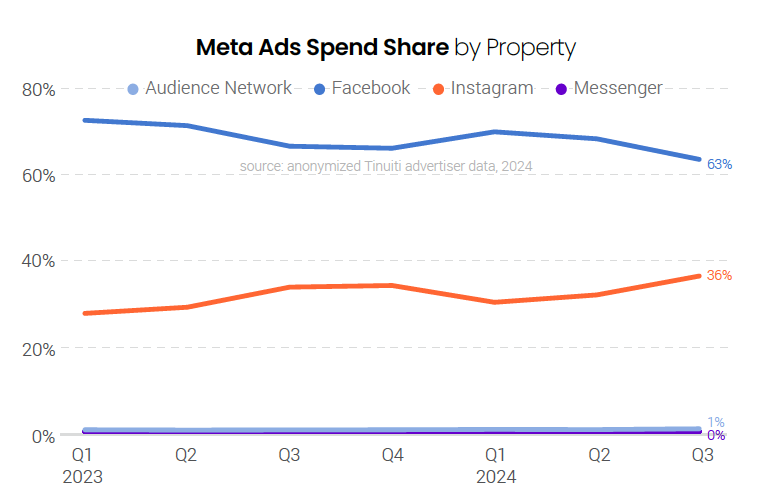
Meta advertisers spent 36% of all ad spend on Instagram, compared to 63% on Facebook. Instagram share rose from 34% last Q3, as spend growth on the platform continues to outpace that of Meta’s largest platform, Facebook. Just 1% of Meta spend was attributed to the Audience Network in Q3 2024, while Messenger continues to account for only a small fraction of a percentage point of Meta spend.
AI-powered Advantage+ shopping campaigns (ASCs) have quickly risen in importance since their release out of beta back in 2022, and in Q3 2024 these campaigns accounted for 34% of all retail/ecommerce spend for Tinuiti advertisers. That’s up from the 23% share observed in both Q3 2023 and Q2 2024. ASCs, which automate many aspects of campaign optimization and aim to simplify audience and creative management, have grown in popularity as a result of strong performance.

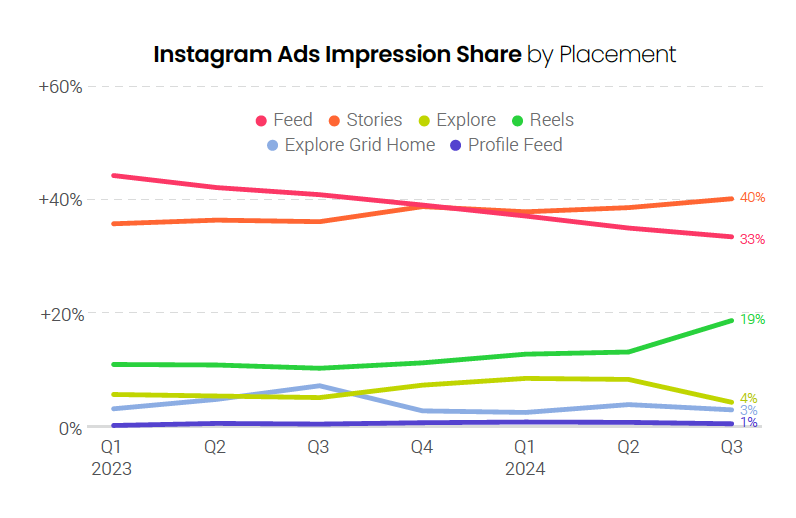
Nearly one in five of all Instagram ad impressions were attributed to Reels in Q3 2024, nearly doubling the 10% share observed in Q3 2023. The third quarter also marked the biggest quarter-to-quarter jump in Reels impression share ever observed for Tinuiti advertisers. With the continued rise in newer ad placements, Feed placements sank to the lowest impression share ever observed, accounting for just one in three Instagram ad impressions in Q3.
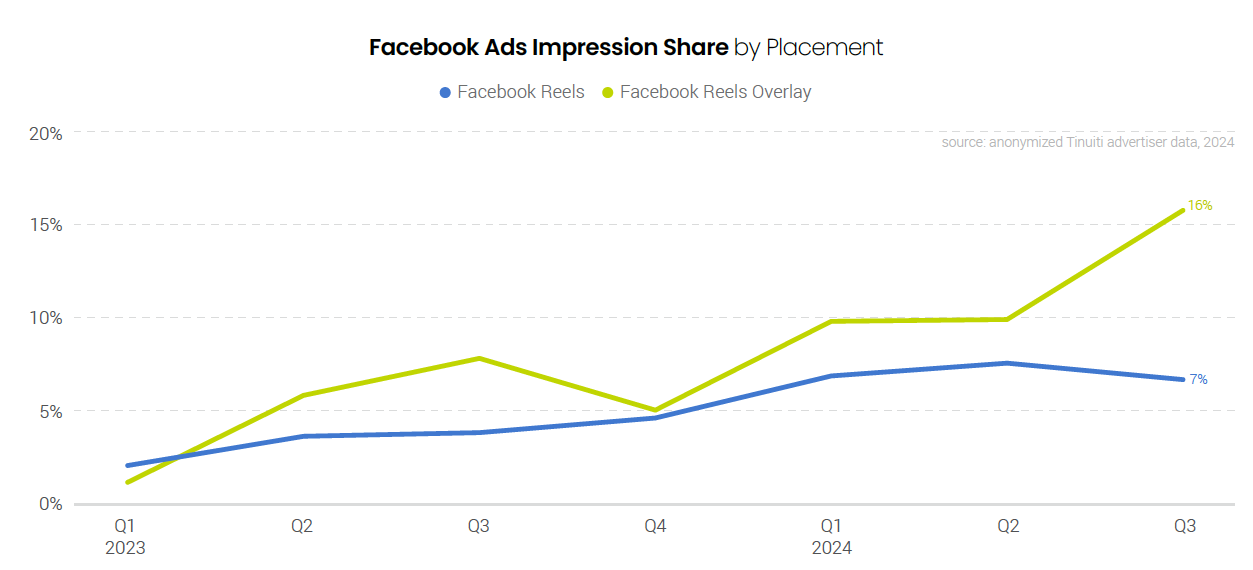
Between Reels video ads and Reels overlay ads, nearly a quarter of all Facebook ad impressions were attributed to Reels placements in Q3 2024, a significant rise from the 12% of Facebook ad impressions these units accounted for last Q3. Reels overlay ads, which are banners/stickers featured on top of Reels videos, accounted for 16% of all ad impressions on Facebook but are not a meaningful part of Instagram inventory at this point.
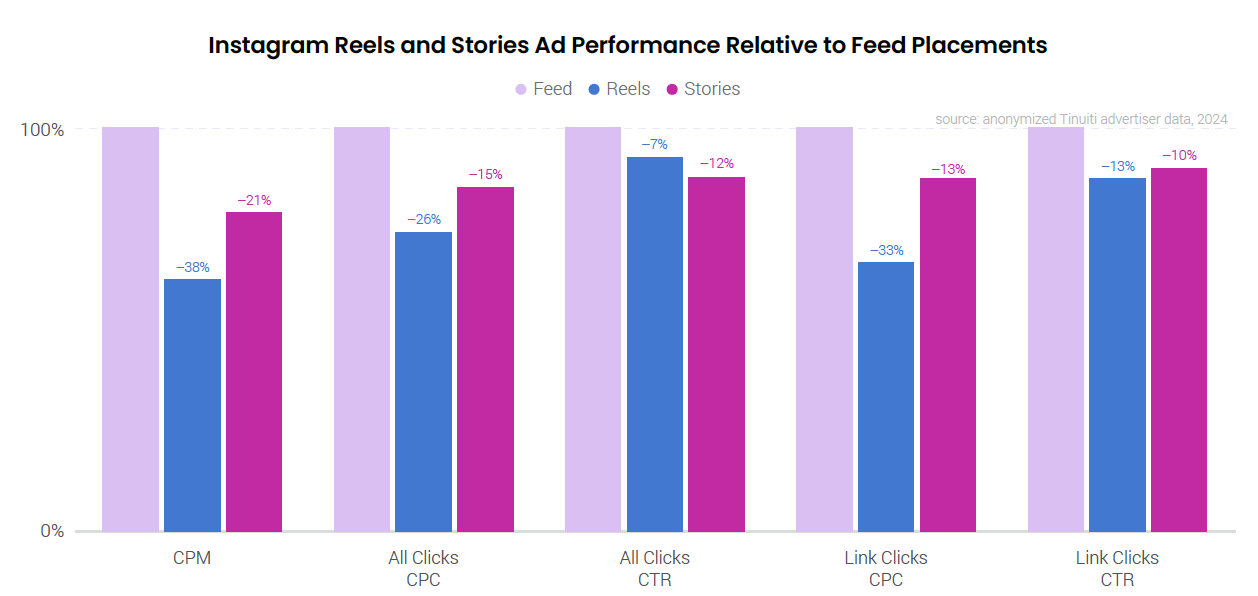
Instagram Reels CPM is still significantly below that of Instagram Feed, and in Q3 that difference was 38%. However, this marks an improvement from Reels’ 40% lower and 46% lower CPMs in Q2 and Q1 of this year, respectively, as the gap is steadily starting to close. Stories ads also have significantly lower CPM than Feed, but Stories CPC for both link clicks and all clicks is much closer to that of Feed than Reels.
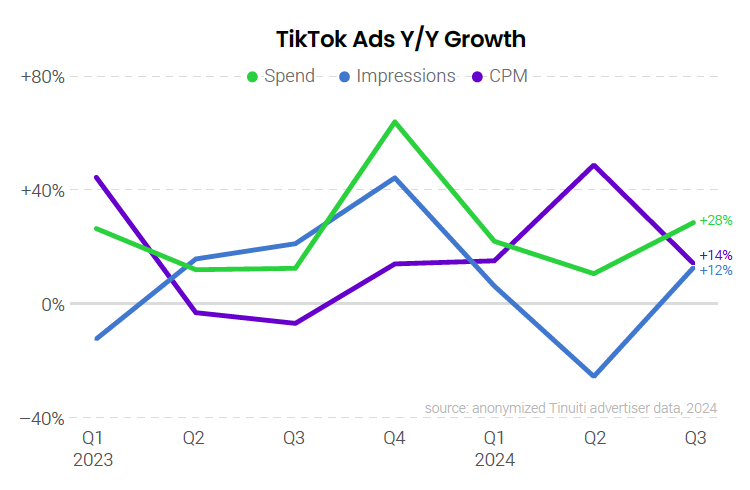
The median Tinuiti advertiser active on TikTok since at least Q3 2023 increased spend 28% year over year in the third quarter, the strongest growth observed since last Q4 when budgets rose 64% to reach TikTok users during the busy holiday shopping season. While TikTok’s future in the US remains unclear, advertisers are not yet reallocating TikTok ad dollars as they wait to see whether the platform is eventually sold or goes dark in the US.
The median Snapchat advertiser increased spend by 21% year over year in the third quarter after growing ad spend 26% in the second quarter. While ad impressions fell 18% year over year in the second quarter, growth rebounded in the third quarter to a 16% increase. CPM growth, however, ecelerated mightily from 55% in Q2 to 5% in Q3. Snapchat continues to roll out updates to streamline AR asset creation
and expand reach for advertisers.

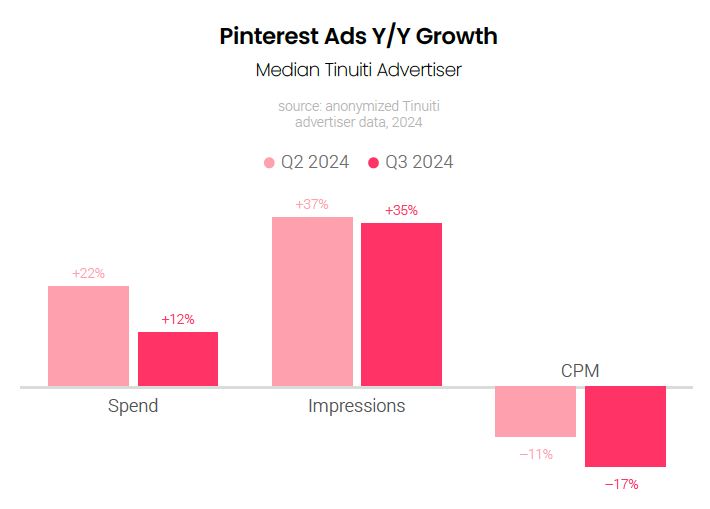
The average cost of ad impressions on Pinterest continued to fall year over year, dipping 17% in Q3 after falling 11% in the second quarter. Spend on the platform still rose 12% as impressions soared 35% year over year in Q3. Q3 Pinterest updates include the extension of Premiere Spotlight ads from search to the home feed, the launch of showcase ads to allow users to preview and explore brand content through branded images, and the introduction of quiz ads to engage users.
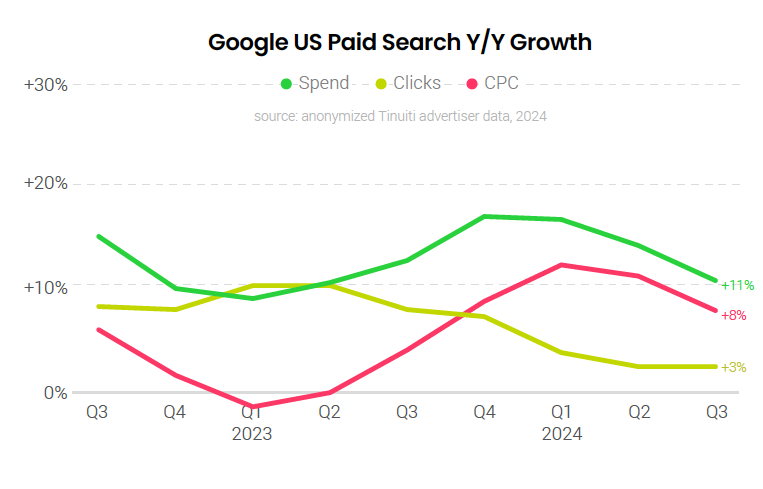
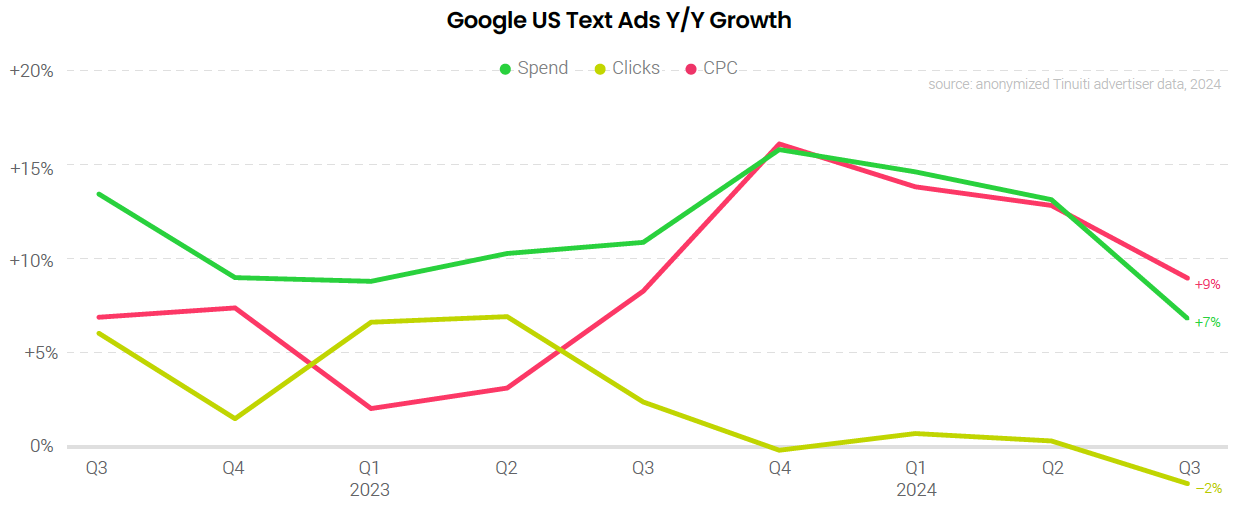
Spending on Google paid search ads rose 11% Y/Y in Q3 2024, down from 14% growth a quarter earlier. While click growth was steady at a little under 3% Y/Y, growth in average CPC slowed from 12% Y/Y in Q2 to 8% Y/Y in Q3. Search ad CPC growth had bottomed out at a 1% Y/Y decline in early 2023 as concerns about the economic outlook depressed ad pricing. CPC growth rose over the following year as those concerns faded, and advertisers are now facing strong year-ago pricing comps.
Advertiser spending on Google shopping ads, including both standard Shopping and Performance Max (PMax) campaigns, rose 16% Y/Y in Q3 2024, which was steady with Q2. Clicks from shopping ads rose 6% Y/Y in Q3, an improvement from 4% growth a quarter earlier. Shopping ad CPC growth slowed for the second quarter in a row, coming in at 9% Y/Y.
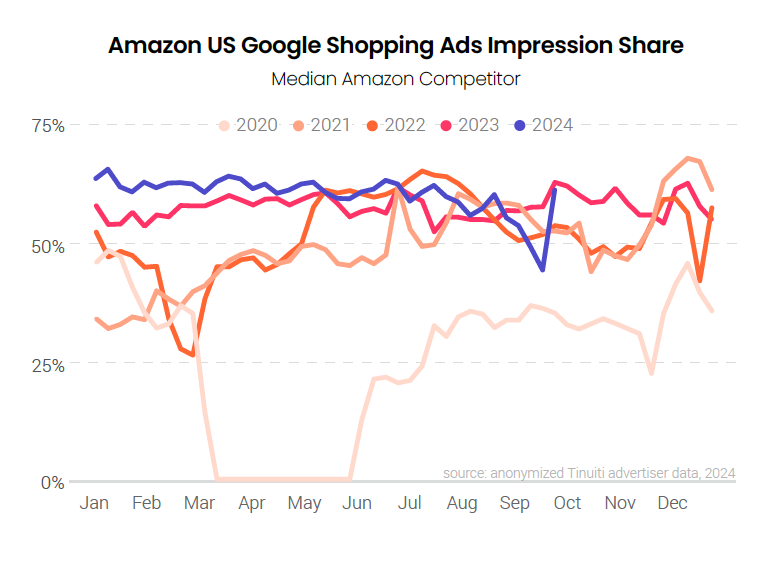
After starting the year on a particularly aggressive note, Amazon appeared to dial back its presence in Google shopping ad listings in Q3, with a particularly strong drop in impression share in mid-September. Amazon’s share of Google shopping impressions against its median retail competitor fell to 45% in the second to last week of September, which was the lowest level it has been since 2022. The very next week, however, Amazon’s impression share jumped right back to the levels its competitors saw in the first half of the year.
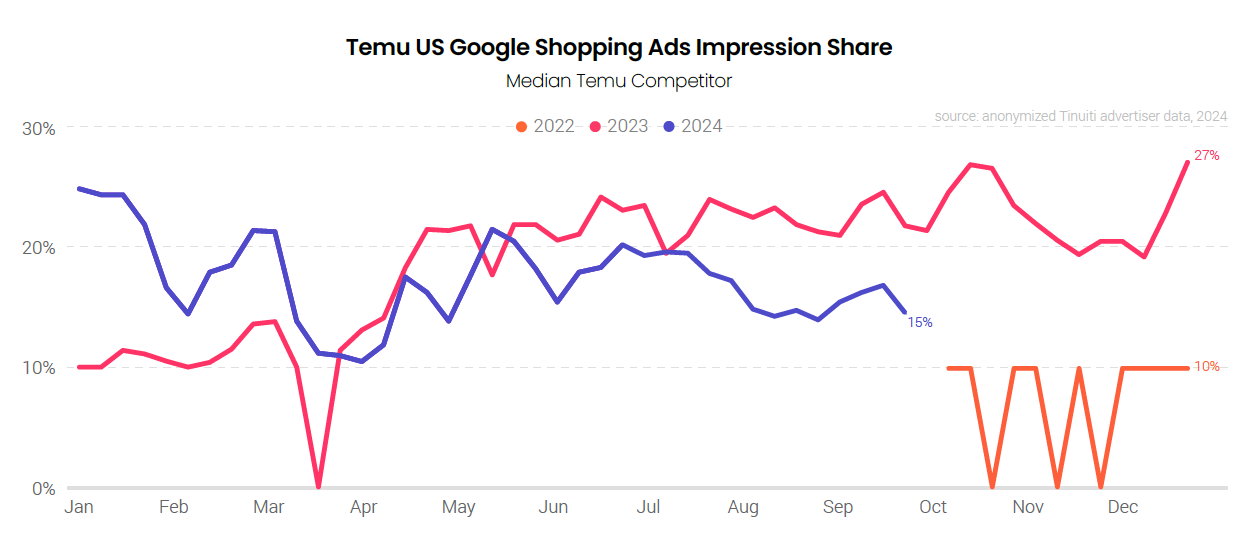
Temu’s heavy investment in US digital ads in 2023 may have been a factor in Amazon ramping up its own presence in Google shopping ads in early 2024, but Temu’s impression share numbers are now running considerably lower than a year earlier. Temu’s share of Google shopping impressions had fallen sharply over the course of Q1 2024 before rebounding a bit in Q2. Over the course of Q3, Temu’s impression share trended lower but was more stable than earlier in the year.
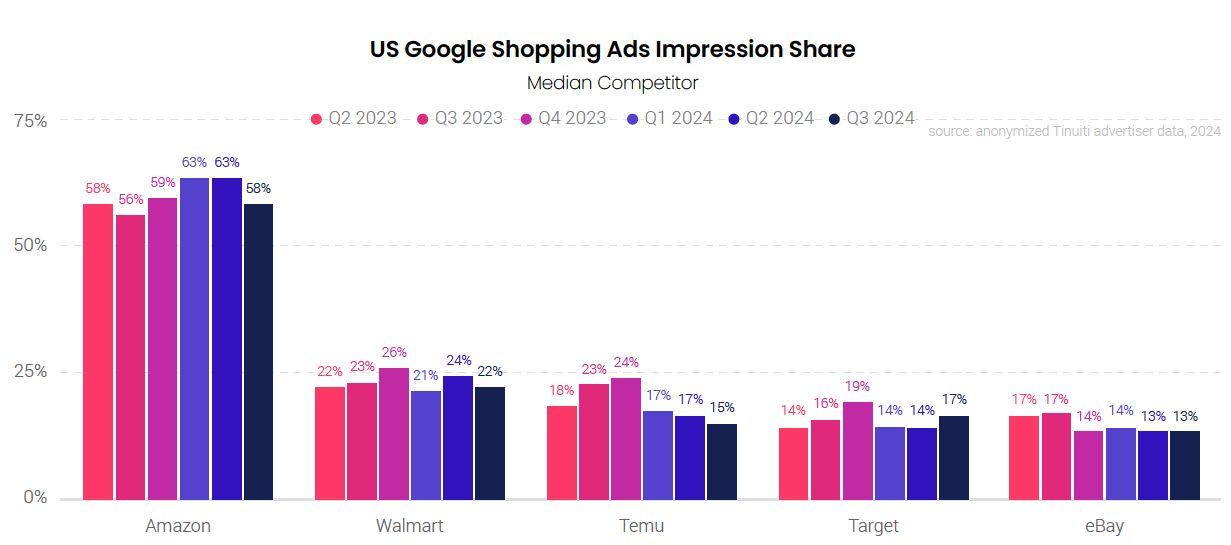
For the full third quarter, Amazon’s impression share against the median Google shopping competitor was 58%, down from 63% in Q2 2024, but up from 56% in Q3 2023. Walmart was a distant second place with an impression share of 22% in Q3 2024, a slight decline from a year earlier. Temu saw its impression share fall from 23% in Q3 2023 to 15% in Q3 2024, which allowed Target to overtake it as the retailer with the third highest impression share against its median competitor.
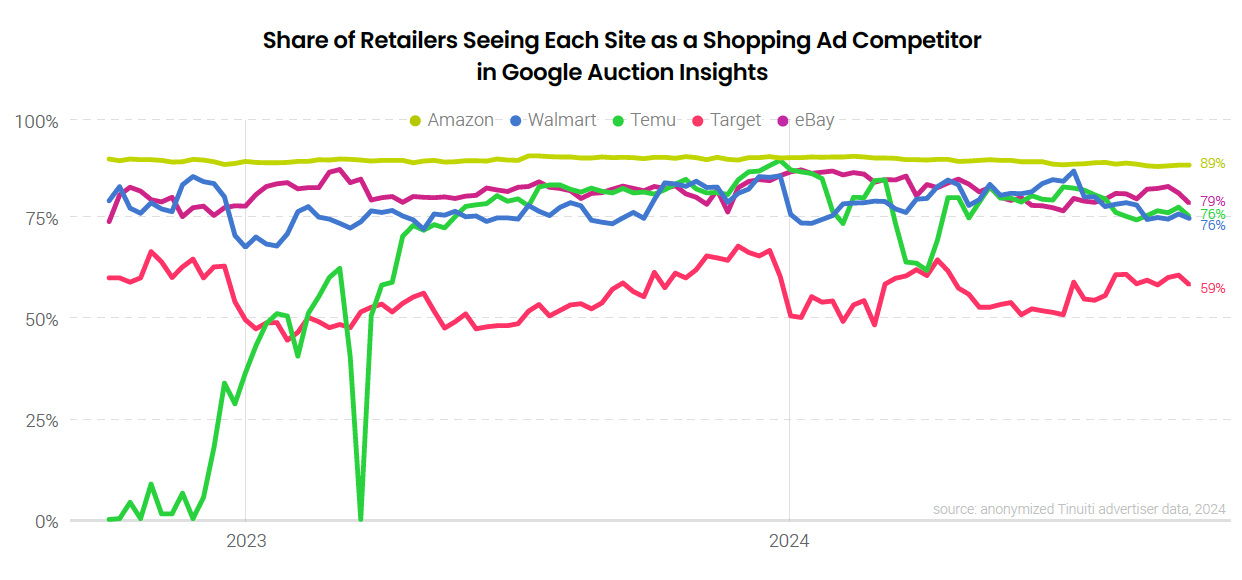
While Amazon leads other major retailers in Google shopping impression share by a healthy margin, the results are closer when considering the share of all retailers that see one of these retail giants as a competitor for shopping impressions. In Q3 2024, 89% of retailers saw Amazon listed by Google as a top competitor for shopping impressions. That rate was 81% for eBay, 79% for both Temu and Walmart, and 59% for Target. These results are indicative of the breadth of product categories each of these retailers is advertising and Temu briefly matched Amazon in this respect in Q4 2023.
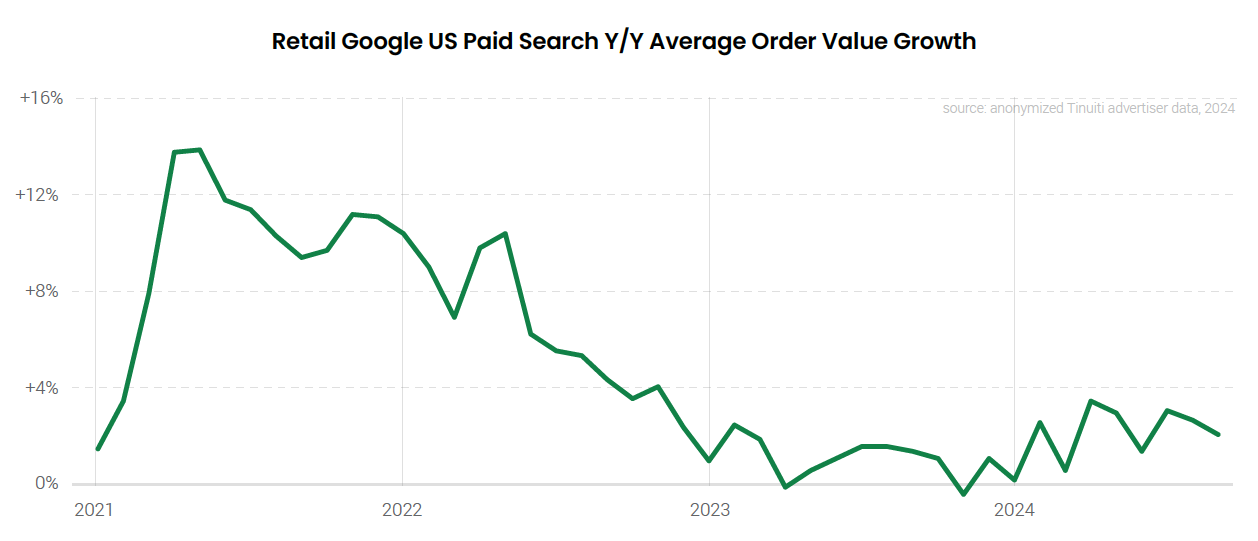
In August 2024, US inflation fell to its lowest rate of growth since February 2021. In the search ad space, growth in average order value (AOV) spiked over March and April 2021, before cooling over the next two years. In late 2023, Google search ad AOV growth began to pick back up a bit, but growth remains modest. Over Q3 2024, Google search ad AOV grew by 3% Y/Y.
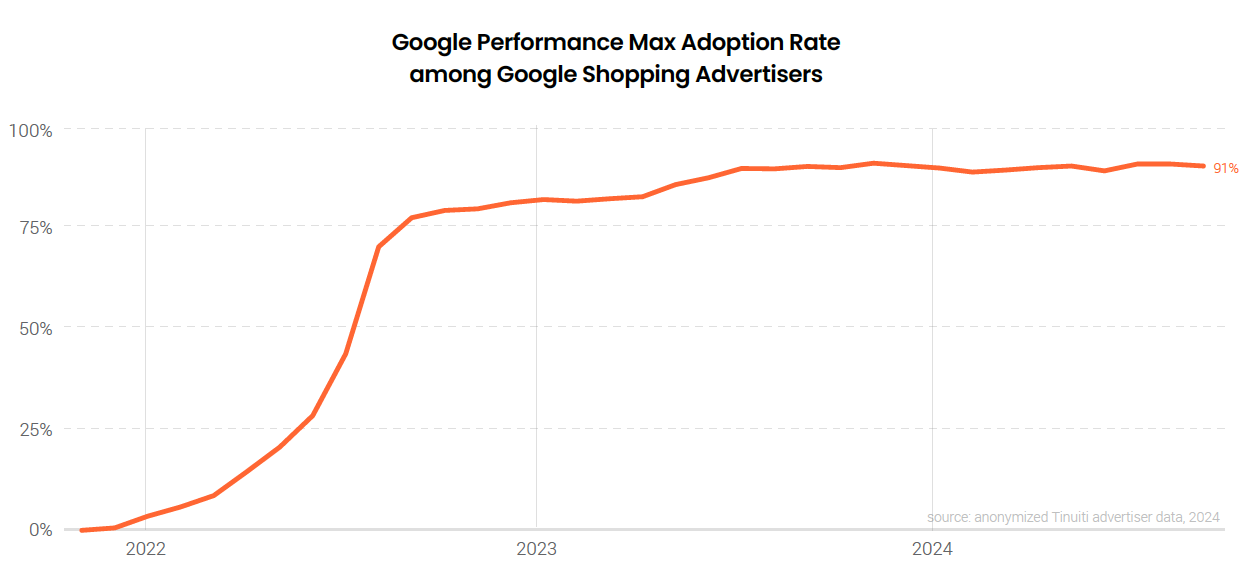
Among advertisers running shopping ad listings on Google, the adoption rate of AI-driven Performance Max (PMax) campaigns stood at 92% in Q3 2024, up a point from a quarter earlier. While most PMax adopters previously ran Smart Shopping campaigns, PMax campaigns have proven more popular than the format they replaced as Smart Shopping adoption rates had peaked at 75% in mid-2022.
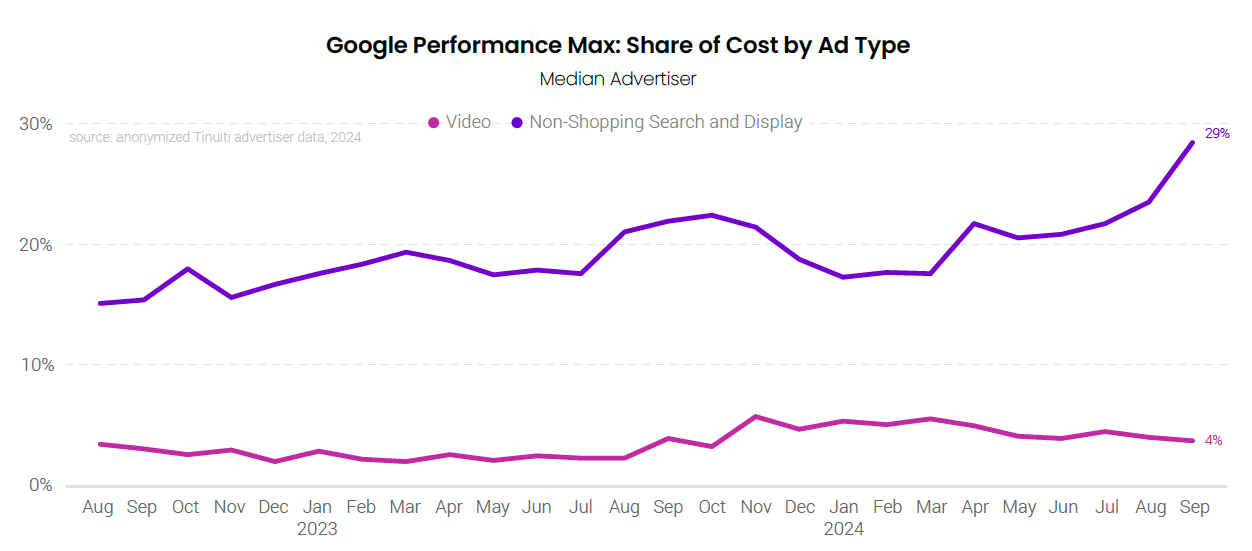
While shopping listings drive the bulk of PMax spending, advertisers have seen an uptick in costs associated with other types of inventory, particularly over the back half of Q3 2024. Non-shopping search and display ads accounted for 29% of PMax spending for retail advertisers in September 2024, up from 21% in June 2024. PMax spend share for video inventory has been steadier, averaging between 4-5% over the course of 2024.
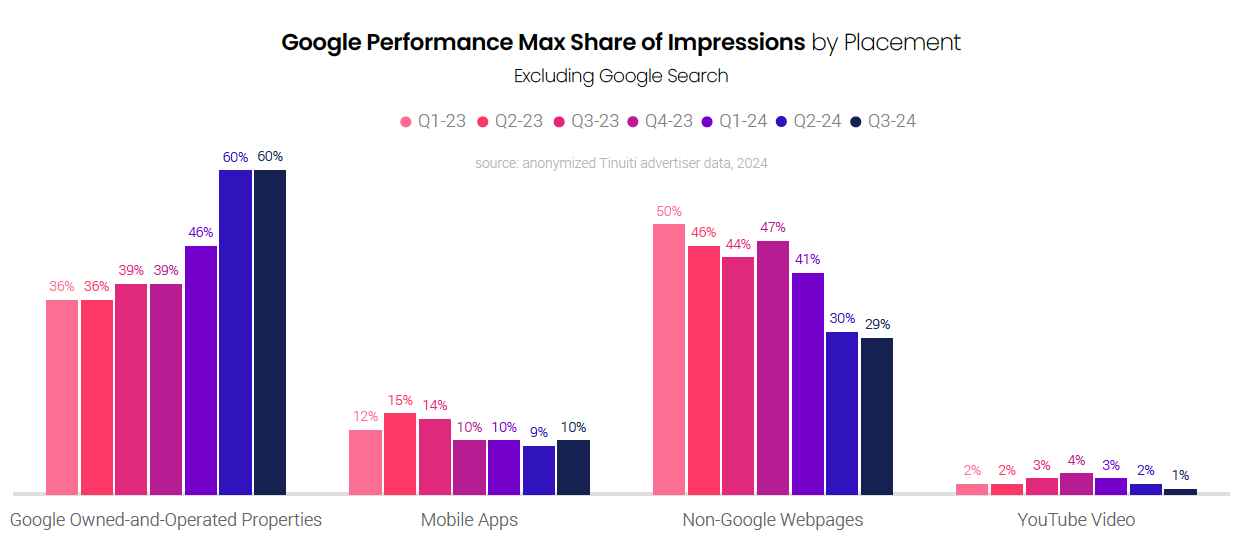
Outside of Google search, Google’s other owned-and-operated properties have driven a majority of PMax impressions for the last two quarters. The share of PMax impressions driven by mobile apps has been fairly steady at around 10% for the past year, but brands have seen a sharp drop in PMax impressions driven by non-Google webpages. In July, Google began providing advertisers with a breakout of YouTube videos in its Placements report, but YouTube accounted for just 1% of PMax placement impressions in Q3 for the average retailer.
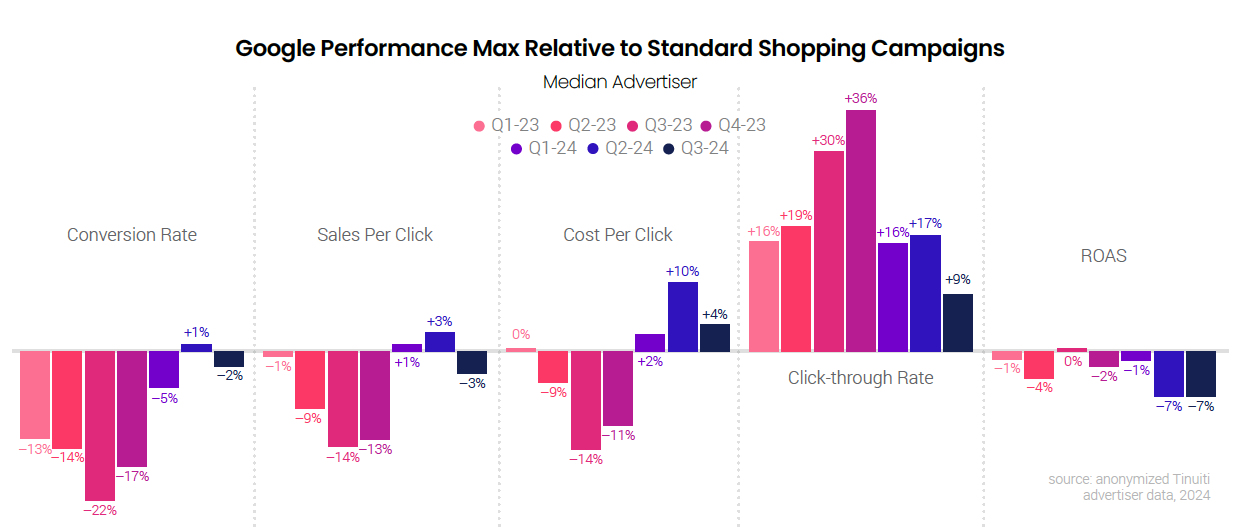
Along with the uptick in PMax cost share of non-shopping inventory, brands saw a drop in conversion performance for PMax campaigns relative to standard Shopping campaigns (SSCs), albeit a fairly small one. PMax conversion rates were 2% lower than that for SSCs in Q3 2024, down from a 1% advantage a quarter earlier. Similarly, PMax sales per click fell from a 3% advantage over SSCs in Q2, to a 3% deficit in Q3. With PMax CPCs also coming down relative to SSCs in Q3, advertisers were able to maintain the relative ROAS they generated in Q2.
Advertiser spending on Google text ad campaigns was up 7% Y/Y in Q3 2024, which was down from a 13% increase in Q2. Text ad spending growth has been driven primarily by CPC increases since the second half of 2023. Importantly, while Google prioritizes traditional text campaigns (officially known as Search campaigns) over Performance Max for text ad listings, how that plays out in the real world can get a little fuzzy and there are situations where PMax could cannibalize traditional text campaign traffic.
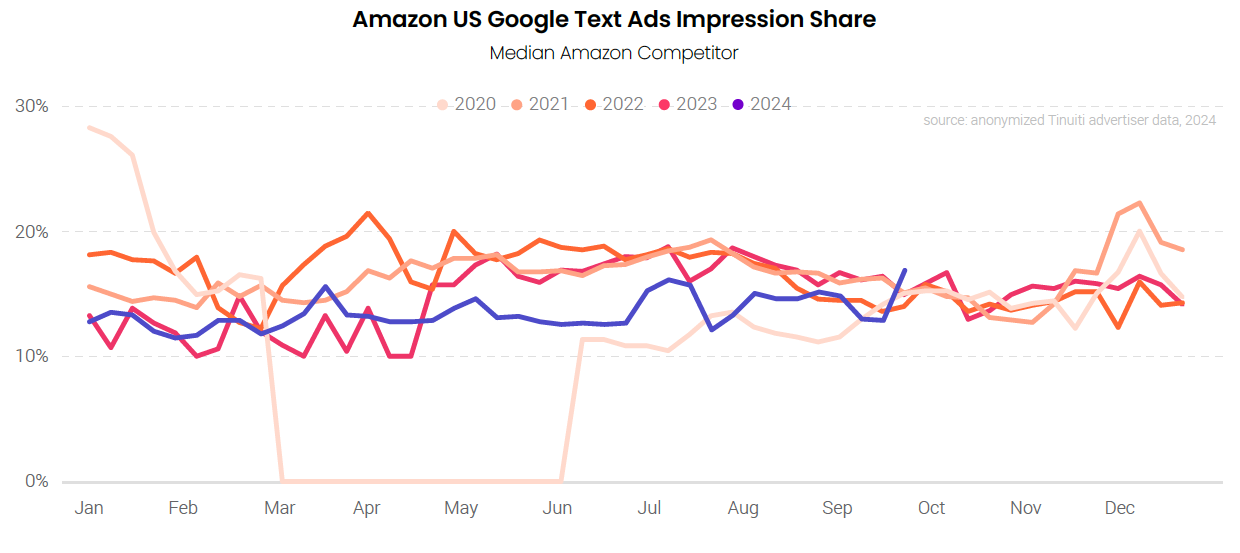
Weak growth for traditional Google text ad clicks has come at a time when one of the largest competitors for Google impressions, Amazon, has actually dialed back its presence in Google text ad auctions. Until the very last week of Q3, Amazon’s text ad impression share against the typical retailer was down compared to 2023 for 29 straight weeks. This decline does not appear to be related to the large investment Temu has made in digital ads as Temu’s presence in Google text auctions has been minimal.
Many factors can influence search ad click-through rate (CTR) trends, including tweaks to ad loads and formats, mix shifts in user queries and device usage, as well as changes to organic elements of the SERP. It’s difficult to untangle all of these factors, but considering the widespread launch of Google’s AI overviews in May, advertisers subsequently saw appreciable declines in CTR across multiple text ad segments.

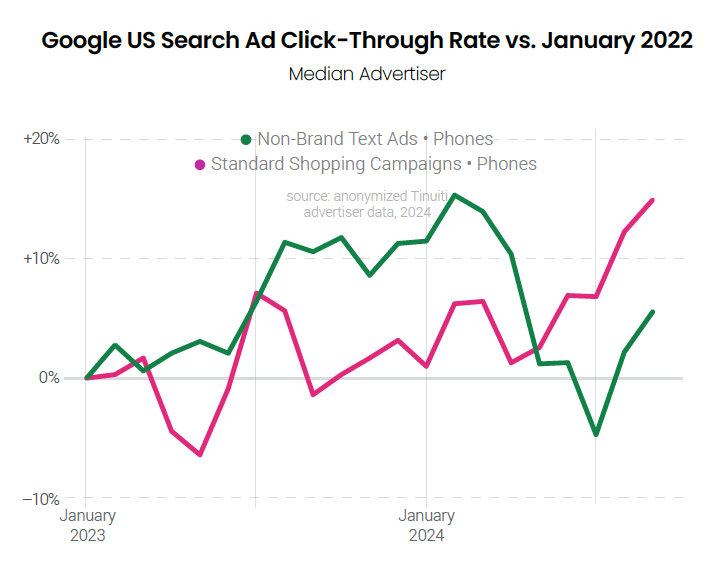
From April to a bottom in July, the non-brand keyword segment on phones saw the largest decline with CTR falling 14%. With AIOs more likely to show for non-brand queries and taking up a larger share of the screen on phones, this result is consistent with AIOs having a negative impact on text ad CTR, at least initially. Over August and September, CTR recovered across device and keyword segments. While click-through rate is still down 4% for the non-brand phone segment compared to April 2024, maybe more importantly, it is up 6% since the beginning of 2023.
The average click-through rate for standard Shopping campaigns has fared relatively well through the rollout of Google’s AI overviews, which may speak to how shopping listings tend to show for more directly commercial queries than text ad listings – in other words, the types of queries that are less likely to trigger AIOs. At the same time, there is overlap in the queries that trigger text and shopping ads, so some of the recent strength for shopping could be coming directly at
the expense of text listings, in a manner unrelated to AIOs.
The typical standard Shopping campaign advertiser saw CTR rise by14% on phones between April and September 2024. With a few ups and downs in between, standard Shopping campaign CTR had run roughly flat from the beginning of 2023 until the launch of AIOs.
Brands increased Amazon Sponsored Products investment 15% year over year in the third quarter, an acceleration from 8% the quarter prior. Prime Day helped boost Sponsored Products spend growth, with spend on the format rising 29% year over year during the event, nearly twice the format’s growth rate for Q3 as a whole. CPC rose 9% year over year in Q3 and clicks grew 6%. Amazon’s partnerships with platforms like Pinterest have not yet produced meaningful new volume for Sponsored Products advertisers.
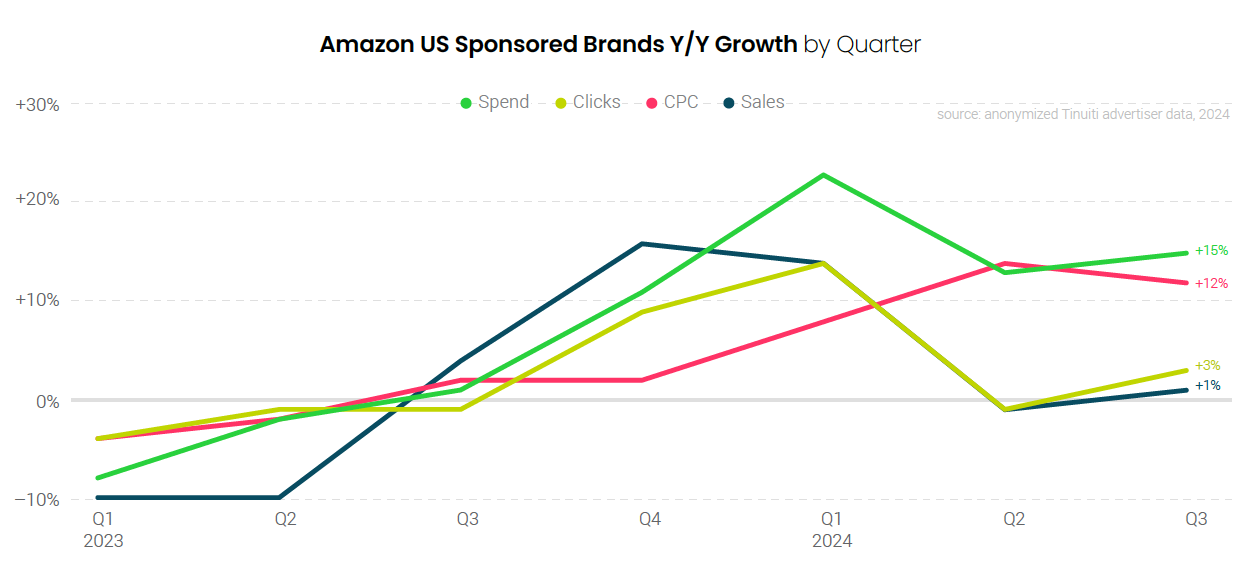
Amazon Sponsored Brands spend, including Sponsored Brands video investment, rose 15% year over year in the third quarter, the same growth rate as Sponsored Products campaigns. Clicks climbed 3% compared to a year prior and CPC increased 12%, marking the second straight quarter of double-digit CPC increases. The cost of clicks rose even more during the July Prime Day event when pricing jumped 15% compared to Prime Day 2023.
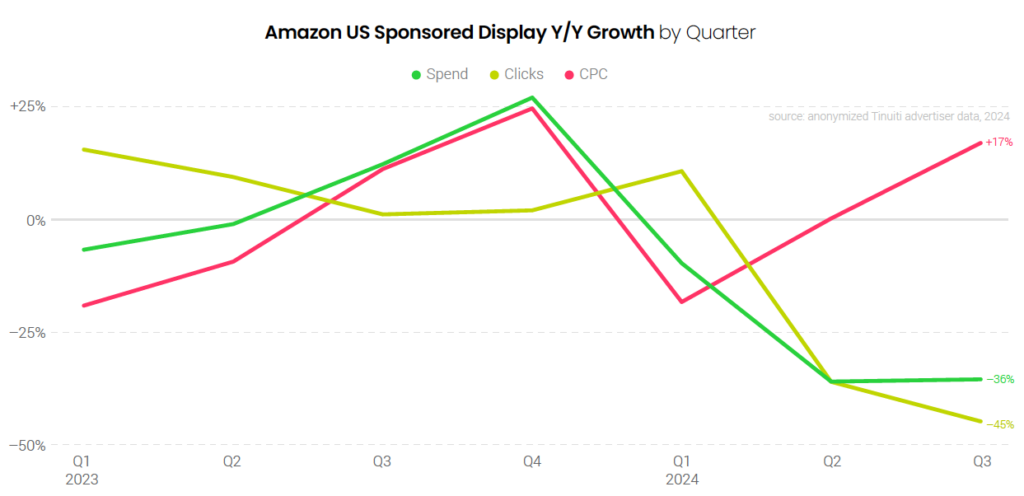
Advertisers pulled back on Sponsored Display campaigns in the third quarter with spend down 36%, the same decline observed in Q2. While Sponsored Display spend is waning, advertisers continue to significantly ramp up investment in the Amazon demand-side platform (DSP) which saw spend rise 26% year over year in Q3. As such, display advertising is still hugely important for Amazon advertisers.
Amazon advertisers ramped up Prime Day investment in Sponsored Products by 29% year over year, marking the second straight year of Amazon’s premiere sales event that the format grew at a faster pace than the other two Ad Console campaign types, Sponsored Brands and Sponsored Display. Prime Day CPC for Sponsored Products and Sponsored Brands rose 12% and 15% Y/Y, respectively, as advertisers competed for high intent shoppers.
Shoppers identified as new-to-brand by Amazon, defined as those customers who have not purchased from a brand in the last twelve months, accounted for 66% of all conversions attributed to Sponsored Brands for the median Tinuiti advertiser. Heading into the Q4 holiday shopping season, marketers should be taking new-to-brand share into account when optimizing advertising strategy, particularly given that key days like Black Friday and Cyber Monday typically sees spikes in the share of conversions categorized as new-to-brand.

For the sixth straight quarter Walmart search advertisers increased spend on Sponsored Products by at least 20%, with clicks flat year over year in Q3 and CPC rising 20%. The 20% increase in CPC is the slowest growth observed since Q2 2023, as pricing grew by at least 30% in each of the last four quarters as brands lapped a year in which CPC was depressed thanks to Walmart’s change from a first-price auction to a second-price auction.
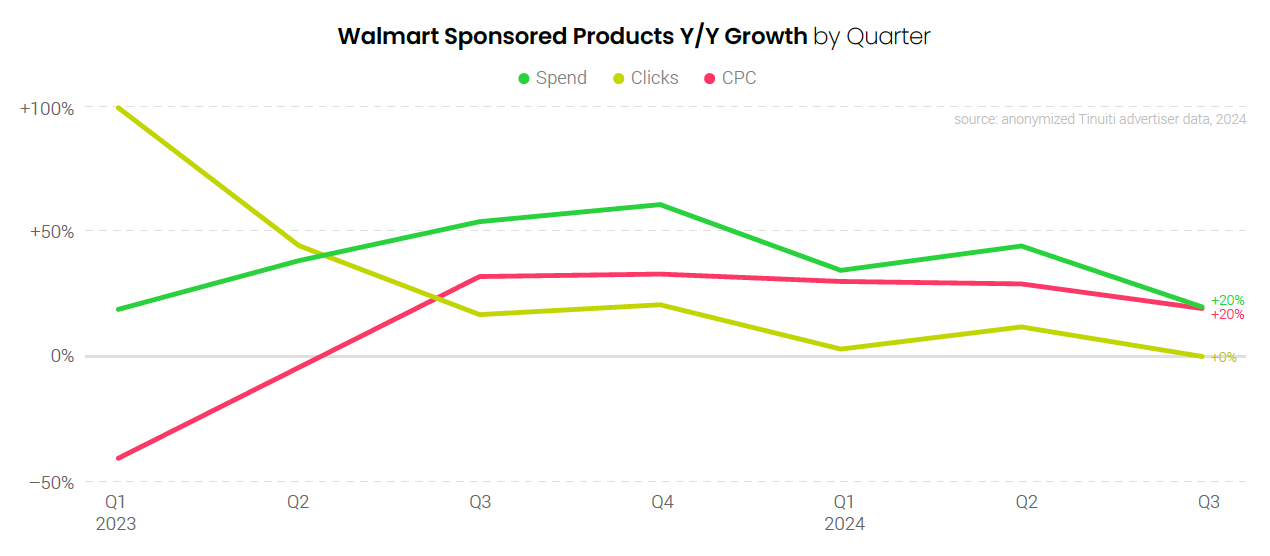
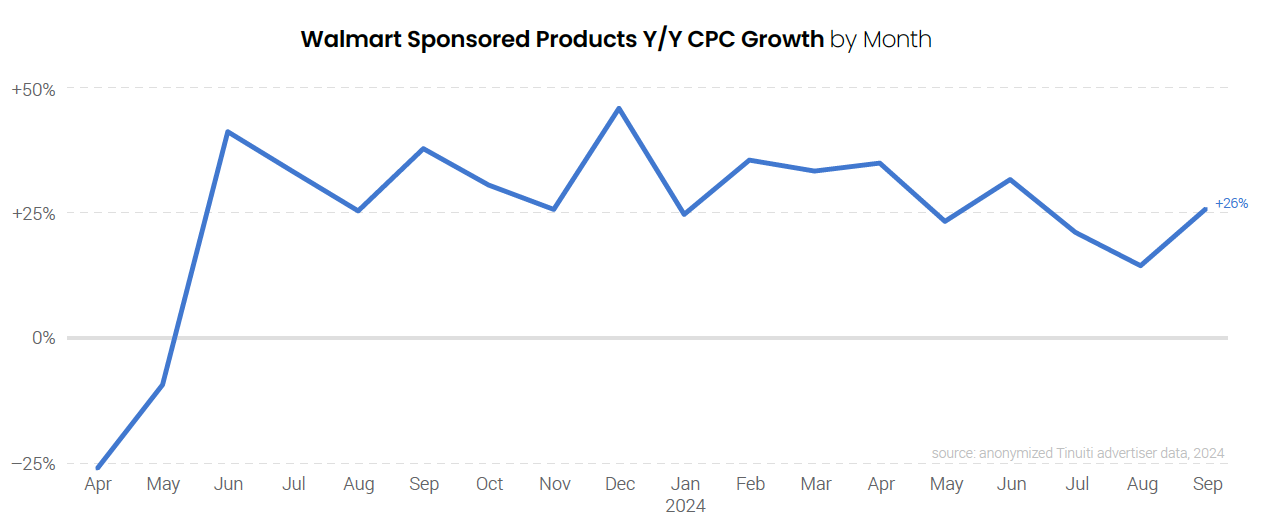
CPC growth for Walmart Sponsored Products ads slowed to just 14% in August 2024, the slowest rate of growth since May 2023, but ramped back up 26% in the final month of the quarter. While year-over-year CPC growth from Q2 2022 through Q2 2024 was primarily a result of the aftermath of Walmart’s change to a second-price auction model, changes in pricing are now more indicative of shifts in the value of ad clicks, as the sales per click of Walmart Sponsored Products rose 22% in the third quarter compared to a 20% increase in CPC.
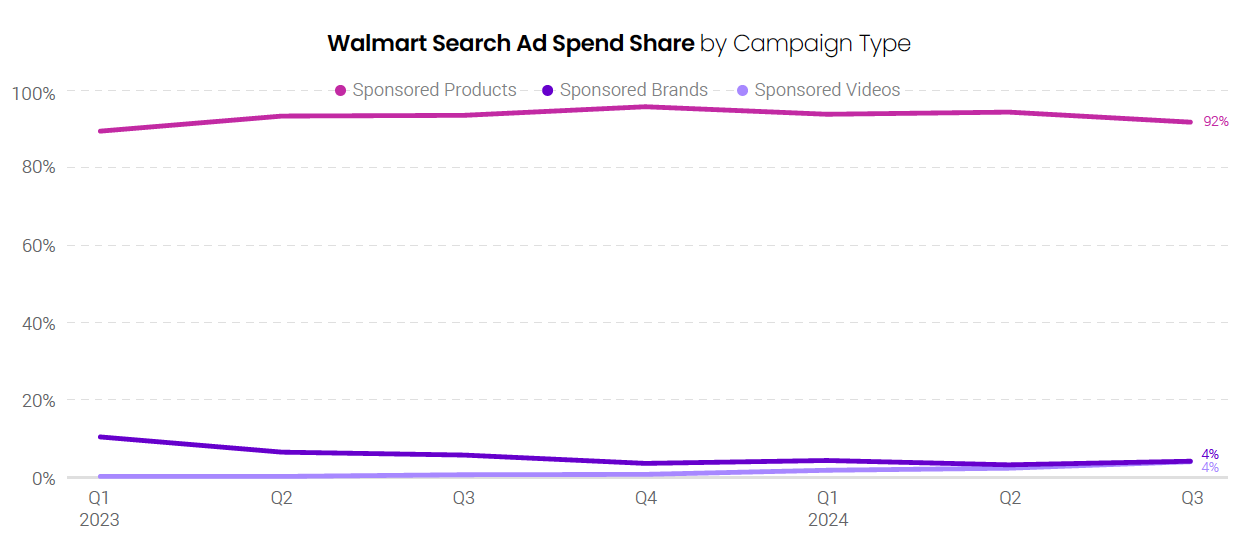
Sponsored Videos now account for 4% of all Walmart search advertising investment, up from just half of a percent a year prior, as the newest format in Walmart’s search advertising suite is steadily becoming a more important part of advertiser strategies. Sponsored Products continues to account for the vast majority of Walmart search spend with 92% share in Q3 2024, with Sponsored Brands accounting for the remaining 4% of spend.
Spending on YouTube ads grew 11% in Q3 2024, down from 28% growth a quarter earlier. In Q2, Tinuiti advertisers saw a spike in impression volume that drove up spending while depressing average CPM. The deceleration in spending growth in Q3 is more in line with official YouTube revenue metrics and more reflective of strengthening year-ago spending growth comparisons.
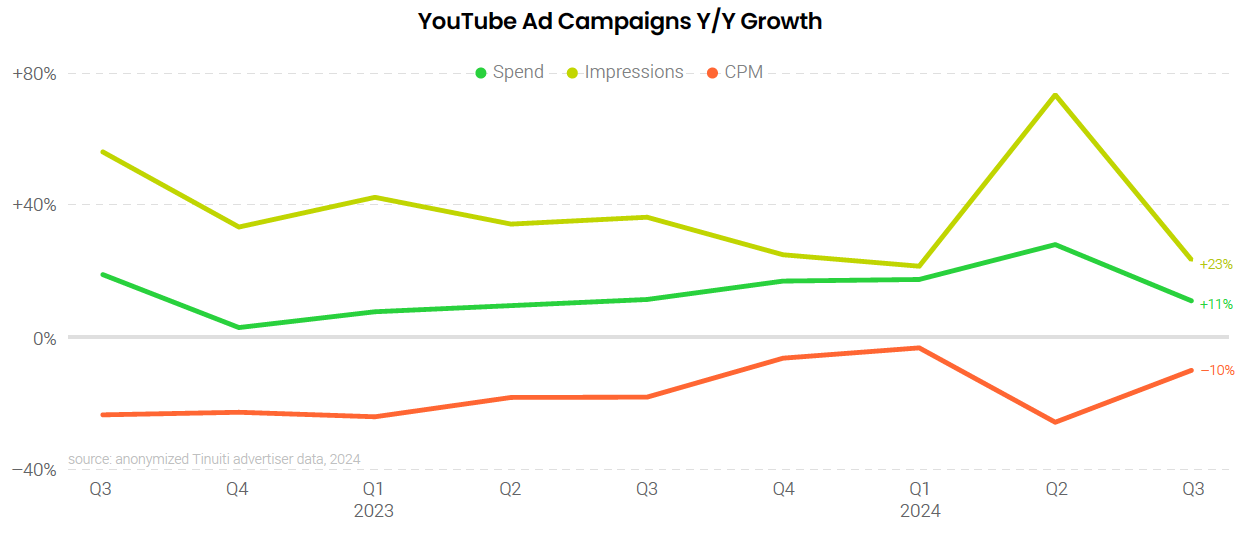
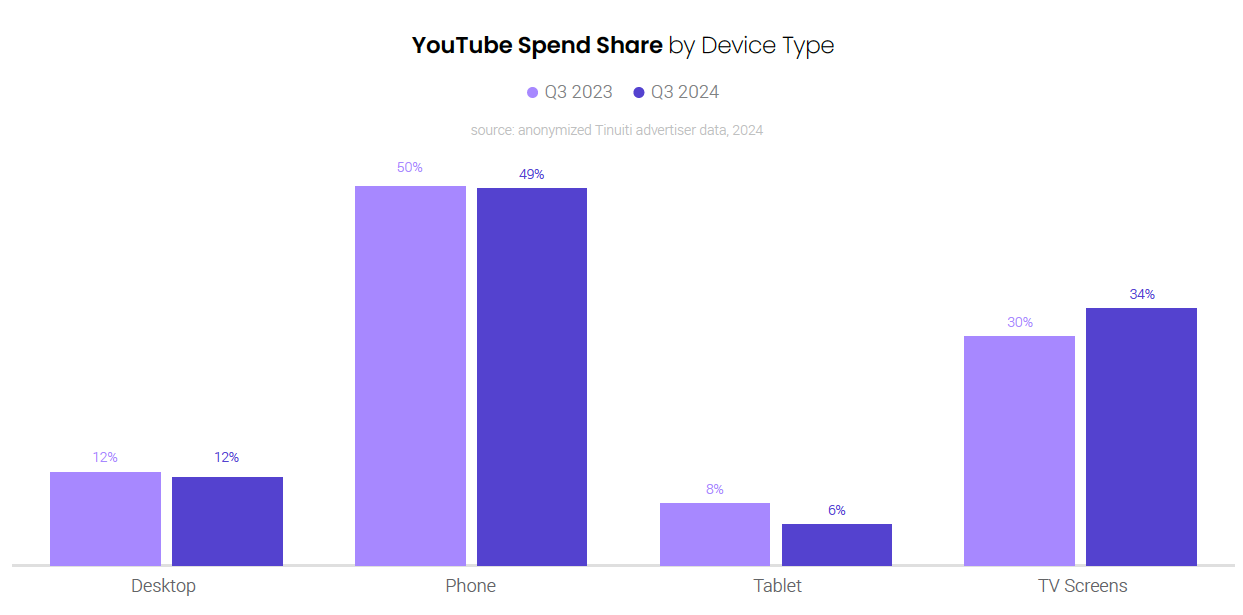
TV screens accounted for 34% of YouTube spending in Q3 2024, up from 30% a year earlier. Spending on YouTube ads on TVs was up 24% Y/Y, more than double the rate of growth of other devices. YouTube ad spending on phones was up 10% Y/Y in Q3, but phone share of spend slipped from 50% in Q3 2023 to 49% in Q3 2024. Tablets saw the greatest decline in spend share from year to year with tablets accounting for 8% of spend in Q3 2023 and 6% in Q3 2024.
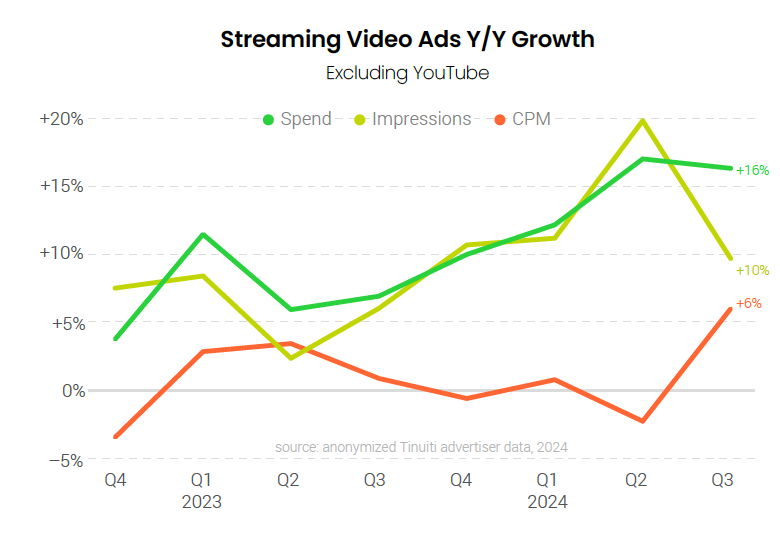
Spending on streaming video ads outside of YouTube was up 16% Y/Y in Q3 2024, just a slight deceleration from Q2. Advertisers saw impression growth slow from Q2 to Q3, however, while average CPM growth increased from a 2% decline in Q2 to a 6% increase in Q3. The launch of streaming ads in Amazon Prime Video in January 2024 has bolstered streaming ad spending as advertisers roughly doubled their investment in the platform from Q2 to Q3.
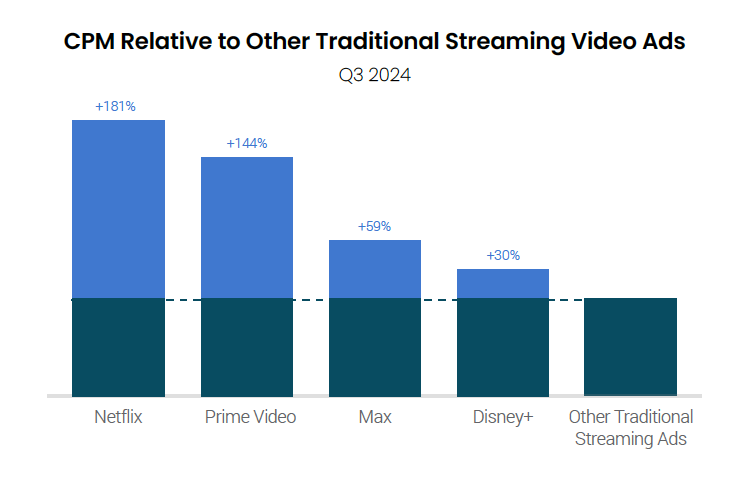
The rise of Prime Video ads has helped to drive total streaming pricing higher as Prime Video saw CPMs run nearly 2.5 times that of the traditional streaming video ad average in Q3 2024. This was ahead of other major streaming platforms like Max and Disney+, but a bit behind Netflix. In Q3 2024, Netflix CPMs were 2.8 times that of the traditional streaming ad average.
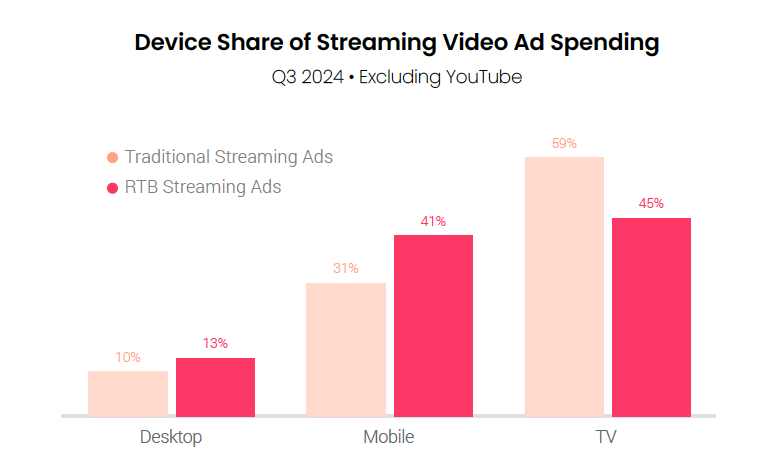
TV screens generated 59% of traditional streaming ad spending in Q3 2024 compared to 45% of spending on streaming inventory purchased through real-time bidding. Mobile devices, including both phones and tablets, accounted for 31% of traditional streaming ad spending, but 41% of RTB spending in the quarter. Desktop accounted for 10% and 13% of spending on traditional and RTB ads, respectively.
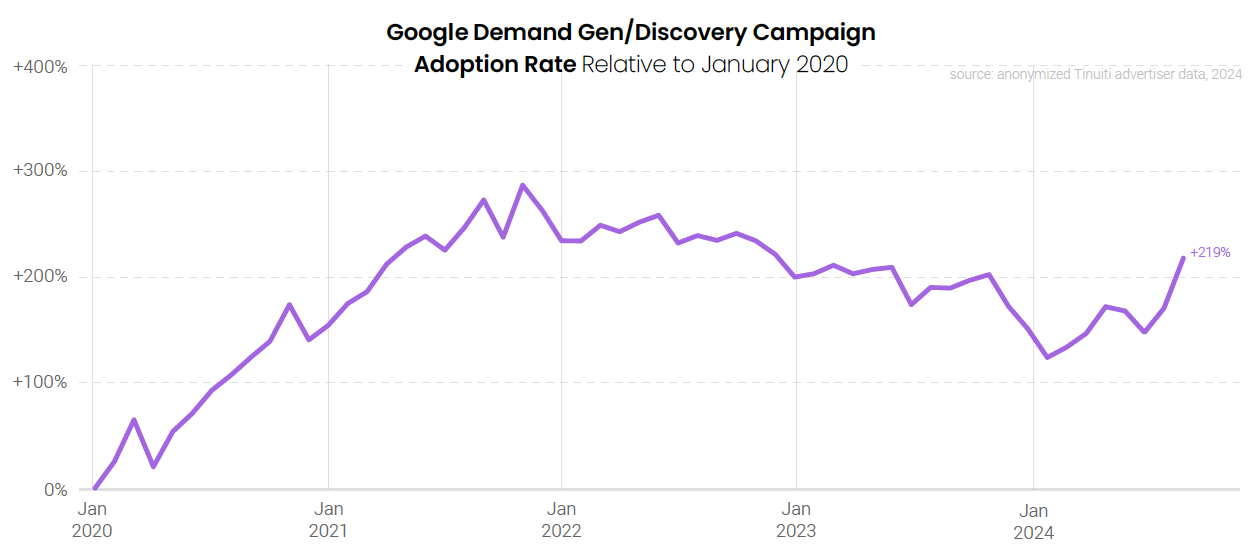
Google Demand Gen campaigns, formerly known as Discovery campaigns, saw increased advertiser adoption in Q3 as brands looked ahead to the all-important Q4 holiday shopping season. Adoption rates for Demand Gen campaigns hit a 21-month high in September and may have room to increase further as they tend to spike during the peak of the holiday shopping season. Google began transitioning to the current Demand Gen model in Q4 2023, which including bringing in YouTube Shorts inventory.
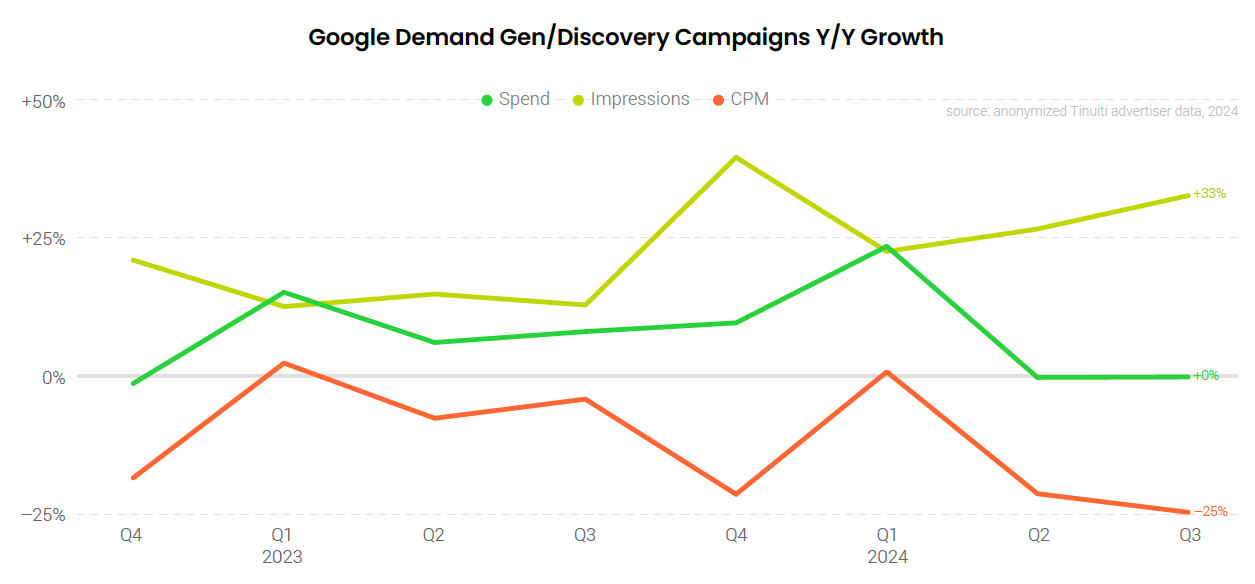
Although Google Demand Gen campaigns saw strong adoption trends in Q3, advertisers that have remained consistently active in this space saw no spending growth for the second straight quarter. While Demand Gen campaigns have seen strong impression growth year over year, those gains have been offset by large decreases in average CPM.
Tinuiti advertiser spending on the Google Display Network (GDN) rose 10% Y/Y in Q3 2024, down slightly from 11% growth a quarter earlier. GDN impressions fell 1% Y/Y in Q3, following a 4% increase a quarter earlier. The average CPM for the GDN increased by 11% Y/Y in Q3, following a 7% increase a quarter earlier. Heading into Q3, Google had officially reported eight straight quarters of revenue declines for its “Other Ads” segment that excludes Google search and YouTube.

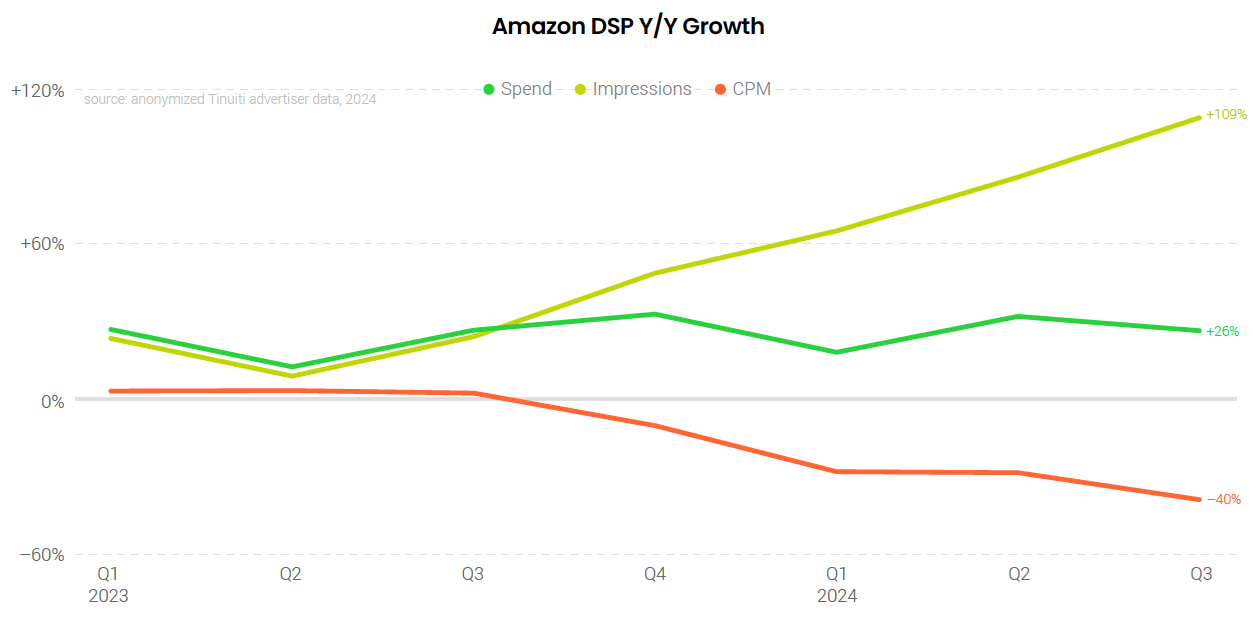
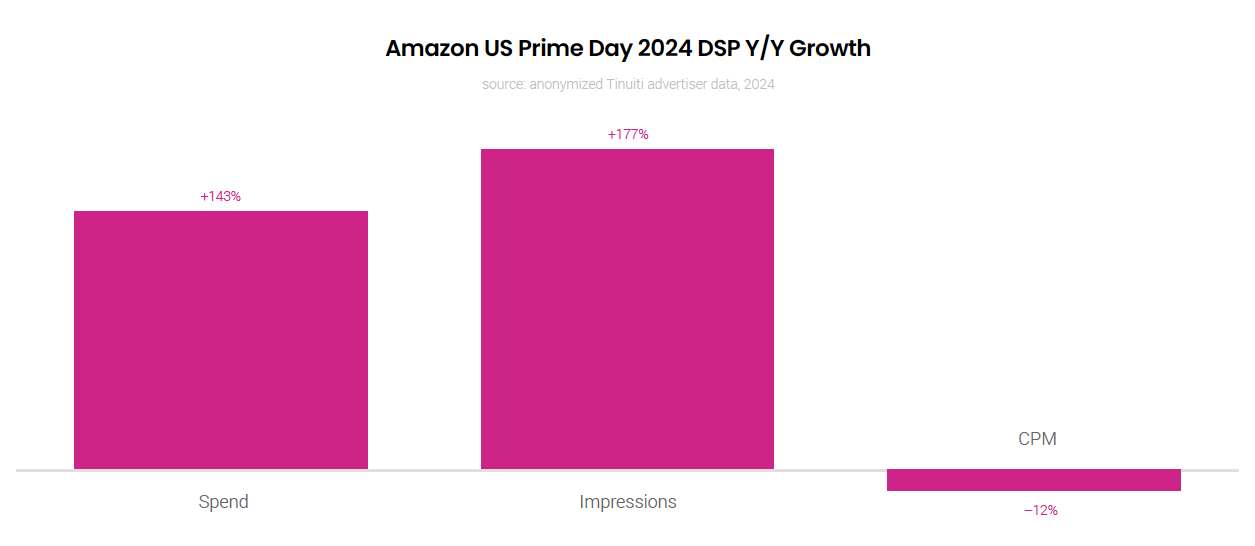
Advertisers increased investment in the Amazon demand-side platform (DSP) by 26% year over year in the third quarter, slower than the 32% observed in Q2 but still faster than any of the three campaign types available through the Amazon Ad Console: Sponsored Products, Sponsored Brands, and Sponsored Display. Amazon DSP impressions more than doubled year over year, while CPM fell for the fourth straight quarter and declined 40% compared to last Q3.
During Amazon Prime Day 2024, held on July 16 and 17, advertisers ramped up spend on the DSP by 143% compared to Prime Day 2023, held on July 11 and 12. Not only did brands spend big during Prime Day, but advertisers also ramped up spend in the days leading up to the two-day event to warm up shoppers, and kept spend elevated post-Prime Day to stay in front of customers who may have viewed products during the event.
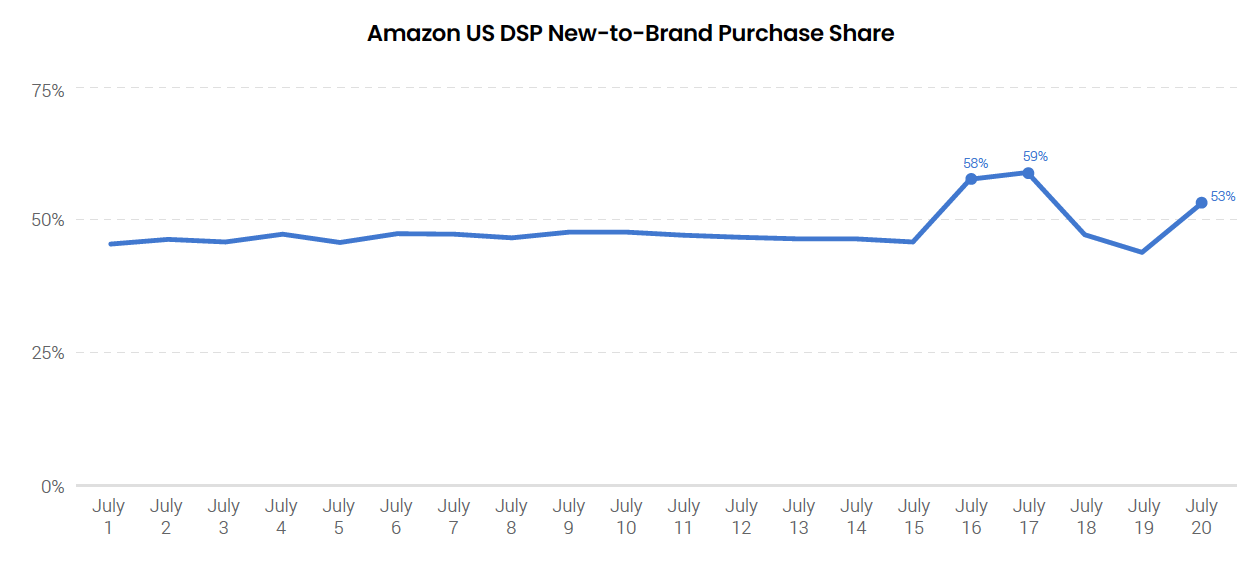
The share of purchases attributed to Amazon DSP advertising which were identified as coming from new-to-brand customers, defined as those shoppers who have not purchased from a brand in the past year, jumped from an average of 47% in the first two weeks of July to 59% during Prime Day. Big sales events like Prime Day typically produce elevated shares of new-to-brand customers which is part of the reason brands increase investment during these times.
Check out our most recent Digital Ads Benchmark Report for more exclusive insights.
