Why ROAS Alone Doesn’t Tell the Full Story of Media Performance


ROAS is one of the most searched and most misunderstood metrics in paid media—largely because the formula is simple, but the judgment behind it isn’t. Before getting into how ROAS is calculated, benchmarked, and improved, there are key principles that separate a surface-level reading of performance from one that can actually guide business decisions:
Return on ad spend (ROAS) measures the gross revenue generated from advertising relative to the amount spent to produce that revenue. At its simplest, it answers the question: How much revenue did each advertising dollar return?
That makes ROAS helpful for:
But ROAS is not a profitability metric on its own. And it was never designed to answer every question a CMO or CFO needs answered. Revenue alone doesn’t tell you whether a campaign is creating value once you account for margin, fees, returns, customer value, incrementality, and business model differences.
That distinction matters because a campaign can look highly efficient in a dashboard while still being the wrong place to invest the next dollar.
ROAS sits in the middle of the measurement stack. It connects with metrics like CAC, CPA, conversion rate, AOV, and LTV, while also informing bigger questions around contribution profit and enterprise value. It is strongest when you need to compare channel efficiency, and weakest when you need to understand brand lift, incrementality, or delayed revenue.
The basic formula for ROAS is:
ROAS = Revenue Attributed to Ads ÷ Ad Spend
So if you spend $10,000 on advertising and generate $40,000 in attributed revenue, your ROAS is 4:1, or 400%.
That formula is easy to write down. The harder part is deciding what counts as “revenue,” what counts as “spend,” and which attribution model you trust enough to make a budget decision from.
Most teams start a ROAS conversation by asking what’s “good” for their industry. That’s the wrong first question. Break-even ROAS is a far better planning input than a generic benchmark because it’s derived from your own margin structure, not an average across thousands of businesses with completely different cost profiles.
The math itself is simple: Break-even ROAS equals 1 divided by your gross margin. A brand operating on a 25% margin needs a 4:1 ROAS just to cover the cost of the sale, before it generates a dollar of actual profit. A brand operating on a 60% margin only needs a 1.67:1 ROAS to hit that same breakeven point. That means a “4:1 ROAS” can represent two completely different outcomes: barely breaking even for the low-margin brand, and generating strong profit for the high-margin one.
This is why category benchmarks can be actively misleading if used as a target instead of a reference point. A low-margin category, like grocery or commoditized electronics, needs a meaningfully higher ROAS just to stay profitable, while a higher-margin category, like beauty or apparel with strong brand equity, has more room to operate below what looks like an “impressive” number and still come out ahead. Calculating your own break-even ROAS before setting platform targets ensures you’re optimizing toward your business’s actual economics, not toward a number that sounds good in a benchmark report.
These four metrics get used interchangeably in casual conversation, but they’re answering fundamentally different questions, and conflating them leads to decisions that look sound on the surface and fall apart under scrutiny.
ROAS measures revenue returned for every dollar of ad spend. It’s fast, it’s simple, and it’s useful for comparing efficiency across channels or campaigns. But it stops at revenue, it never accounts for what that revenue actually cost to produce beyond the media line item.
ROI goes a step further, measuring profit relative to total investment, including product cost, fulfillment, overhead, and any other expense tied to the sale. A campaign can post an excellent ROAS while delivering a mediocre or even negative ROI if the underlying product economics are thin.
CPA and CAC operate at a different layer entirely. CPA tells you what a single conversion cost, which is useful for tuning bids and budgets, but it says nothing about whether that conversion was worth $20 or $200 in revenue. CAC tells you what it costs to acquire a customer, which matters enormously for subscription and repeat-purchase businesses, but again, in isolation, it doesn’t capture the lifetime value that customer will eventually generate. A high CAC can be a great investment for a brand with strong retention, and a low CAC can be good for a brand that never sees that customer again.
| Metric | What it measures | Best use | Main limitation |
| ROAS | Revenue returned for every ad dollar spent | Channel efficiency and budget comparison | Can miss margin, attribution gaps, and offline impact |
| ROI | Profit returned relative to total investment | Business profitability | Requires broader cost inputs and is slower to calculate |
| MER | Total revenue divided by total marketing spend | Board-level view of blended performance | Hides channel-level nuance |
| CAC | Cost to acquire a customer | Acquisition efficiency | Doesn’t capture revenue quality or LTV |
| CPA | Cost per conversion | Conversion efficiency | Can look strong even when order value is weak |
None of these metrics is wrong to use. The mistake is picking one and asking it to answer a question it wasn’t built to answer.
If ROAS is the metric marketers live in day to day, MER is usually the metric the board actually asks about. Marketing efficiency ratio, calculated as total revenue divided by total marketing spend, strips out platform-by-platform attribution entirely and looks at the business’s overall media efficiency in one number.
That sounds like a step backward in precision, but it’s often a step forward in accuracy. Platform-reported ROAS is vulnerable to overlapping credit, where two or three channels all claim partial responsibility for the same sale, which means the sum of every channel’s individual ROAS can overstate the business’s actual blended efficiency. MER can’t be inflated that way, because it’s measured against total revenue and total spend, not against whatever each platform’s attribution model chooses to report.
That makes MER especially useful in two situations: when multiple channels are working together to create demand, so no single platform’s ROAS tells the full story, and when reporting up to executives or finance, who care less about which platform gets credit and more about whether marketing as a whole is producing an efficient return. A team that only reports channel-level ROAS to leadership is often having the wrong conversation. A team that pairs channel ROAS with blended MER is giving the board both the tactical detail and the strategic picture at once.
There is no universal good ROAS, and any benchmark presented without heavy caveats should be treated skeptically. What counts as strong performance depends on channel, margin profile, audience mix, and where a given campaign sits in the funnel, which means the same number can represent very different outcomes for two different brands, or even two different campaigns inside the same account.
This is also where the break-even ROAS concept becomes practical rather than theoretical. A strong ROAS does not automatically mean a strong business outcome, and a lower ROAS is not automatically a problem. A campaign generating a 3:1 ROAS while acquiring profitable new customers who go on to make repeat purchases may be a far better investment than a campaign generating a 6:1 ROAS entirely from remarketing to shoppers who were going to buy anyway. The number alone tells you almost nothing without knowing what role that spend is playing, and reading a benchmark table without that context is one of the fastest ways to make a wrong call with confidence.
Benchmarks are directional, not universal. The data in our Q2 2026 Digital Ads Benchmark Report, compared to Q1 data, shows exactly why: the same platform can look wildly efficient or inefficient depending on what’s driving the number underneath it.
| Channel | Q2 2026 Signal | How to Think About It |
| Amazon Sponsored Products | Spend up 38% YoY, nearly double Q1’s 21% growth | Largely a Prime Day pull-forward effect (moved from July into June); treat this quarter’s efficiency gains as partly a calendar artifact, not a durable improvement |
| Amazon DSP | Spend growth accelerated from 41% in Q1 to 67% in Q2, the fastest-growing line in the report | Strong signal, but inflated by the same Prime Day timing shift; expect a much tougher Q3 comparison |
| Amazon Sponsored Brands | Growth jumped from 3% in Q1 to 20% in Q2 | Confirms the Prime Day effect is showing up across every Amazon ad product, not just Sponsored Products |
| Google Search | Spend up 14% YoY in both Q1 and Q2, on nearly flat CPCs (0% to +1%) | Healthy, volume-led growth; one of the more “real” efficiency stories this quarter |
| Google Shopping / PMax | Shopping spend up 18% YoY; PMax’s share of Shopping budget fell from 67% in Q1 to 60% in Q2 as its cost and sales-per-click advantage softened | Current low CPCs are partly a byproduct of Amazon’s continued absence from Google Shopping auctions, not a pure efficiency win |
| Spend up 7% YoY, entirely price-led: CPM rose 13% while impressions fell 5% | Advertisers paid more for a shrinking audience; a rising ROAS number here would be misleading without that context | |
| Spend up 17% YoY on flat CPMs, driven by Reels now at 35% of impressions | Volume-led growth; a materially healthier story than Facebook despite living on the same platform | |
| YouTube | Total spend up 15% YoY, but TV-screen viewing specifically grew 45% YoY and now drives 75% of YouTube video spend | Citing the headline 15% number alone would understate what’s actually happening on the highest-value inventory |
Industries with higher margins or stronger repeat-purchase behavior can tolerate a lower first-purchase ROAS than lower-margin categories, since the math of break-even ROAS changes with the cost structure. Apparel, beauty, CPG, electronics, home goods, subscription, and B2B all require different benchmarks because the underlying margins and buying cycles are not the same, and a “good” ROAS in one category can be a losing number in another.
Platform ROAS can be useful, but it should never be treated as the whole truth. Attribution windows, tracking gaps, modeled conversions, and different crediting rules all shape the number you see, which means two platforms can report very different ROAS for the same outcome.
ROAS can look very different depending on how you define the inputs. One team may report using gross revenue and media spend alone. Another may use net revenue after returns and include creative, agency, and technology costs. Both are technically reporting ROAS, but they are measuring different things.
| Input choice | Common option | Why it matters |
| Revenue basis | Gross revenue / net revenue / new-customer revenue | Changes the number dramatically depending on business model |
| Spend basis | Media only / fully loaded cost | Impacts whether ROAS reflects tactical efficiency or true investment efficiency |
| Attribution model | Platform-reported / analytics / MMM / incrementality | Determines what gets credit for the sale |
| Time window | Same-day / 7-day / 30-day / custom | Affects how much delayed revenue gets counted |
The formula may be simple, but the inputs are where teams often diverge. One brand’s ROAS may be based on gross revenue and media spend alone, while another may use net revenue after returns and include creative, agency, and technology costs. Those are very different measures, even if they carry the same label.
Even after correcting for these tactical distortions, platform ROAS still can’t see revenue that happens outside its own reporting window: in-store purchases influenced by media, halo effects from upper-funnel channels showing up as branded search or direct traffic later, and cross-device or cross-session paths that never get stitched back together. Those blind spots don’t show up as data errors. They show up as a channel that looks worse than it actually is, which is exactly the setup that leads brands to cut media that’s quietly protecting their largest revenue streams.
The funnel didn’t just get messy, it got invisible in the places that matter most. Media no longer moves customers along a single, traceable path, and revenue no longer lands in one clean, attributable place. That’s what Holistic ROAS is built to fix.
Holistic ROAS is the most comprehensive measurement framework inside our Bliss Point Marketing Operating System, the tech that unifies brand and performance decisions across audience, creative, media, and measurement. Where Bliss Point governs how those decisions get made across a client’s business, Holistic ROAS ensures they’re made with complete information rather than whatever slice of data happens to be easiest to see. That distinction matters because measurement problems and decision-making problems are often the same problem wearing different clothes.
When commerce, DTC, and retail data don’t reconcile cleanly, and a brand’s true contribution to revenue stays invisible across disconnected systems, decisions inevitably get made in a vacuum. A media plan gets built on whatever the most visible dataset shows, and the channels doing quieter, harder-to-measure work get treated as underperformers. Holistic ROAS brings every measurement model together, uniting brand and performance under one view so the decision engine behind the plan is built on the full impact of every dollar spent, rather than a handful of siloed metrics fighting for credit. The goal is a budget plan grounded in actual margin, one a CFO can interrogate and a media team can execute.
Measurement tech that shows what’s driving growth—and what’s holding it back.

Most measurement models suffer from a kind of tunnel vision: they over-credit last-click channels while quietly ignoring the halo effect that brand media has on the rest of the funnel. That bias doesn’t just distort reporting, it actively leads to wasteful decisions, because channels doing real work get undervalued or cut, while channels harvesting demand get more budget than they’ve earned.
A real example makes this concrete. A home goods client was preparing to cut its streaming video investment because direct DTC revenue looked weak in isolation. Under a Holistic ROAS view, a different picture emerged: while the channel’s direct DTC returns did fall short of target, its impact on in-store revenue had been severely undercounted, to the point that its true holistic return significantly exceeded the original goal. The client reversed the decision, protected its largest revenue stream, and avoided a cut that would have looked reasonable on paper and been wrong in practice.
Holistic ROAS delivers on that connected view in a few concrete ways:
Not all revenue is created equal, and treating it as if it were is one of the most common ways media plans lose efficiency. A sale on Amazon, Sephora, or Walmart carries a different fee and margin structure than a sale on a brand’s own DTC site, yet most measurement approaches optimize toward top-line volume as though every dollar of revenue is worth the same to the business. Holistic ROAS applies revenue weighting control, so optimization decisions are grounded in actual profit rather than gross sales, and so disparate teams, from commerce to brand, can operate from a single source of truth that still respects the nuances of each business unit.
That real-world profitability lens is what makes it possible to find the efficiency frontier, the point where additional spend stops producing proportional value. A second example illustrates why that matters: a client needed to hit 15% revenue growth on a flat budget, with no room for incremental investment. Holistic ROAS identified that paid social had already reached a point of diminishing returns, and recommended shifting that budget into paid shopping instead, where more room to grow still existed. By moving dollars from a saturated channel into one with real headroom, the client hit its 15% growth target without spending an additional dollar.
The same efficiency-frontier thinking applies to timing distortions, not just channel saturation. Amazon’s decision to pull Prime Day forward into late June drove Sponsored Products spend up 38% year over year in Q2 2026, and Amazon DSP spend up 67%, nearly double each channel’s Q1 growth rate. Read in isolation on a quarterly dashboard, that looks like a sudden leap in Amazon efficiency, one that might tempt a team to pour more budget in immediately. Read through a holistic lens, it’s a calendar shift borrowing demand from Q3, which means the smarter response isn’t to chase the spike but to plan the back half of the year around the tougher comparison it’s about to create. That is the difference between optimizing for the best possible number this week and optimizing for enterprise value across the whole business.
Get ad spend benchmarks for top channels, from marketplaces to social media.

The mechanics behind Holistic ROAS are built to solve a problem that most measurement models never address: even a perfect media mix is worthless if it can’t actually be executed. Isolated media mix models often produce a theoretically optimal plan that ignores contracts, upfront commitments, or category spend caps, which means the “ideal” allocation is one a brand could never actually buy.
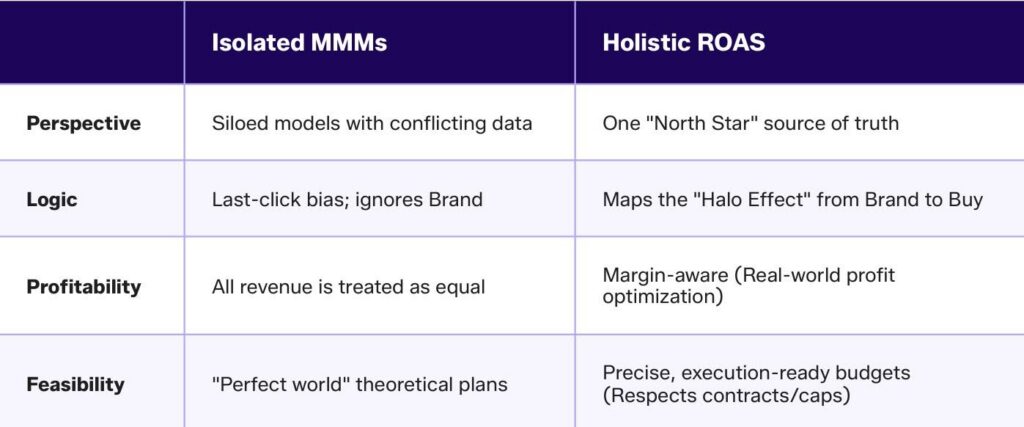
Holistic ROAS is built around real-world constraints instead of theoretical ones:
That combination, real constraints, real margins, and a real view of total revenue, is what separates a decision-making tool from a reporting dashboard. Most measurement tools hand you a chart and call it insight. Holistic ROAS hands you a budget decision you can actually defend.
Improving ROAS starts with measurement, not tactics. It’s tempting to jump straight to bid adjustments, budget shifts, or creative refreshes, but if the underlying inputs are wrong, every optimization built on top of them is just compounding the error. A team that “improves” ROAS by fixing a broken tracking setup hasn’t actually improved performance; it’s corrected a distortion. That distinction matters, because the two get confused constantly, and it’s usually the reason last quarter’s optimization didn’t hold up this quarter.
In a world where Google, Meta, Amazon, and retail media networks are all claiming credit for the same sale, the first job is understanding what’s truly incremental and what’s just shifting reported ROAS from one surface to another.
Before any budget call gets made, the tracking, attribution, and incrementality behind the number need to hold up to scrutiny. That means:
None of this is exciting work, and it rarely gets credit the way a bid strategy change does. But it’s the difference between optimizing toward a real signal and optimizing toward noise.
Incrementality can help marketers identify sources of ad waste and understand which touchpoints promote growth. Our playbook explains it all.

Once the measurement foundation is solid, the next lever is moving spend toward channels, audiences, and products that still have room to grow, rather than defending whatever already looks efficient on the surface.
On Google, Tinuiti’s Q1–Q2 2026 benchmark data shows Shopping and Performance Max delivering strong click growth on largely flat CPCs, helped by Amazon’s continued absence from Google Shopping auctions. On Amazon itself, Sponsored Products and DSP have seen accelerated spend growth off the back of Prime Day’s move into June, with Sponsored Products up 38% year over year and DSP up 67% in Q2 2026. On Walmart Sponsored Products, clicks were up 57% year over year with spend up 62% in Q1 2026, as advertisers leaned harder into commerce search.
Viewed through a purely platform-ROAS lens, all of those numbers look like places to push more budget. Viewed through an efficiency frontier lens, the questions change:
The goal is not to chase the highest reported ROAS in isolation. It’s to improve total return in a way that supports the business’s margin and growth goals simultaneously, which sometimes means intentionally accepting a lower ROAS in one place because it unlocks more total value somewhere else, including shifting dollars between Amazon search, retail media placements, and DTC search/social when one surface is clearly saturated.
The details downstream of the click matter as much as the media strategy upstream, and retail media makes that especially obvious.
In commerce-heavy environments, those details often make the difference between a channel that merely spends and one that compounds return over time. A media plan can be strategically sound and still underperform if the execution layer beneath it is neglected, and retail media is where that gap shows up fastest because media and merchandising interact so directly.
Most ROAS-related budget waste doesn’t come from bad strategy. It comes from a handful of recurring, avoidable habits that show up across almost every account we look at.
Platform reporting is genuinely useful for in-platform optimization, but it was never designed to be the sole input for cross-channel budget decisions. Every platform is built to claim as much credit as its attribution model allows, which means when multiple platforms are involved in the same customer journey, they can all report strong ROAS for the same conversion. Added together, the numbers overstate what actually happened. Treated as final truth rather than one input among several, reported ROAS can become more flattering than useful, and budget decisions made on that basis tend to reward whichever platform is best at claiming credit rather than whichever platform is actually driving the most value.
Prospecting, branded search, remarketing, and retail media all play fundamentally different roles, so holding them to the same ROAS threshold sets at least some of them up to fail by design. A campaign built to create new demand should not be evaluated the same way as one built to harvest demand that already exists:
Managing both to one number either strangles the campaigns creating future growth or masks inefficiency in the campaigns that should already be performing well.
Upper-funnel media almost always looks weaker in isolation, because its value shows up later, or in a different channel entirely, than where the spend occurred. That’s exactly the dynamic the home goods streaming video example illustrates: judged only on direct DTC return, the channel looked like a clear cut; judged on its true contribution to in-store revenue, it was protecting the brand’s largest revenue stream.
Cutting upper-funnel investment too quickly doesn’t just remove an underperforming line item. It tends to make the rest of the media mix more expensive over time, since lower-funnel channels lose the demand that upper-funnel media was quietly creating for them to capture.
ROAS remains one of the most important metrics in paid media, and none of this is an argument for abandoning it. It works best, though, as part of a broader measurement strategy rather than as the final word on performance.
The brands that scale profitably aren’t the ones asking which channel had the best ROAS this month. They’re asking which investments are creating durable business value, where returns are truly starting to saturate, and how media should be weighted once the full picture of revenue, across DTC, retail, in-store, and brand-driven demand, is finally visible in one place. That shift, from reporting on performance to using measurement to actually guide decisions, is what separates a media plan that looks efficient from one that’s actually built to grow the business.
If ROAS is telling you where revenue was credited, but not what created it, start with the bigger question. Which investments are driving incremental growth, where is spend approaching saturation, and what would change if your team could see DTC, retail, in-store, and brand-driven revenue together? Tinuiti’s Bliss Point Marketing Operating System connects those answers across Audience, Creative, Media, and Measurement, giving teams a clearer basis for their next budget decision. See how Bliss Point approaches holistic measurement →

Copywriter, Tinuiti
Jenn Wheatley is a senior content strategist and copywriter who turns complex marketing data into clear, actionable stories. She develops research-backed reports and thought leadership that help brands navigate critical business decisions. Based in Utah, she enjoys cooking, strength training, and traveling with her family.