When it comes to analytics for ecommerce, just churning out a report once in a while isn’t enough — especially if you haven’t homed in on the right metrics just yet.
In ecommerce, all metrics aren’t created equal, and knowing your businesses’ unique KPIs — as well as being intimately familiar with them — can be what keeps your sales booming and your company in the black.
Not knowing those key metrics? Well, that can be a kiss of death in the crowded ecommerce space.
Take grooming tools company The Stray Whisker for example:
Not only did having a good handle on their metrics send their sales and revenues through the roof, but it also helped the company avoid a shady SEO agency.
When they promised a 2.3% conversion rate — Stray Whisker’s higher-ups immediately knew to steer clear. (They already had a 4.6% rate all on their own).
Want to make sure you’re using the right metrics to track and measure your company’s success this year? Let’s dive in.
Ecommerce Analytics Metrics to Have on Your Radar
Remember, the point of analytics is to measure your efforts, so you can tweak them, improve them and better their overall results.
So, at their most basic, your key metrics need to be related to your overall goals as a company — the sales you’re trying to achieve, the audience you’re trying to reach or the successful advertising campaign you’re looking to create.
Some of the top metrics that ecommerce merchants typically use include:
- CPA – This is a big one in ecommerce. The CPA, or Cost Per Acquisition, essentially looks to determine how much it costs to acquire a new customer. Naturally, you want this number low and the potential sales from that customer high.
- CLV – CLV, or Customer Lifetime Value, is the total amount a customer is worth to your brand over their lifetime. Will they equal a one-time sale of $10 or monthly sales of $10 for the next 10 years? When used in tandem with the CPA, it can help you determine where there’s room for improvement in your acquisition, marketing and upselling strategies.
- Return on Ad Spend – What are you getting back for every dollar you spend on advertising? ROAS looks at the total revenue you generate from your advertising and marketing efforts, so you can work to make those more efficient and more effective on the whole.
- Brand & product visibility – This one tracks how visible your brand’s products are on the web. How easily are you discovered? How often are you discovered? This metric can guide your SEO and marketing strategies toward success.
- Reach – This is an important metric if you’re utilizing any Facebook or Instagram advertising (you probably should be). It helps you home in on how many people are viewing your ad, which you can then compare to your impressions, costs, frequency and conversions to gauge overall campaign efficacy.
These are just a few of the more commonly used ecommerce analytics metrics.
At the end of the day, you’ll want to ask yourself three major questions to zero in on the right metrics for your brand:
1) What are your goals?
2) What strategies will you use to achieve those goals?
Ecommerce Analytics Tools
There are loads of tools you can use to track your ecommerce analytics and watch your key metrics over time. Of course, there’s Google Analytics, which allows you to track goals, conversions, traffic and ad efficacy (through Google Adwords).
There are also tools for tracking ecommerce efforts via Facebook, Instagram, Amazon, and more.
1. Facebook
Facebook Audience Insights
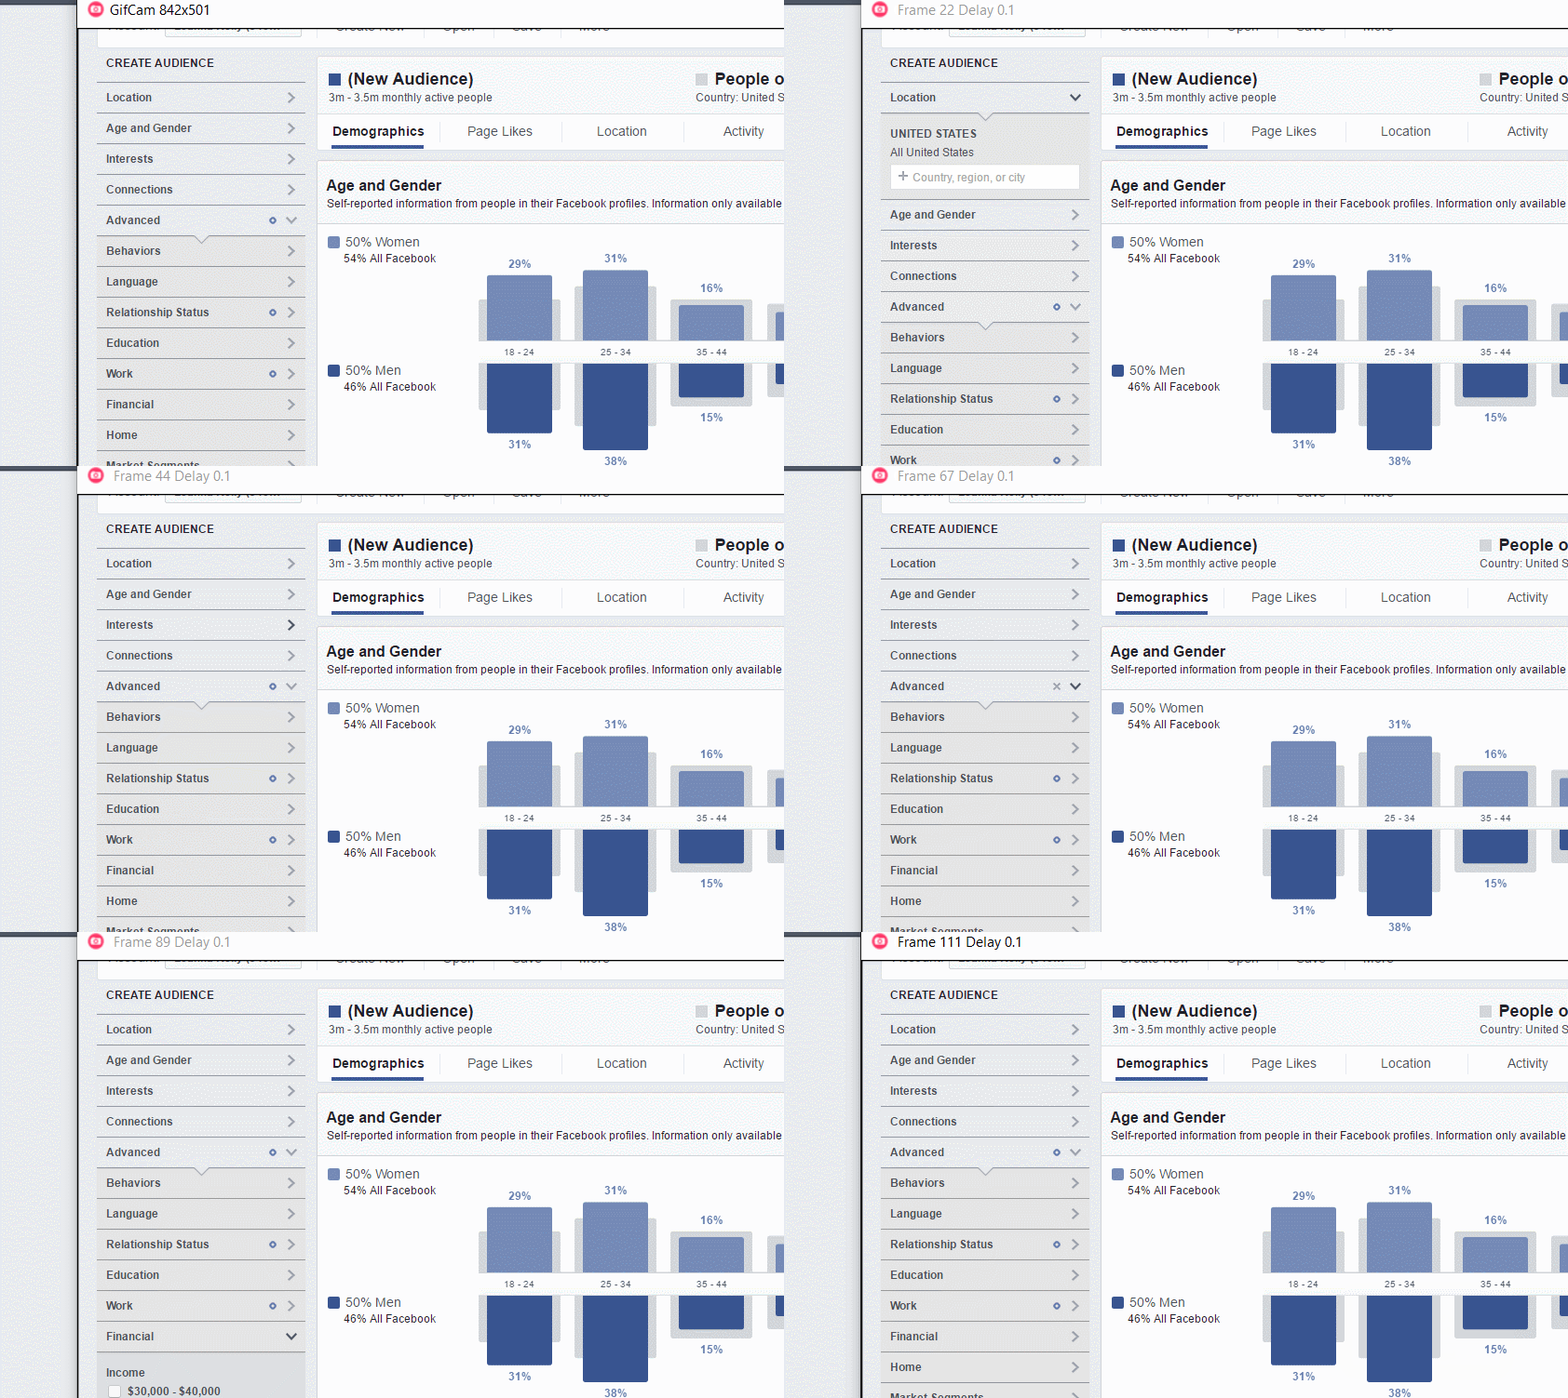
Start at the source: Facebook’s in-app reporting and analytics tool, Facebook Audience Insights. Available to admins of any business page over thirty followers, Audience Insights is designed to help marketers learn more about their target audiences, from geography and demographics to purchase behavior and interests.
This tool identifies and analyzes trends in current and potential customers across Facebook, helping you reach the right users.
Sprout Social
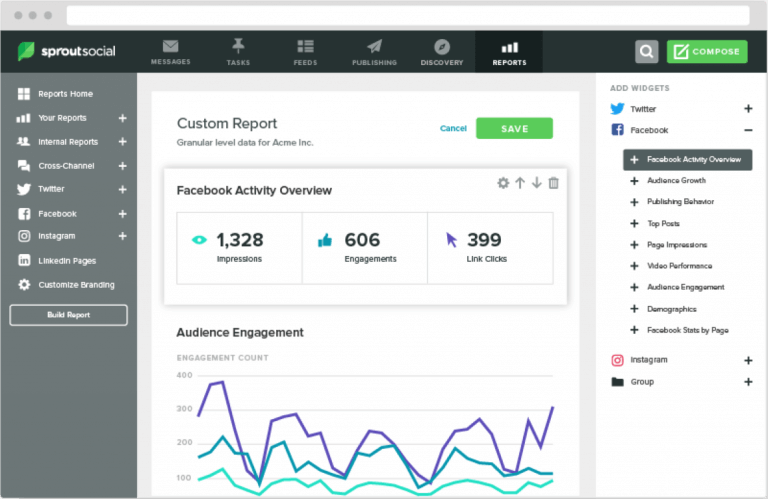
While Sprout offers similar publishing and scheduling functionality to the tools listed above, their reporting and analytics tools set them apart from similar social scheduling platforms.
Sprout offers reports on every aspect of your social media presence, from hashtag analytics to audience profiling. These actionable insights can help you grow your reach on every platform, including Facebook.
Likealyzer

This tool analyzes your Facebook page and gives it a score out of 100 based on the look, feel, setup, and engagement — among other criteria.
You can see how your page ranks against competitors’ pages and access actionable insights and recommendations for improving your page, from content to layout.
2. Instagram
Instagram Insights
These are the built-in insights you get with your Instagram business account. Through Insights, you can see basic stats about your posts, profile views and conversions.
You can also get data on Instagram Stories, including reach, website clicks and more, as well as deep-dive info about your audience, like their location, gender, busiest time of day, etc.
Simply Measured
For being a free tool, Simply Measured is pretty thorough. It offers three reporting areas and super deep-dive stats about engagement.
You can see total engagement, engagement as a share of your total followers, and how that engagement measures up to past posts. You also get a scorecard that ranks your Instagram performance for any given time period.
Iconosquare
![]()
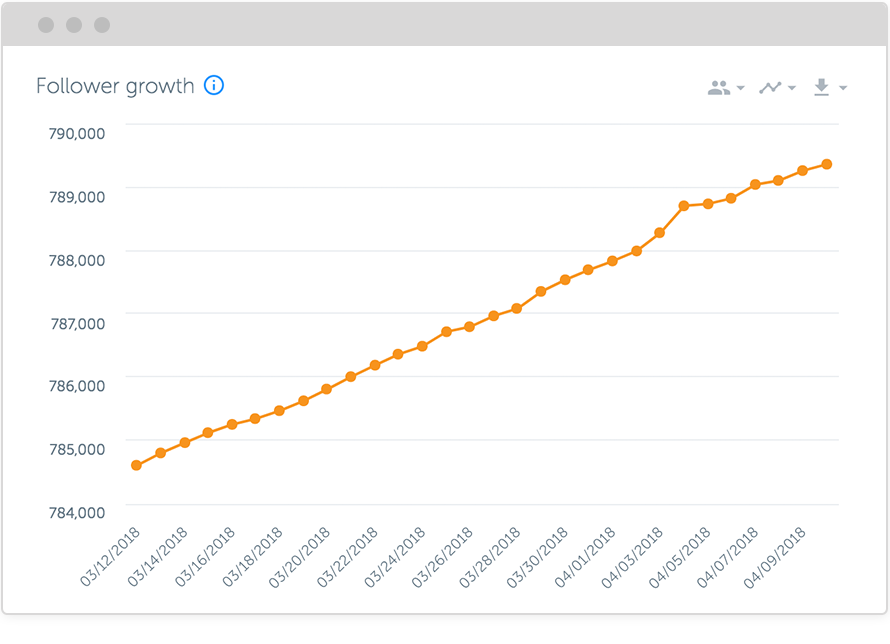
Formerly known as Statigram, this is one of the oldest tools out there. It has follower growth charts, shows you your most-liked photos over time and calculates your average likes and comments.
You can even add in other social media channels to help improve cross-channel engagement.
Regardless be sure to set up benchmarks for each of your major metrics, as this will help you better track your goals and your progress toward achieving them. Make a commitment to checking, analyzing and reporting on your analytics weekly, if at all possible.
Need more help understanding ecommerce analytics or the metrics you should be watching? Email [email protected].
You Might Be Interested In


