Digital Ads Benchmark Report Q2 2024
Quarterly Trends Across Google, Meta, Amazon, And More
Quarterly Trends Across Google, Meta, Amazon, And More
The Tinuiti Digital Ads Benchmark Report is based on anonymized performance data from advertising programs under Tinuiti management, with annual digital ad spend under management totaling over $4 billion. Samples are restricted to those programs that have remained active and maintained a consistent strategy over the time periods studied. Unless otherwise noted, all figures are based on same-client growth. The trends and figures included are not meant to represent the official performance of any advertising platform or the experiences of every advertiser.
Note: The data below is from 2024. Head here to see our most recent report.
Tinuiti is the largest independent performance marketing firm across Streaming TV and the Triopoly of Google, Facebook, and Amazon, with $4 billion in digital media under management and over 1,000 employees.
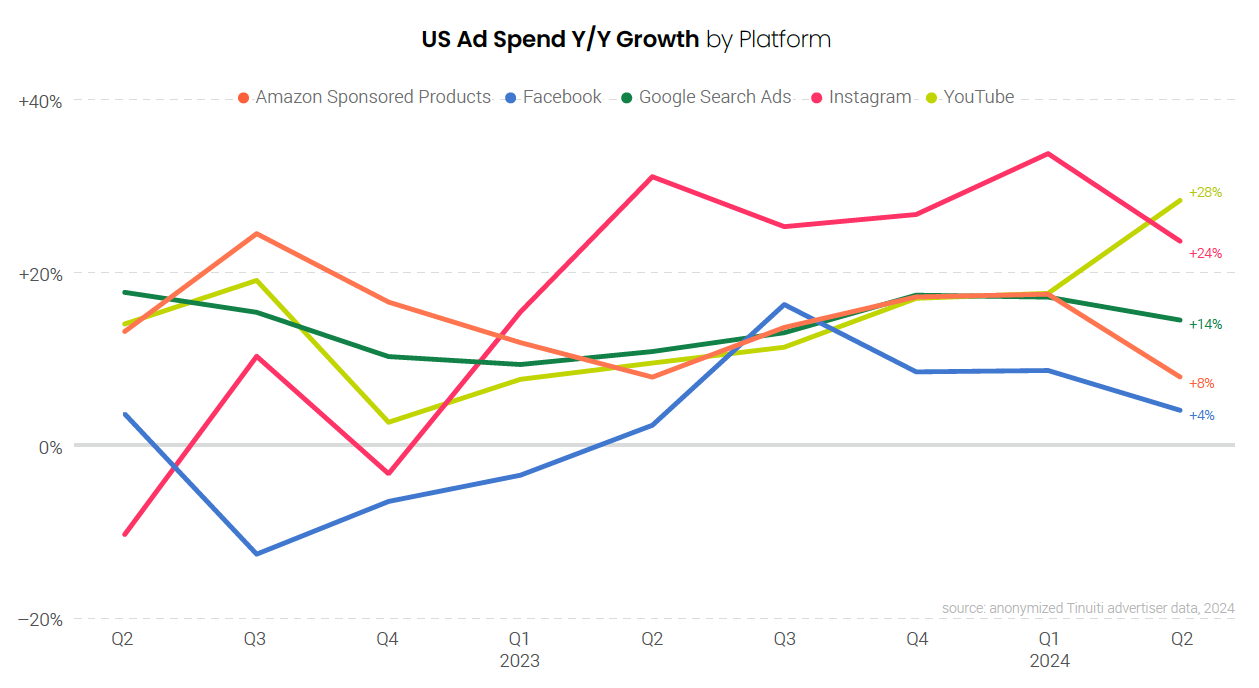
Across Amazon Sponsored Products, Facebook, Google search, Instagram, and YouTube, only YouTube saw an acceleration in spending growth from Q1 to Q2, as a surge in impression volume bolstered investment in the platform. Instagram saw the strongest spending growth across major platforms in Q1, but it slipped to second place behind YouTube in Q2, as spend growth cooled to a rate of 24% Y/Y. Meta’s largest ad platform, Facebook, also saw slower spending growth of 4% in Q2, down from 9% in Q1.
While Facebook continues to see a growing contribution from Reels video and Reels overlay ads, growth in the share of Instagram impressions produced by Reels video ads has slowed considerably and Meta has yet to ramp up Reels overlay ads outside of Facebook. Across both Facebook and Instagram, AI-powered Advantage+ campaigns remained a large contributor to retailer spending, but spend share for the format has dipped a bit since the Q4 holiday shopping season.
Google search advertisers increased their budgets 14% Y/Y in Q2, down from 17% in Q1. For Google shopping ads, including both Performance Max and standard Shopping campaigns, advertiser spending was up 16% Y/Y in Q2. Amazon has been aggressive in Google shopping auctions this year, while Temu’s presence in the shopping listings recovered over the course of Q2 after dropping sharply at the end of the first quarter. On the text side of Google search ads, click growth remained weak in Q2 and advertisers saw a drop in click-through rate in May as Google rolled out AI Overviews to all US users.
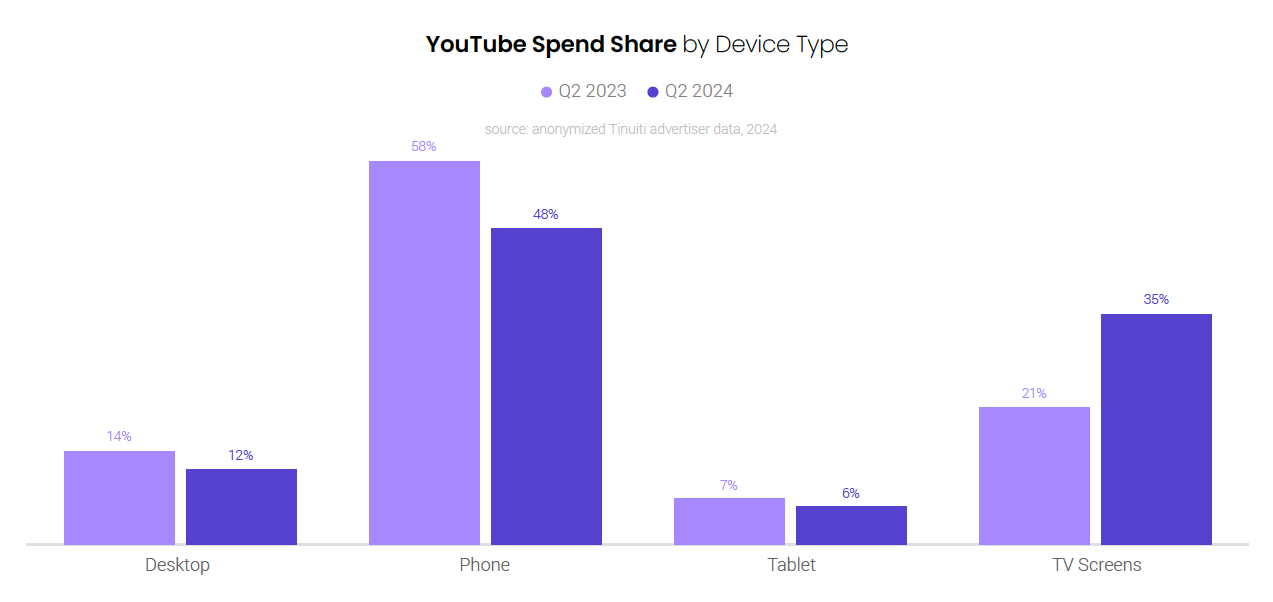
YouTube spending was up 28% Y/Y in Q2 2024, compared to 18% in Q1, as impressions grew 74% Y/Y. While Google is ramping up the monetization of its mobile-friendly YouTube Shorts product, all device types saw a significant lift in impressions in the quarter, while TVs saw a much larger lift in spending than other devices. YouTube ad spending on TVs was up 115% Y/Y, with TV share of spending rising to 35%.
Amazon Sponsored Products spending growth, which had trended very closely with Google search spending growth for the previous few quarters, saw a larger deceleration in Q2, coming in at 8% Y/Y. Growth in the sales advertisers generated with Sponsored Product ads fared better, increasing to 11% Y/Y for the quarter, as advertisers enjoyed a stronger ROI.
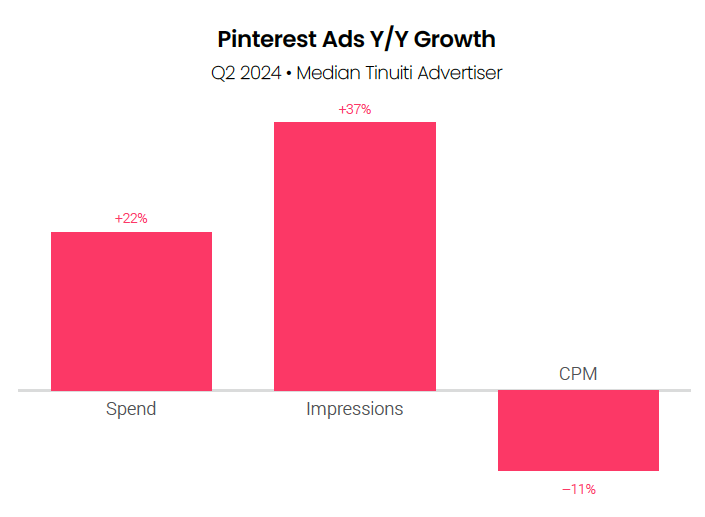
Among rising ad platforms, Walmart Sponsored Products continued to see impressive spending growth, with advertisers increasing their investment by 45% Y/Y in Q2. This was fifth straight quarter that Walmart Sponsored Products spending grew by over 30%. Elsewhere, TikTok spending was up 10% Y/Y in Q2 2024, Snapchat saw 26% growth, while Pinterest spending was up 22%.
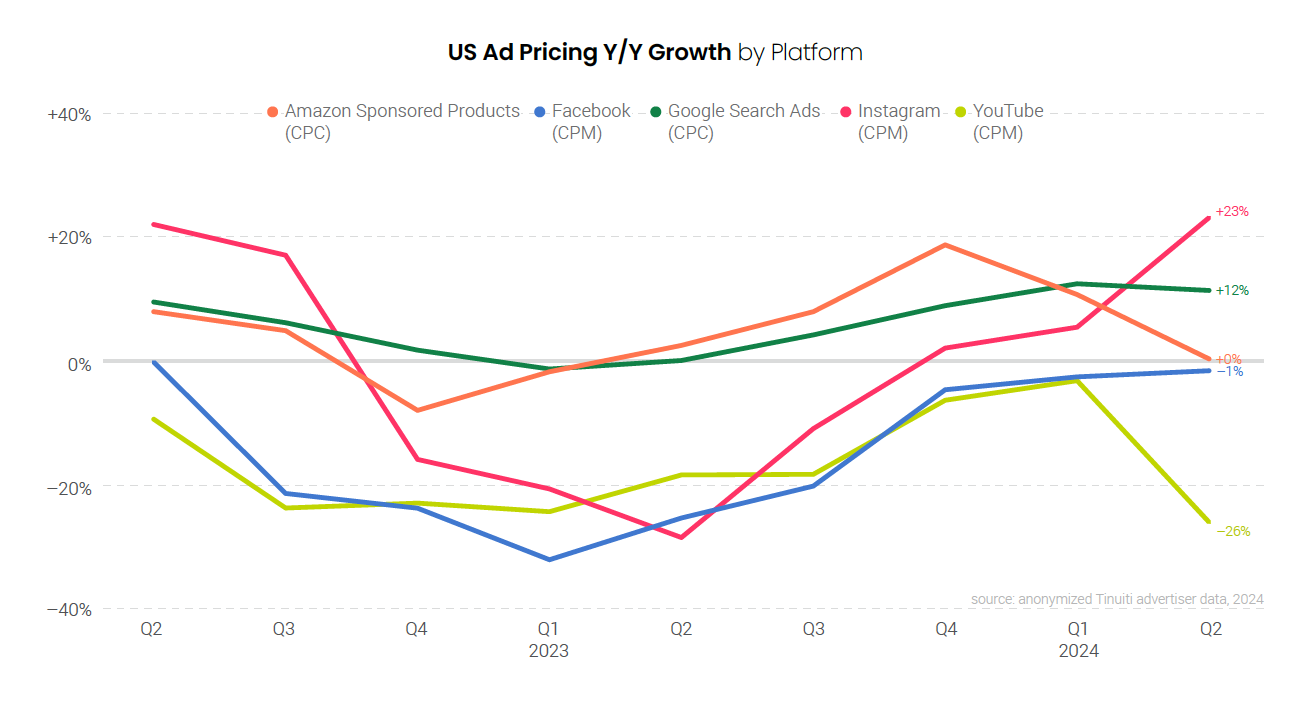
Ad pricing trends were mixed across the five major digital ad platforms covered in this report, with Facebook and Instagram seeing stronger pricing growth, while Amazon Sponsored Products, Google Search, and YouTube saw weaker pricing growth in Q2 than in Q1.
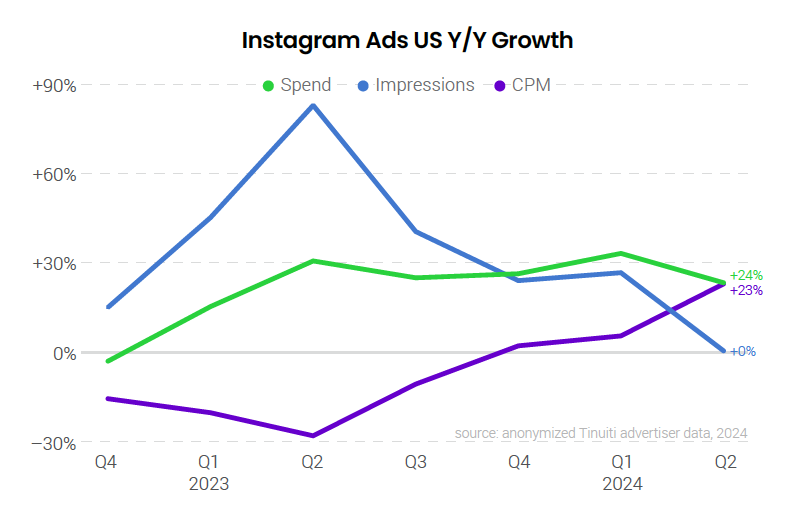
Instagram saw a particularly large acceleration in CPM growth between Q1 and Q2 2024, with CPM coming in 23% higher Y/Y in Q2. That was the largest quarterly CPM increase for Instagram since Q1 of 2022. In between, Instagram saw a large decline in CPM in Q2 2023, a time when pricing was generally recovering for other platforms. Ultimately, the year-ago pricing comp for Instagram was especially weak this quarter.
Moving in the other direction, YouTube saw a sharp drop decline in CPM growth between Q1 and Q2 2024, with CPM running 26% down Y/Y in Q2, compared to a 3% drop in Q1. As noted, YouTube impression growth accelerated significantly in Q2, and although this growth occurred across devices, other elements of the mix of impressions driving this growth may be pushing CPMs down overall.
Pricing was steadier on the two largest platforms with Google search ads seeing CPC growth decelerate by a point and Facebook ads seeing CPM growth accelerate by a point.
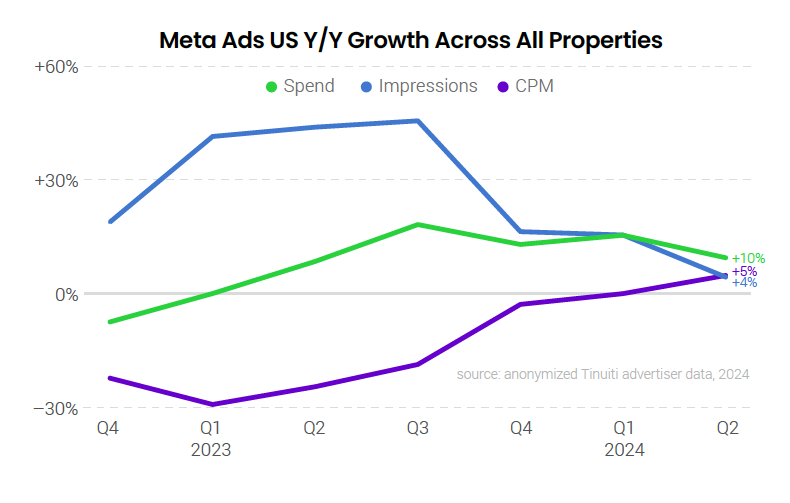
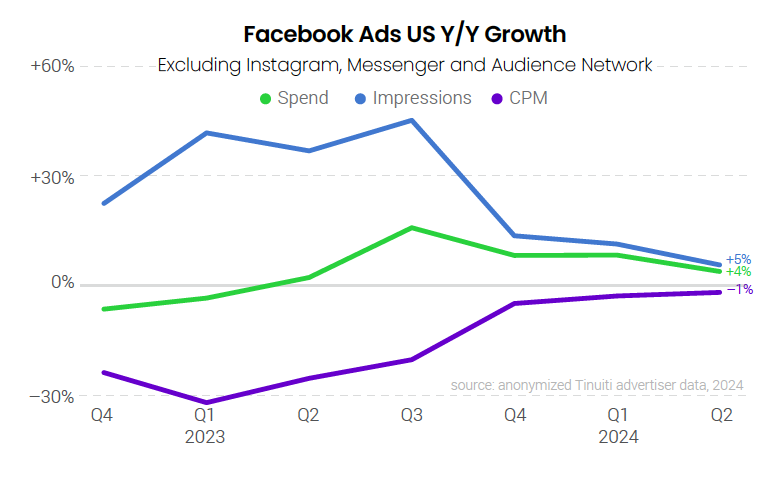
Investment in Meta properties rose 10% year over year in the second quarter, a deceleration from 16% growth in Q1 as advertisers ran up against a much stiffer year-ago comparison in Q2 given that spend growth soared from 0% in Q1 2023 up to 9% in Q2 2023. The cost of ad impressions rose 5% year over year in Q2 2024 , the biggest jump of any quarter since Q2 2022, while impressions rose 4%, the slowest growth over the same period.
Facebook CPM slipped just 1% year over year in Q2 2024, continuing a streak of five straight quarters in which year-over-year CPM decline grew smaller from quarter to quarter. At least partly to blame for the decline in CPM over the last several quarters is continued growth in the share of Facebook impressions coming from Reels video and overlay ads, which are much cheaper than Feed placements and thus pull the overall CPM of the platform down.
Advertisers increased investment in Instagram ads 24% year over year in Q2 2024, as CPM soared 23% in the second quarter, the largest quarterly increase since the first quarter of 2022. Impression growth fell from 27% in Q1 2024 to 0% in Q2 as advertisers ran into an incredibly tough year-ago comparison in Q2, with Q2 2023 impression growth of 84% compared to 45% growth in Q1 2023. Growth in the share of Instagram impressions coming from Reels has slowed meaningfully relative to 2022.
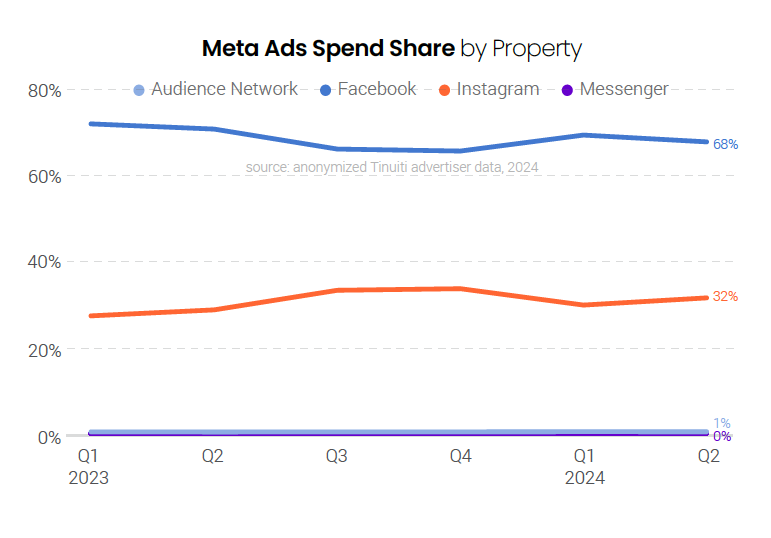
The share of total Meta ad spend attributed to Facebook dipped from last Q2 but still came in at 68% in the second quarter of 2024, as Facebook continues to command a majority of advertiser dollars across all of Meta’s platforms. Instagram spend share rose from 29% last year to 32% this year, as spend growth on the platform far outpaced that of Facebook in Q2. Messenger and Audience Network are only a small share of total Meta spend for most advertisers.
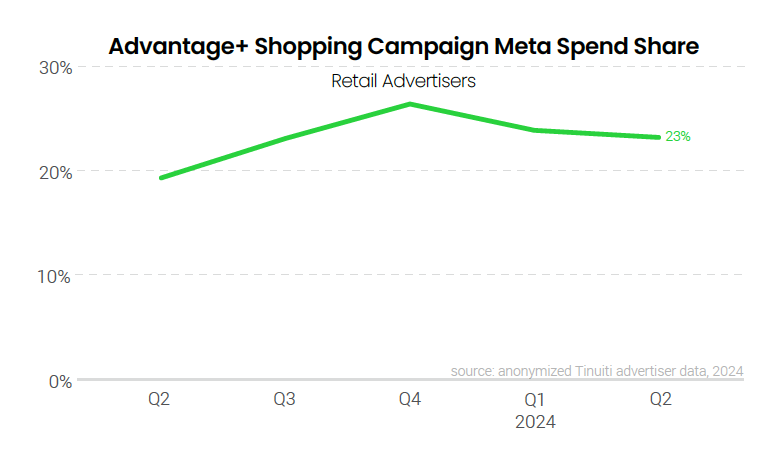
Advantage+ shopping campaigns (ASC) accounted for 23% of all Meta ads spend for retail advertisers in Q2 2024, up from 19% a year prior. ASC share hit a quarterly high of 27% for Tinuiti advertisers in the final quarter of 2023, but has now dipped in each of the first two quarters of the year. Advantage+ shopping automates many aspects of ad creation and creative optimization.
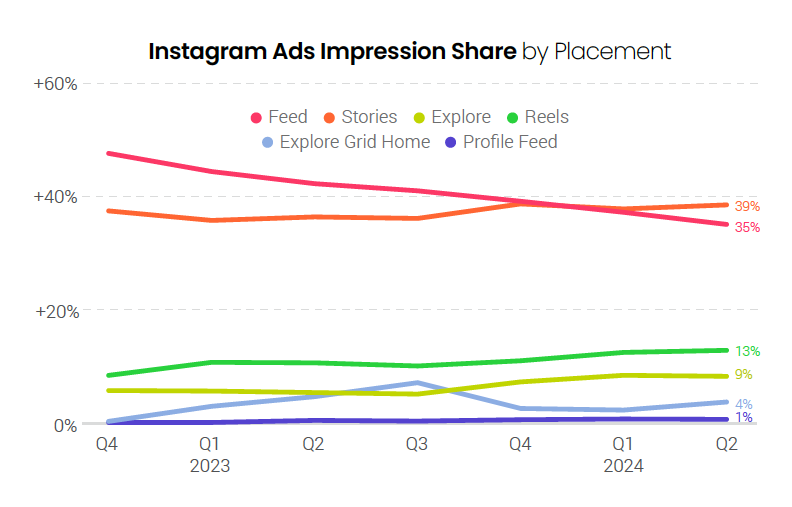
Reels video ads once again accounted for 13% of Instagram ad impressions in the second quarter, the same as Q1, as the growth of the format has slowed since rising rapidly in 2022. Reels overlay ads, which grew to account for 10% of all Facebook ad impressions in Q2, accounted for almost no Instagram ad impressions in the second quarter, as it appears Meta has not yet ramped up the placement of these units outside of Facebook.
Reels overlay ads accounted for 10% of all Facebook ad impressions for the second straight quarter in Q2, as these banner/sticker ads featured on top of Reels videos have become an important part of Facebook Reels monetization over the last couple of years. Reels video ads are also growing in importance, with impression share doubling from 4% in Q2 2023 to 8% in Q2 2024.

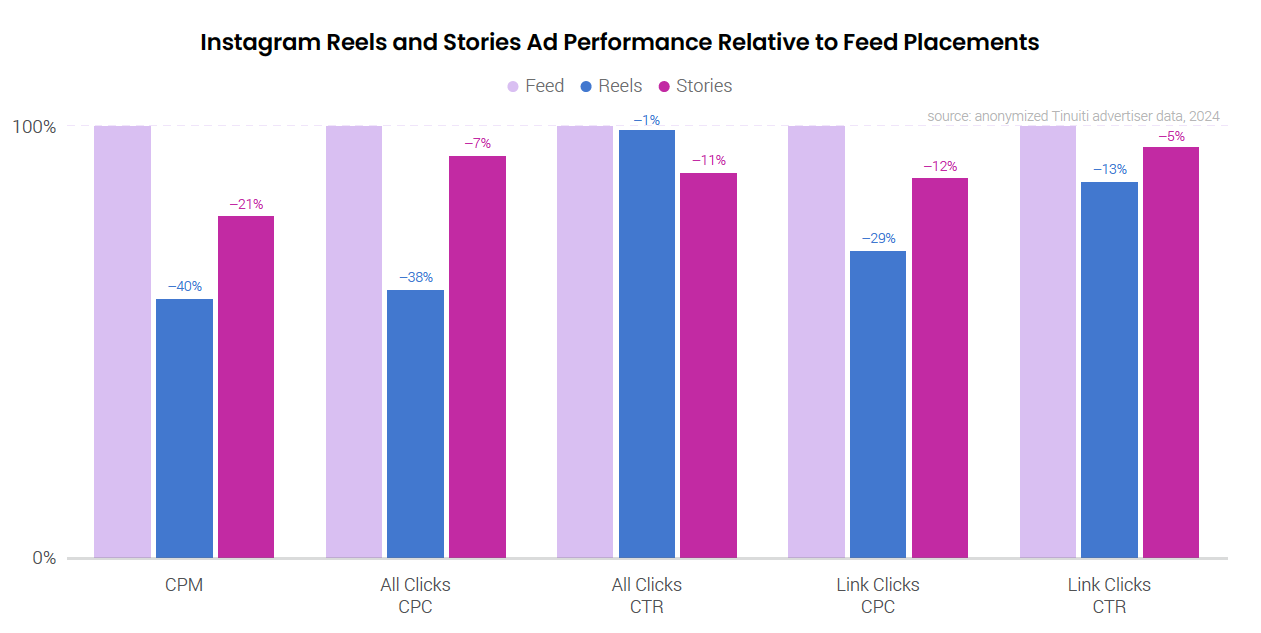
The average cost of Instagram Reels video ad impressions was 40% lower than Feed in Q2, a smaller gap than the 46% difference observed in both Q1 2024 and the final quarter of 2023. Interestingly, the ‘all clicks’ CTR of Reels ads drew nearly on par with Feed ads in the second quarter, compared to coming in at 15% lower in the first quarter. Stories CTR remained more than 10% below that of Feed.
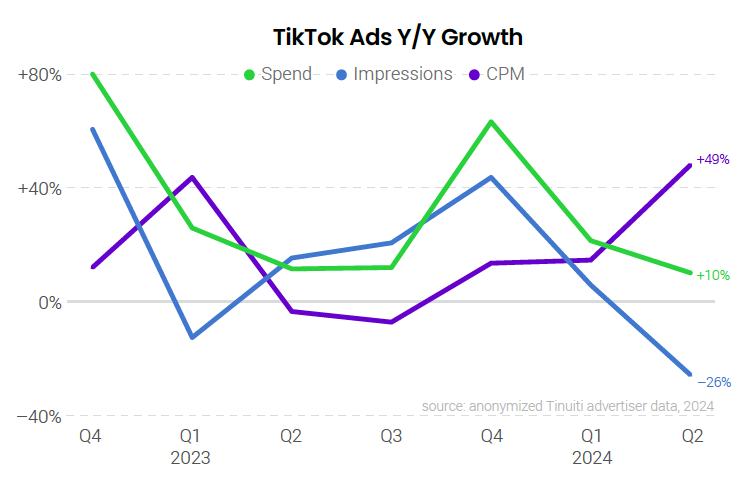
The median Tinuiti advertiser active on TikTok since at least Q2 2023 increased investment in the platform by 10% year over year, with a 49% increase in CPM and 26% decline in impressions. While the potential for a ban in the United States continues to loom, that possibility is not currently forcing advertisers to shift ad dollars away from TikTok. Tinuiti survey data indicates the biggest beneficiaries of a ban would be platforms that have already invested in short-form vertical video, namely Facebook, Instagram, and YouTube.
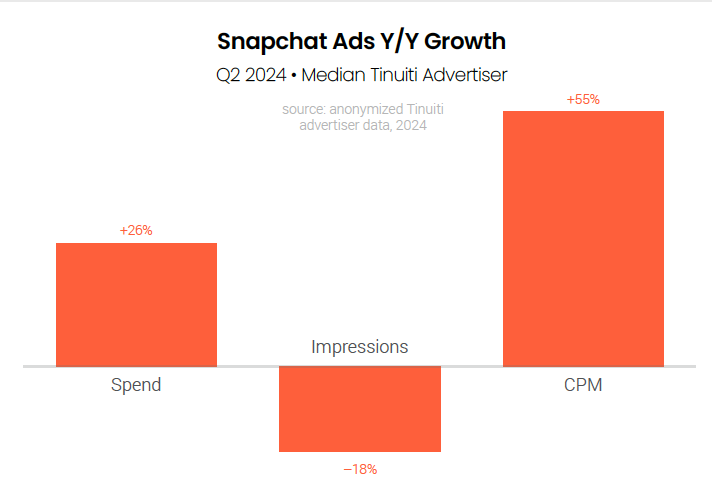
The average cost of impressions on Snapchat rose 55% year over year in the second quarter for the median Tinuiti advertiser, and spend rose 26% despite an 18% decline in impressions. Key 2024 updates for Snapchat advertisers include a Q1 update to the Conversions API to enable new identifiers and parameters, as well as a Snap to Store feature to allow advertisers to measure how many Snapchat users go to a desired physical location after viewing a campaign.
Pinterest ad spend leaped 22% year over year in Q2 2024 for the median Tinuiti advertiser, with a 37% increase in impressions and 11% decline in the average cost of impressions. Pinterest is rolling out several generative AI-powered tools, including Performance+ campaigns that offer advertisers similar automation capabilities as Meta Advantage+ campaigns, which have grown in importance for Meta advertisers over the last year. Performance+ is currently in closed beta.
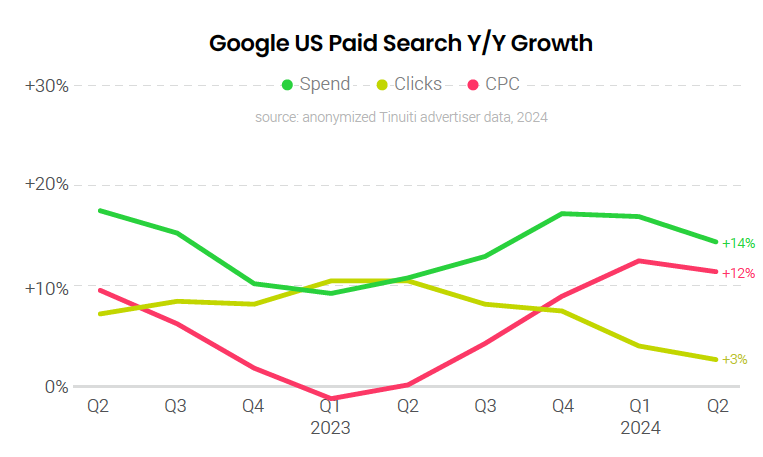
Advertiser spending on Google search ads grew 14% Y/Y in Q2 2024, down from 17% growth a quarter earlier. Click growth for Google’s search ads decelerated for the fifth quarter in a row, coming in at a 3% lift in Q2. On the pricing side, brands saw some relief with CPC growth slowing a bit to 12% Y/Y following four quarters of accelerating CPC growth rates.
Google’s shopping ads, including both Performance Max and standard Shopping campaigns, continued to deliver relatively strong growth in investment from dvertisers with spending up 16% Y/Y in Q2. While that was down from 21% growth a quarter earlier, Google shopping spending growth has outpaced that of Google text ads for the last three years. For the last two quarters, shopping spending growth has been driven primarily by higher CPCs.

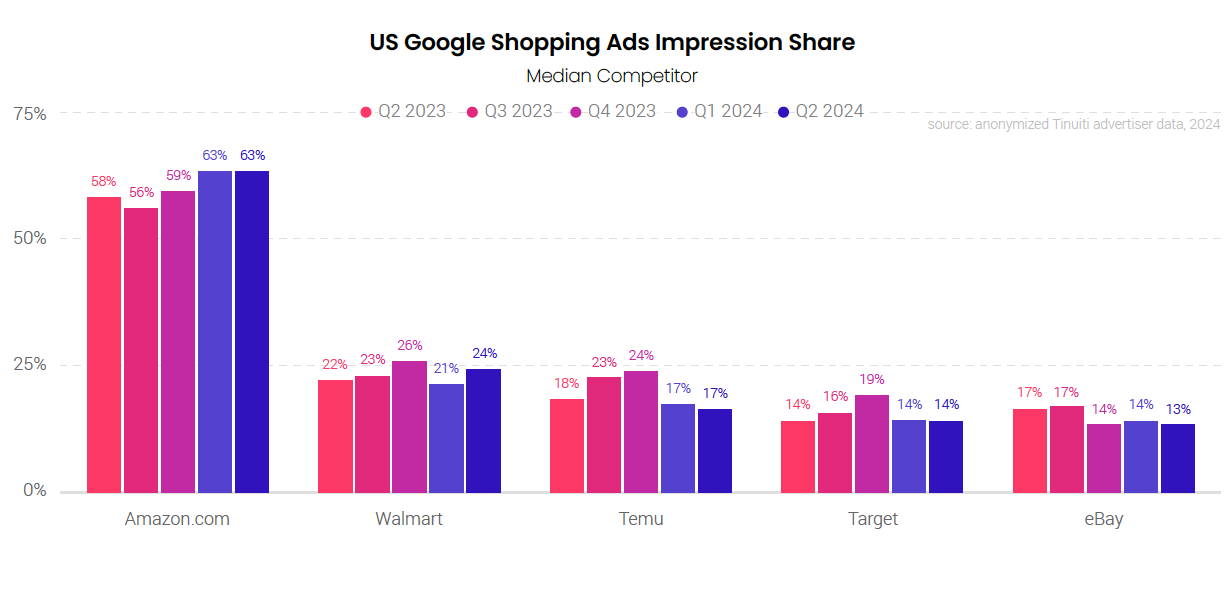
Amazon’s share of Google shopping ad impressions held steady from Q1 to Q2 at about the highest level its competitors have seen outside of the holiday shopping season. Amazon’s aggressive stance in 2024 follows a 2023 that saw Temu make a big play to gain share in the US market, including by becoming one of the largest buyers of Google shopping ads. At the same, Amazon appears to be running less aggressively in Google’s text ad auctions this year, so the ecommerce giant may also be reallocating spend from one format to the other.
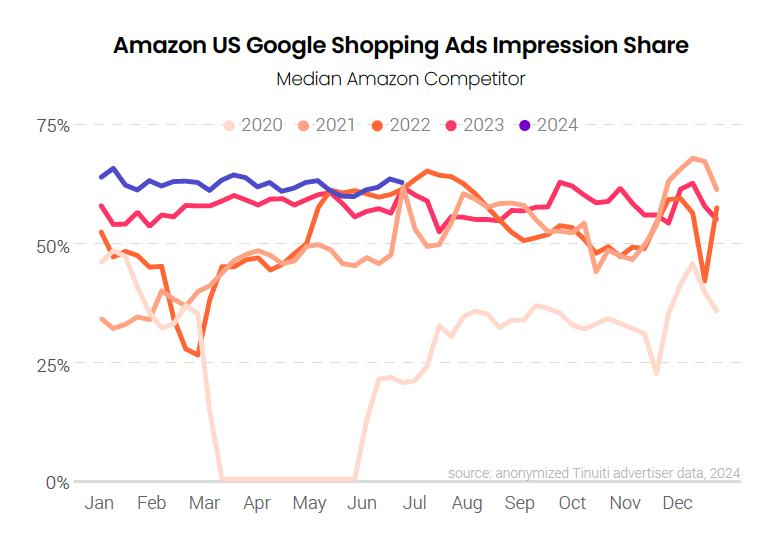
Temu’s share of Google shopping ad impressions fell sharply over the final weeks of Q1 2024, but it has been back on the rise since early in the second quarter of 2024. Temu’s presence in Google shopping auctions is still running below 2023 levels, however, as Temu ramped up its spending on Google ads significantly from Q1 to Q2 2023. In May of this year, the Wall Street Journal reported that Temu was shifting business priorities beyond the US” in part due to the government scrutiny that TikTok has received.

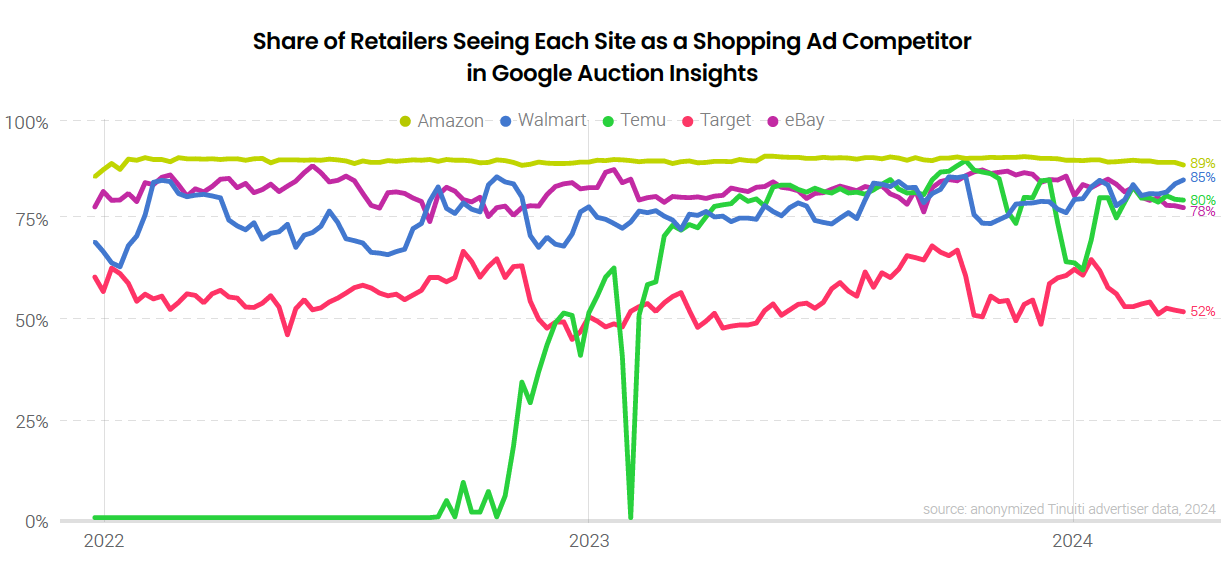
In the last week of 2023, just over 90% of retailers saw Amazon and Temu as top competitors for Google shopping impressions, according to data from Google’s Auction Insights reports. While Amazon’s presence has stayed at that level in the weeks since, the share of retailers seeing Temu as a shopping competitor fell to 63% to start Q2 2024. To close out the quarter that rate had recovered to a little over 80%. Temu’s presence fell the most against beauty and automotive brands, while apparel, art, and custom product retailers were less impacted.
As much money as Temu has invested in Google and other digital ads, it’s important to note that the share of Google shopping impressions Temu has received has paled in comparison to the share that Amazon has received over the last year. With Temu now dialing back a bit, that gap has only widened. In Q2 2024, Amazon’s share of impressions against the median retailer was nearly four times that of Temu.
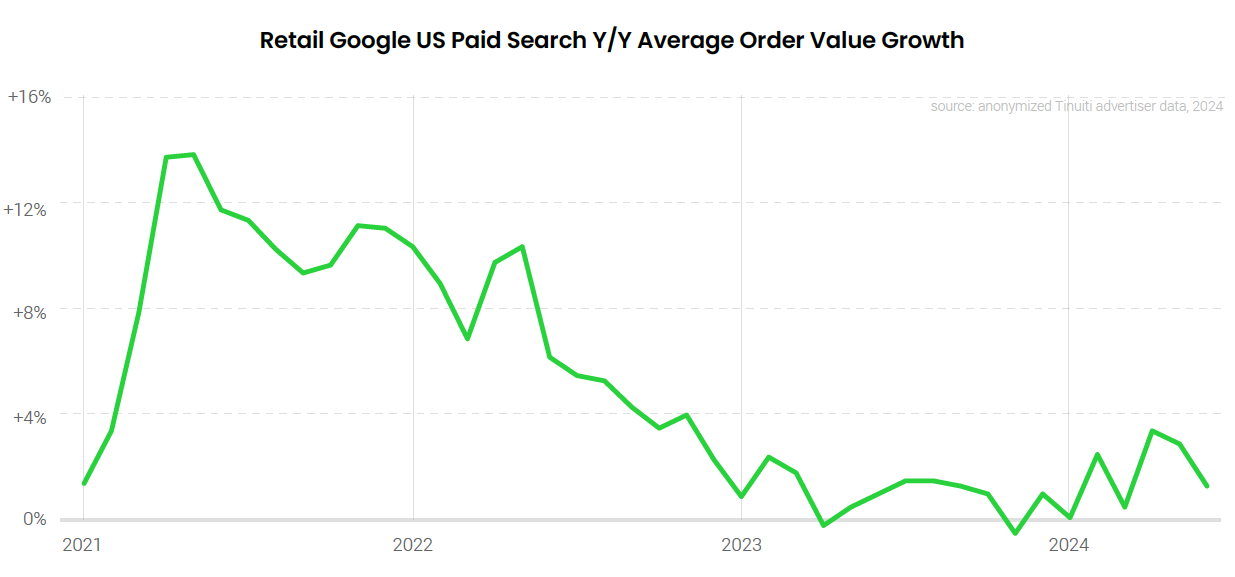
In April and May, the average value of an order retailers generated through Google search ads grew by over 3% Y/Y for the first time since late 2022. Average order value growth decelerated to a little over 1% Y/Y in June, however. AOV growth had peaked at nearly 14% Y/Y in Q2 2021, before bottoming out at a 1% decline in November 2023. In the months since, AOV growth has generally been trending higher.
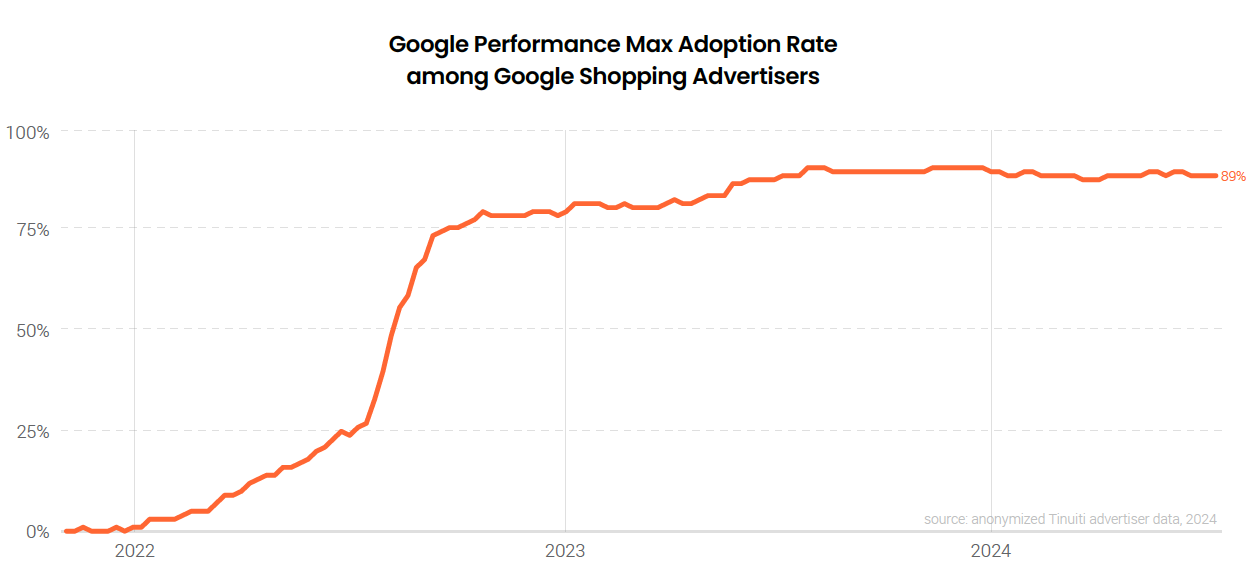
Retailer adoption of Google Performance Max campaigns was strong in Q2 2024 with 89% of retail brands that run Google shopping listings using PMax as part of the mix. Performance Max adoption rates dipped very slightly in early March of 2024, but were nearly as high as ever in Q2. Most brands currently running PMax ads originally adopted the format over Q3 2022, when Google began migrating Smart Shopping ads to the new model.
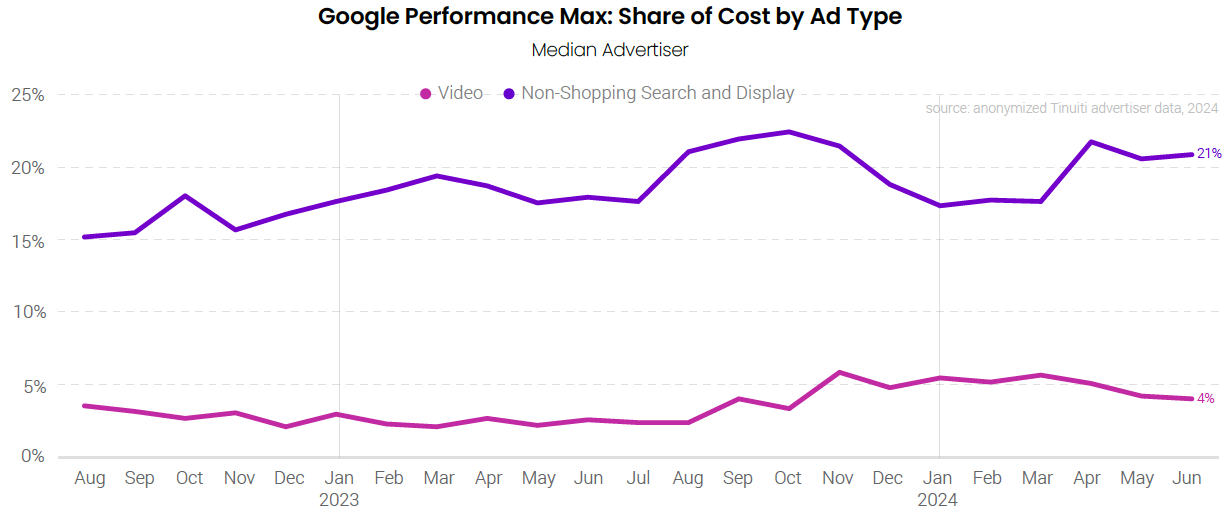
At 21%, the contribution of non-shopping search and display inventory to retailer spending on PMax campaigns was about three points higher in Q2 2024 than in Q1. While that is a fairly large increase, it followed a similar sized drop between Q4 2023 and Q1 2024. Over the longer term, Google has been fairly judicious in its expansion of non-shopping PMax inventory. That has been true of video inventory, specifically, as well, with video accounting for just 4% of PMax spending in Q2 2024.
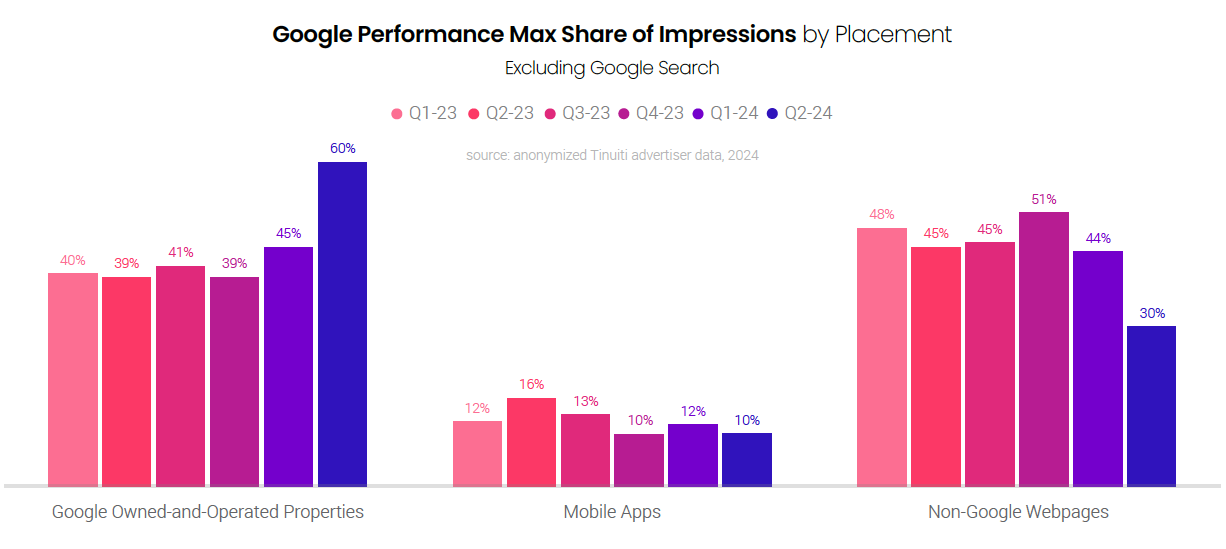
For Performance Max impressions occurring outside of Google search, other Google owned-and-operated (O&O) properties accounted for 60% of total placement impressions in Q2 2024. This was up significantly from an impression share of 45% in Q1. The bulk of the share gains for Google O&O properties came from non-Google webpages, which saw their impression share fall from 44% in Q1 2024 to 30% in Q2. Mobile apps accounted for the remaining 10% of PMax placement impressions in Q2.
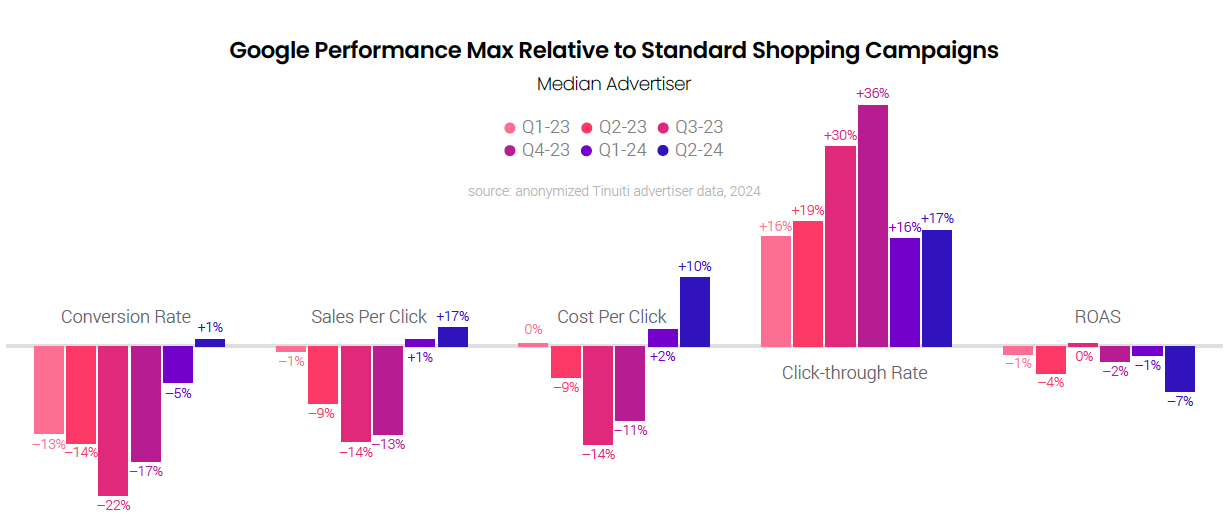
For the first time, the typical brand running PMax campaigns saw them generate a higher conversion rate than standard Google Shopping campaigns in Q2 2024. Conversion rates for PMax were 22% lower than those for standard Shopping campaigns (SSCs) just three quarters earlier. At the same time, however, CPCs for PMax campaigns have also risen relative to their SSC counterparts and ran 10% higher in Q2. All told, ROAS for PMax was 7% lower than that for SSCs in Q2, down from running roughly equal in Q3 2023.
Spending on Google search text ads was up 13% Y/Y in Q2 2024, which was driven almost entirely by CPC growth. Text ad click growth was just 0.3%, marking the fourth straight quarter of less than 3% click growth for the format. The full extent to which Gen AI platforms like ChatGPT and Perplexity, as well as Google’s own AI overviews are impacting text ad trends is difficult to say, but Tinuiti data does show mixed click-through rate trends for different text ad segments in recent months.

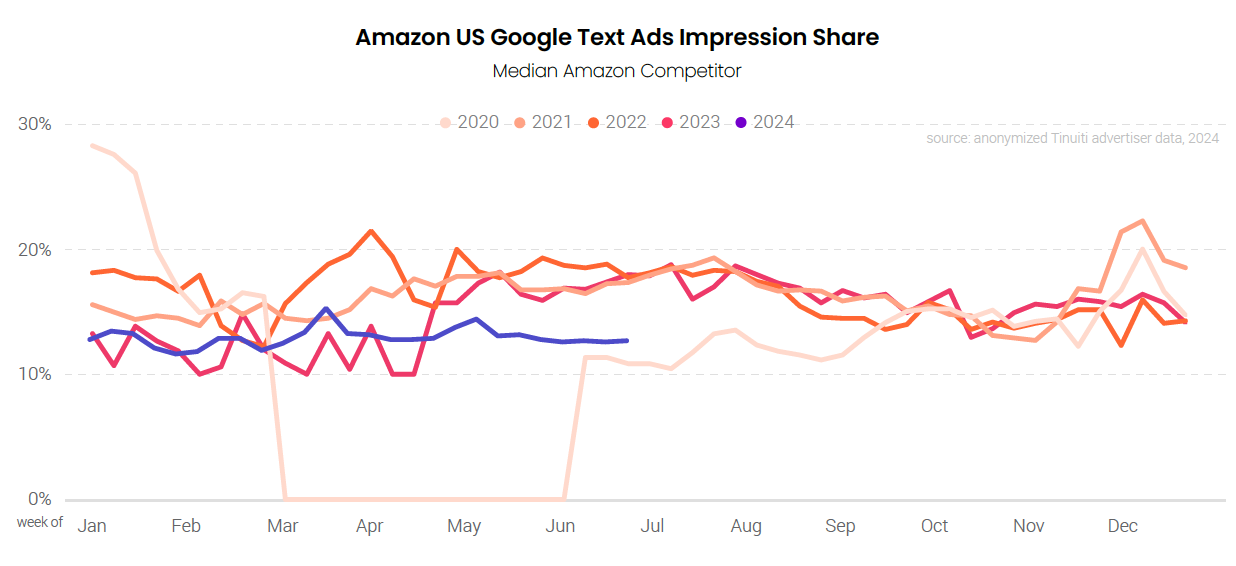
Amazon’s presence in Google search text ad auctions has been appreciable reduced from a year earlier as its impression share against the median retailer fell from 16% in Q2 2023 to 13% in Q2 2024. While Amazon ramped up its text ad presence over Q2 2023, it was flat to down over the course of Q2 2024. Even with Amazon appearing to dial back its text ad spending, its competitors are still seeing weak text ad click growth.
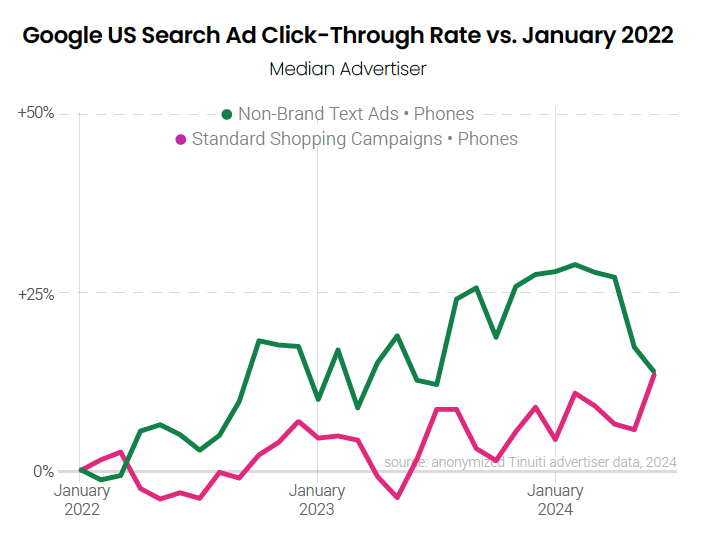
In assessing the impact that Google’s AI Overviews (AIOs) are having on their search ad campaigns, advertisers might expect non-brand text ads on phones to be more negatively affected than, say, brand text ads on computers or shopping ads on phones. Google has reportedly shown AIOs more frequently on phones than computers, and AIOs tend to be triggered by less commercial queries than those that tend to trigger navigational brand keywords or shopping ads.
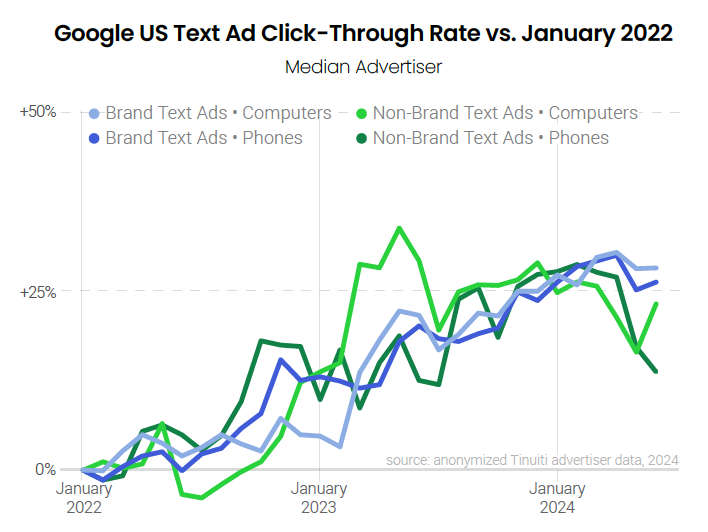
Indeed, as Google rolled out AIOs to all US users in May, non-brand text ads on both computers and phones saw a meaningful drop in click-through rate (CTR) compared to April, and a much larger drop than that seen for brand keywords. With some reports that Google dialed back the frequency of AIOs in June, it is interesting that CTR for other segments recovered, but it did not for non-brand phone text ads.
Importantly, with so many moving pieces to ad serving and inventory, CTR trends can be noisy in the short term, so brands should not rush to judgment on how AIOs are impacting their search ads. The two-month CTR drop for non-brand phone text ads has been large, but it is not the largest drop brands have seen for a text segment in just the last couple years. If it continues, though, the notion that AIOs are significantly hurting ad CTR will be more compelling.
Click-through rate for Google standard Shopping Campaigns (SSC) has fared well through the rollout of Google AI overviews, with phone CTR for SSCs running higher in June 2024 than they have at any point since 2022. Even with the recent drop in non-brand text ad CTRs on phones, the CTR for these ads was 14% higher in June 2024 than at the start of 2022, the same figure observed for SSC.
Maybe most important to the discussion of the impact of AIOs on ad CTRs is that Google has announced and is actively testing bringing ads into the AIOs themselves. As those efforts ramp up, any negative impacts to ad CTRs from AIOs should ease.
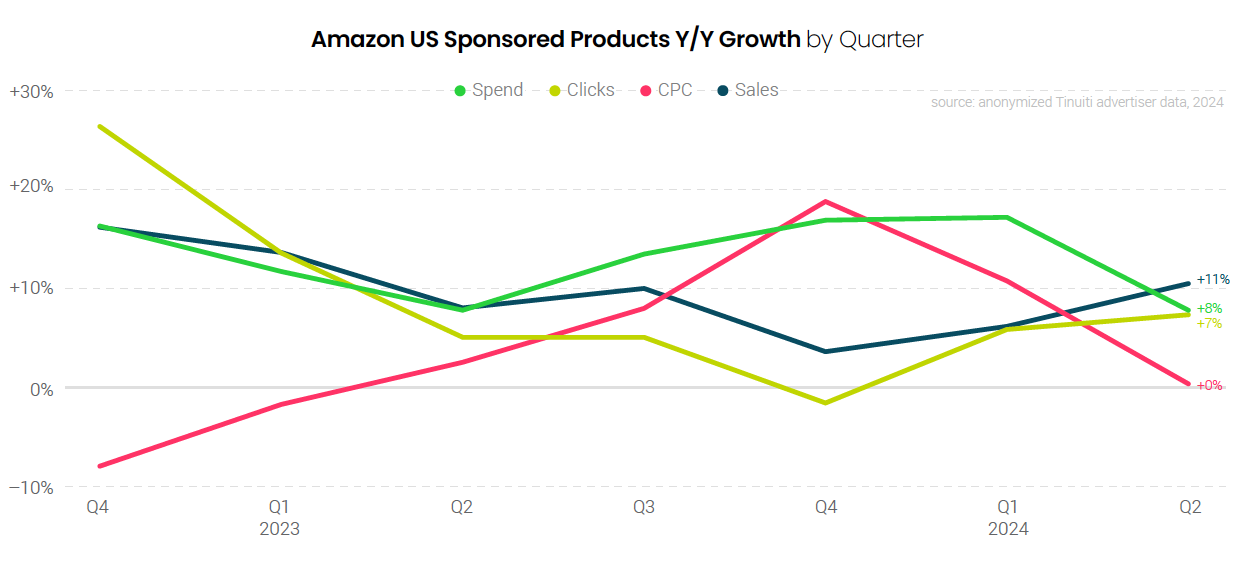
Spend on Amazon’s primary search advertising format increased 8% Y/Y in the second quarter, with clicks on the format up 7%. After two quarters of double-digit growth in CPC year over year, the cost of ad clicks rose just 0.4% in Q2 2024 compared to the same quarter last year. Sales attributed to Sponsored Products rose 11% year over year, as ROI improved slightly compared to Q2 last year.
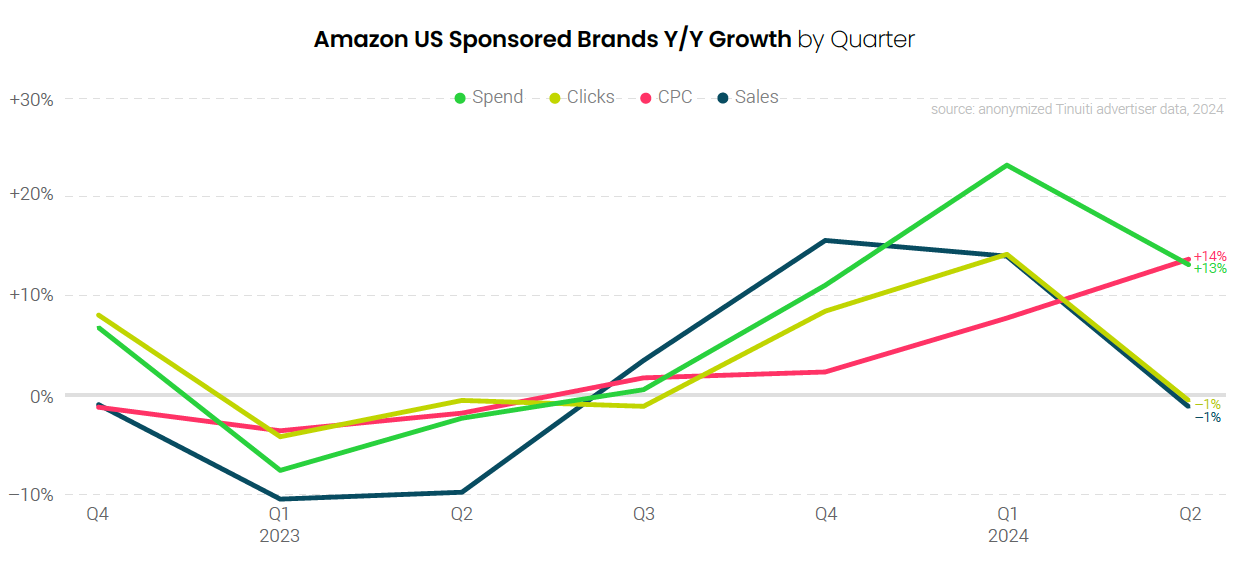
For the second straight quarter, advertiser investment in Sponsored Brands campaigns, including Sponsored Brands video ads, rose faster than Sponsored products. This comes after a stretch of eight straight quarters starting in Q1 2022 that Sponsored Products spend rose faster than Sponsored Brands. CPC rose 14% year over year for Sponsored Brands campaigns in Q2, the fastest growth observed since way back in Q3 2021.
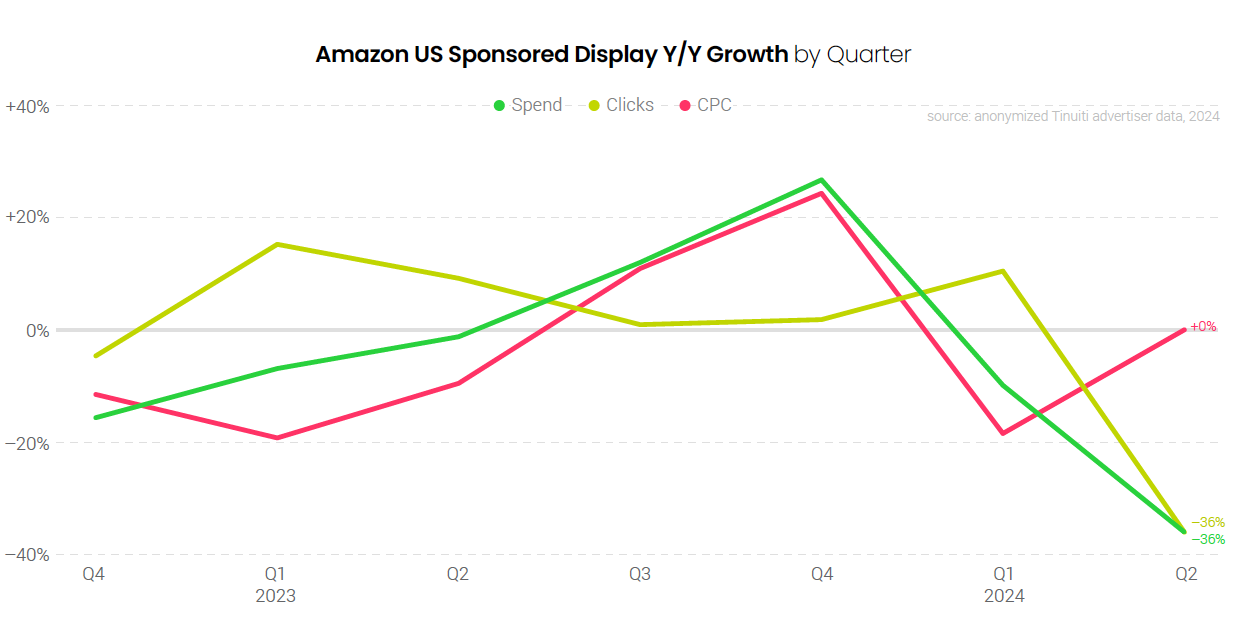
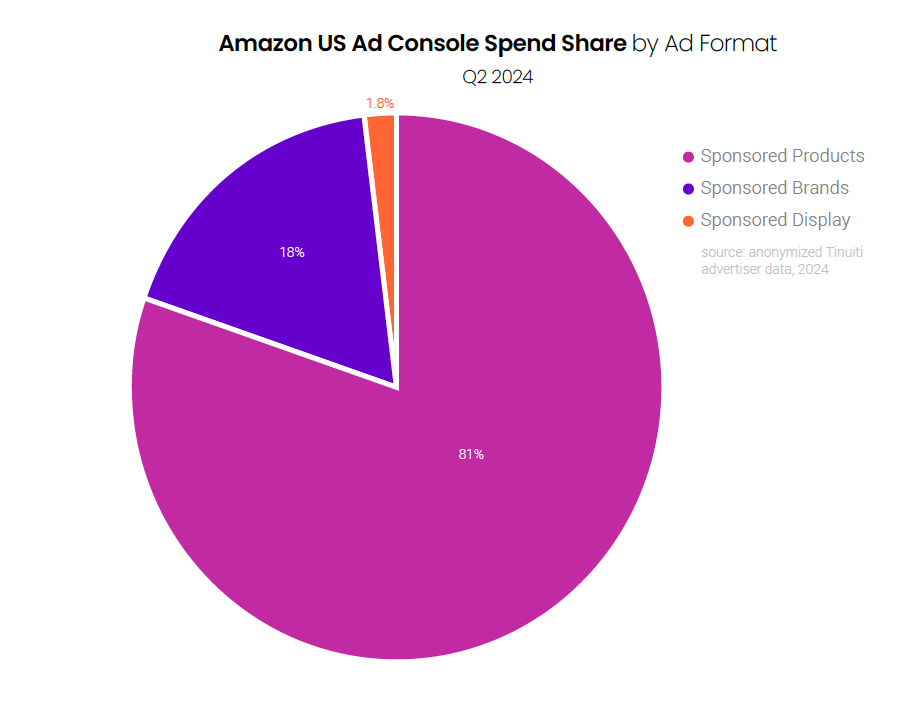
Spend for the Sponsored Display campaign type declined 36% year over year in the second quarter after declining 10% year over year in the first quarter. Clicks fell 36% year over year, while the cost of clicks held roughly the same. Though Sponsored Display campaigns have become less important to Amazon advertisers over the last year, DSP spend growth is accelerating, such that the overall importance of Amazon display inventory is growing for many brands.
Sponsored Display share of total Amazon Ad Console spend slipped to 1.8% in Q2 2024, less than half of what it was during the same quarter last year as investment in Sponsored Display fell significantly year over year. Sponsored Products accounted for 81% of all Ad Console investment, while Sponsored Brands, including Sponsored Brands video ads, were responsible for 18% of spend.
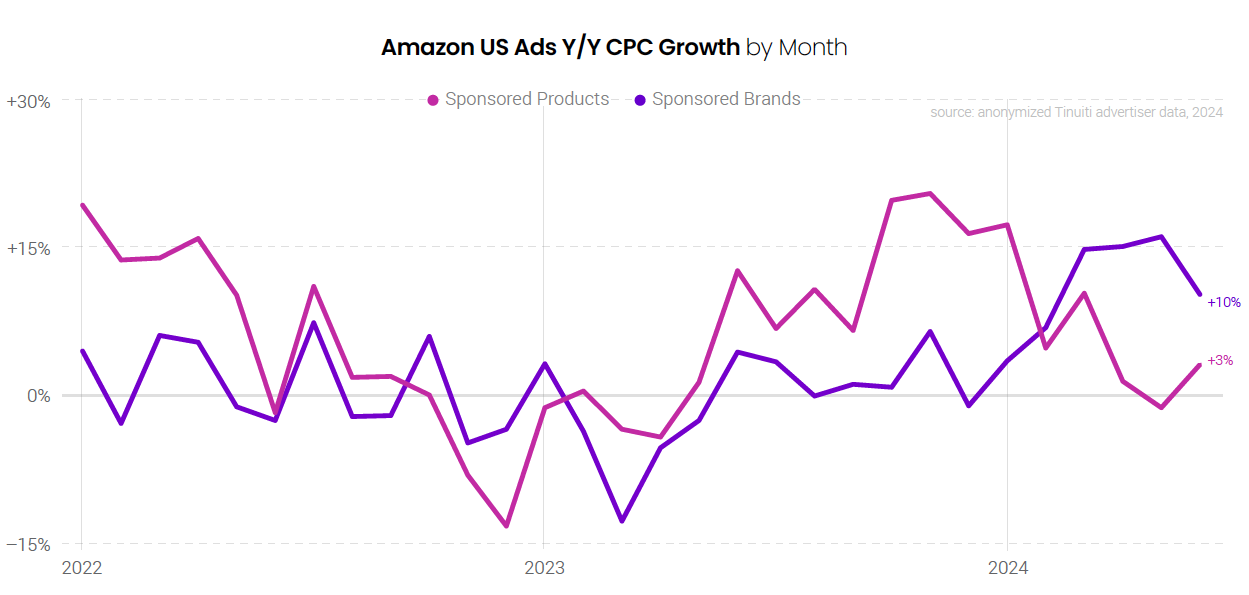
The cost of Sponsored Brands, including Sponsored Brands video ads, clicks rose at least 10% in every month of the second quarter, far outpacing CPC growth for Sponsored Products. While Sponsored Products CPC ramped up sharply in 2023, Sponsored Brands CPC held roughly stable year over year throughout 2023 before climbing throughout the opening months of 2024. Sponsored Products CPC growth has slowed meaningfully since the start of the year.
For the fifth straight quarter, advertisers increased spend on Walmart Sponsored Products ads by at least 30% year over year, as brands continue to lean into search advertising on Walmart. CPC rose 30% in Q2 2024 compared to the same quarter last year, the slowest growth of the last four quarters. Despite the rise in CPC, advertisers are still seeing strong return on investment, with sales attributed to Walmart Sponsored Products up 39% year over year.
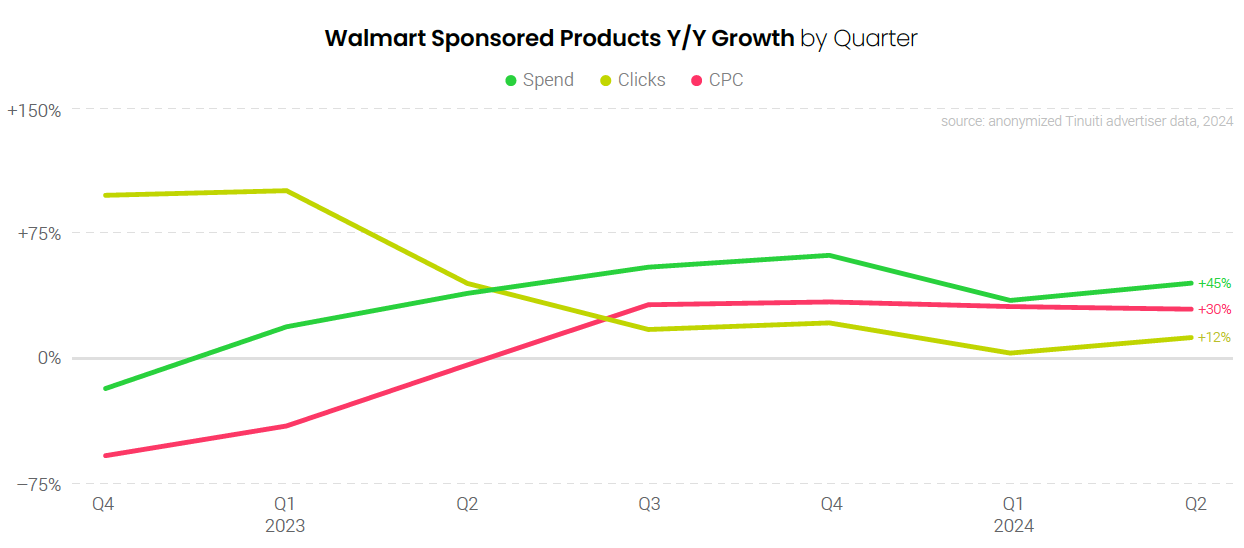
Walmart Sponsored Products CPC growth jumped from a 9% decline in May 2023 to a 41% increase in June, as advertisers began to lap Walmart’s June 2022 move to use a second-price auction instead of a first-price auction. Despite the significantly tougher year-ago comparison, CPC growth actually accelerated from May to June 2024, going from 23% to 32%. Movement in CPC is now more indicative of shifts in the value of ad clicks rather than the impact of Walmart’s 2022 auction change.

The share of total Walmart search ad investment attributed to Sponsored Video campaigns, Walmart’s newest search ad type, hit 2.4% in the second quarter, the highest share observed to date for Tinuiti advertisers. Sponsored Products continue to dominate Walmart search ad spend, though, and accounted for 95% of spend in the second quarter. Sponsored Brands, formerly known as Search Brand Amplifier, were responsible for 3% of Walmart search spend in Q2.

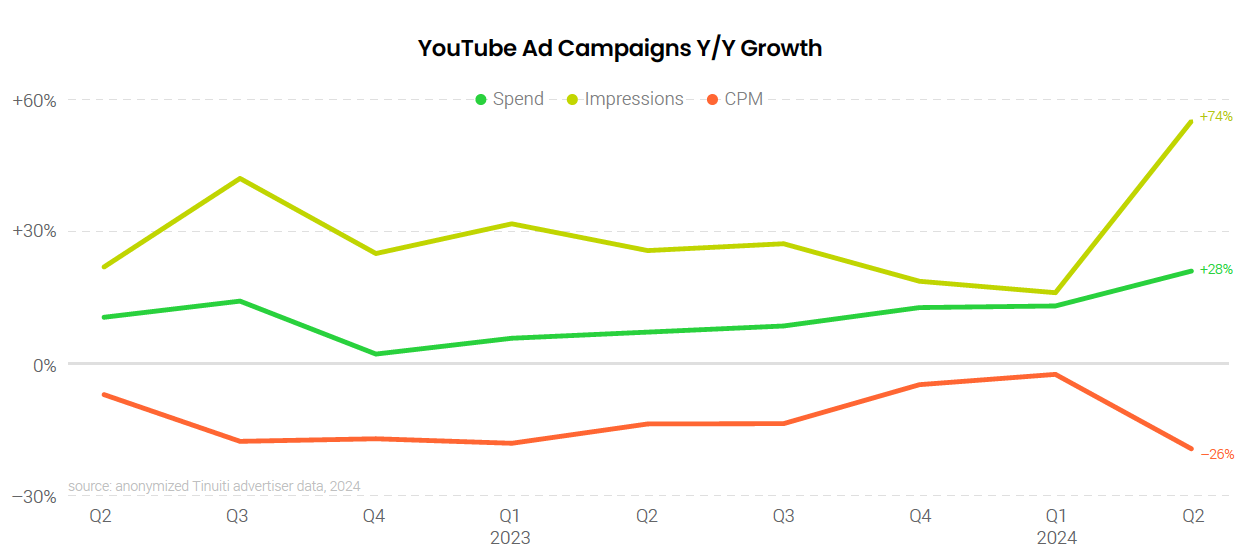
Spending on YouTube video ad campaigns was up 28% Y/Y in Q2 2024, up from 18% a quarter earlier. While most other major digital ad platforms saw a deceleration in spending growth between Q1 and Q2, a surge in impression growth across devices helped bolster YouTube investment in Q2. At the same time, those new impressions were relatively cheap, which pushed average CPM down 26% Y/Y in Q2, down from a 3% decline in Q1.
With spending up 115% Y/Y, connected TV increased its share of YouTube ad spend from 21% in Q2 2023 to 35% in Q2 2024. YouTube spending growth was also positive for desktop, phone, and tablet devices, but all three segments saw spend share declines compared to a year earlier. Phone share of YouTube spending fell the most from year to year, coming in 10 points lower at 48% in Q2 2024, but phones still command the largest share of YouTube ad dollars.
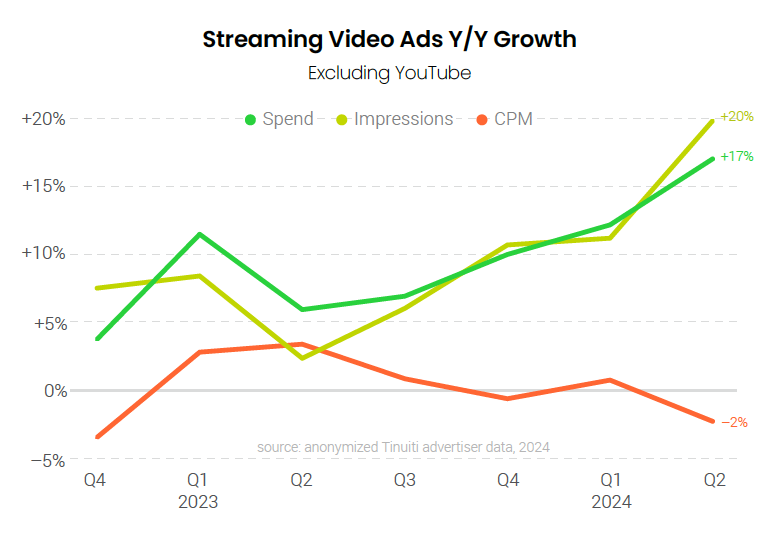
Outside of YouTube, spending on streaming video ads was up 17% Y/Y in Q2 2024, up from 12% in Q1. Streaming spending has benefited from the launch of ads in Amazon Prime Video content toward the end of January 2024. To date, spending on Prime Video has ramped up each month since the initial rollout of ads. Overall, streaming impression growth accelerated from 11% Y/Y in Q1 to 20% Y/Y in Q2, while CPM growth dipped slightly to a 2% decline.
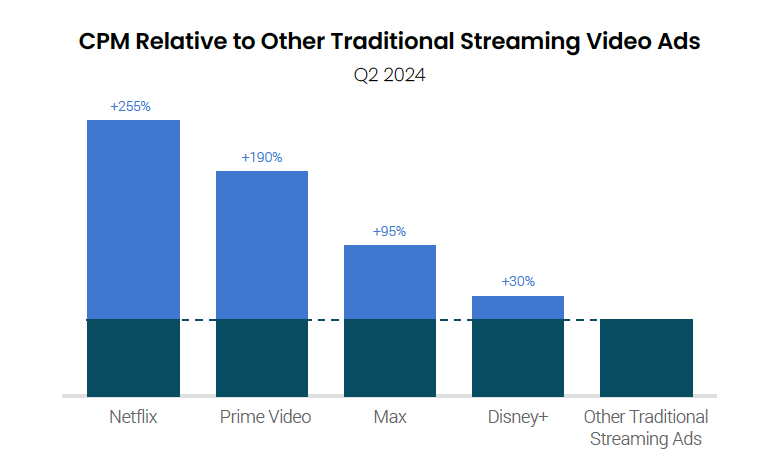
Netflix, Prime Video, Max, and Disney+ all enjoyed a strong CPM compared to other traditional streaming ad buys. Of those four platforms, Netflix saw the highest CPM in Q2 2024, followed by Prime Video, Max, and Disney+. For the typical advertiser, Netflix CPM was a little over 3.5 times that of other traditional streaming platforms, while Disney+ saw a smaller advantage of just 30%.
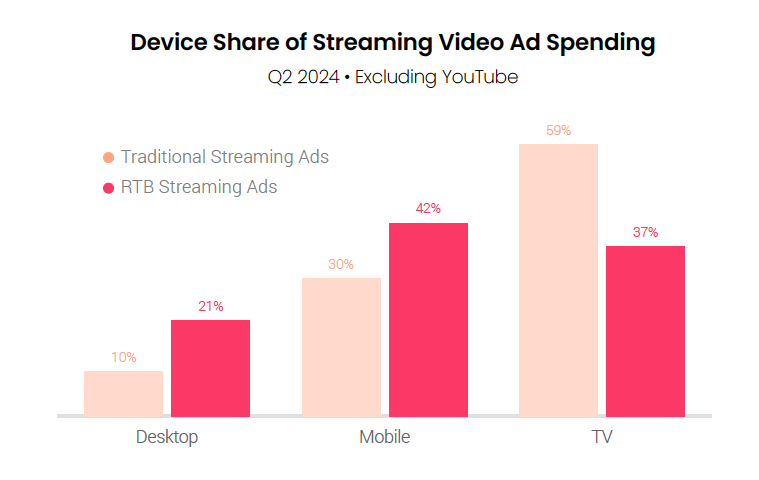
For real-time bidding (RTB) streaming video buys, mobile devices attracted the largest share of spending in Q2 2024 at 42%. This was followed by TVs at 37% and computers at 21%. For traditional streaming ad buys, TVs accounted for 59% of spending in Q2 2024, while mobile devices and computers contributed 30% and 10%, respectively.
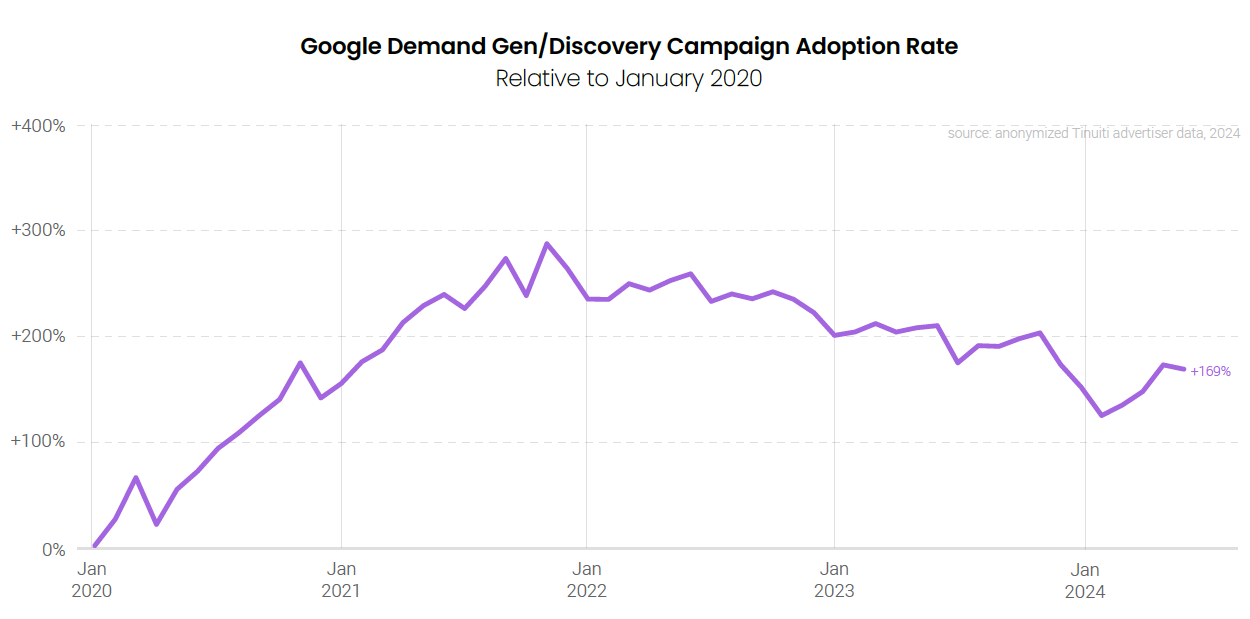
After dropping to start the year, the adoption rate for Google Demand Gen campaigns has improved in recent months, however, it remains down from an all-time high in late 2021. At that time, Demand Gen campaigns were known as Discovery campaigns, but Google began transitioning to the current model in Q4 2023. Demand Gen campaigns brought with them new inventory sources, including from YouTube Shorts.
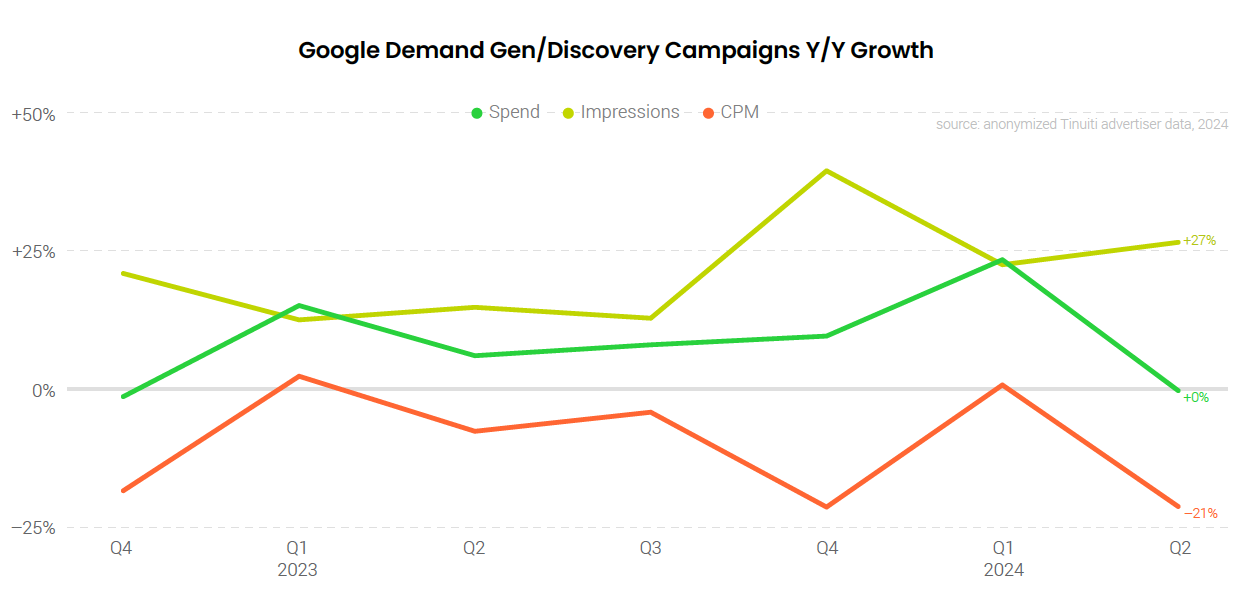
For advertisers that have consistently run Google Discovery/Demand Gen campaigns over the past year, spending growth was flat Y/Y in Q2 2024, which was a sharp slowdown from 24% Y/Y growth in Q1. While Demand Gen impression growth improved to 27% Y/Y, average CPM went from a 1% lift in Q1 to a 21% decline in Q2.
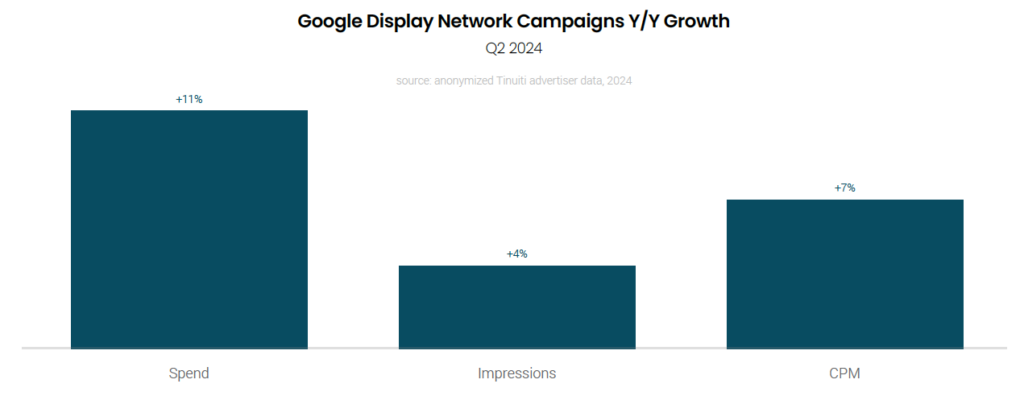
Advertiser spending on the Google Display Network (GDN), including display, app, and video inventory, was up 11% Y/Y in Q2 2024, a slight acceleration from 10% growth a quarter earlier. GDN impressions rose 4% Y/Y in Q2 2024, which was up from a 1% decline in Q1. GDN CPM growth slowed from 12% Y/Y in Q1 to 7% Y/Y in Q2 as the pricing comp from a year earlier strengthened.
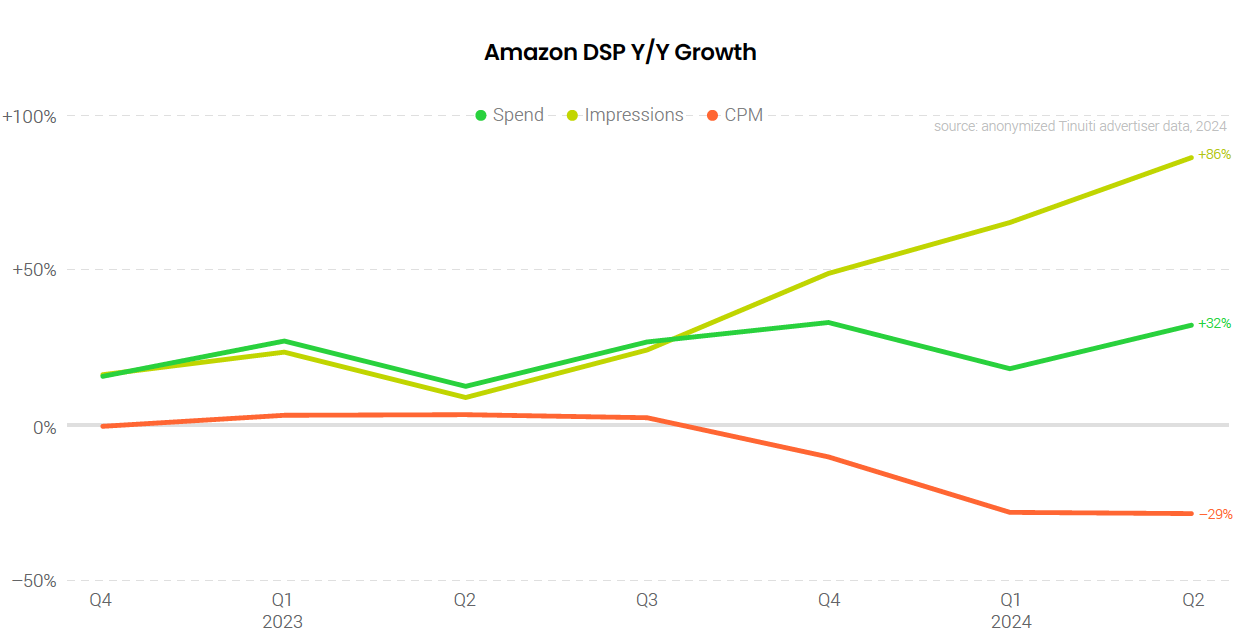
Amazon demand-side platform (DSP) spend increased by more than 30% year over year in the second quarter, accelerating from 18% growth in Q1 2024 as advertisers ran up against weaker year-ago comps. Two-year spend growth held roughly steady from Q1 to Q2. The average cost of impressions once again declined 29% year over year, the same figure observed in Q1, but impression volume soared 86% year over year in Q2.
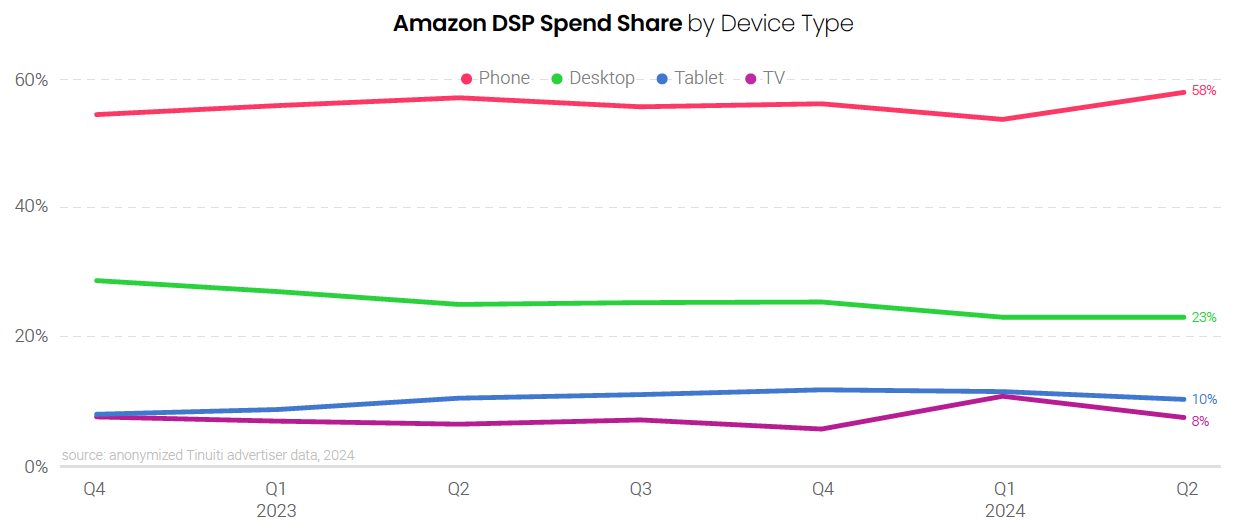
Advertisers spent 8% of all Amazon DSP spend on television devices in Q2 2024, up from 7% in Q2 2023. TV share of DSP spend is likely to continue to grow with the introduction of Prime Video ads to the available inventory sources. Phone spend share held steady year over year, while spend share for desktop and tablet devices both declined compared to the second quarter last year.
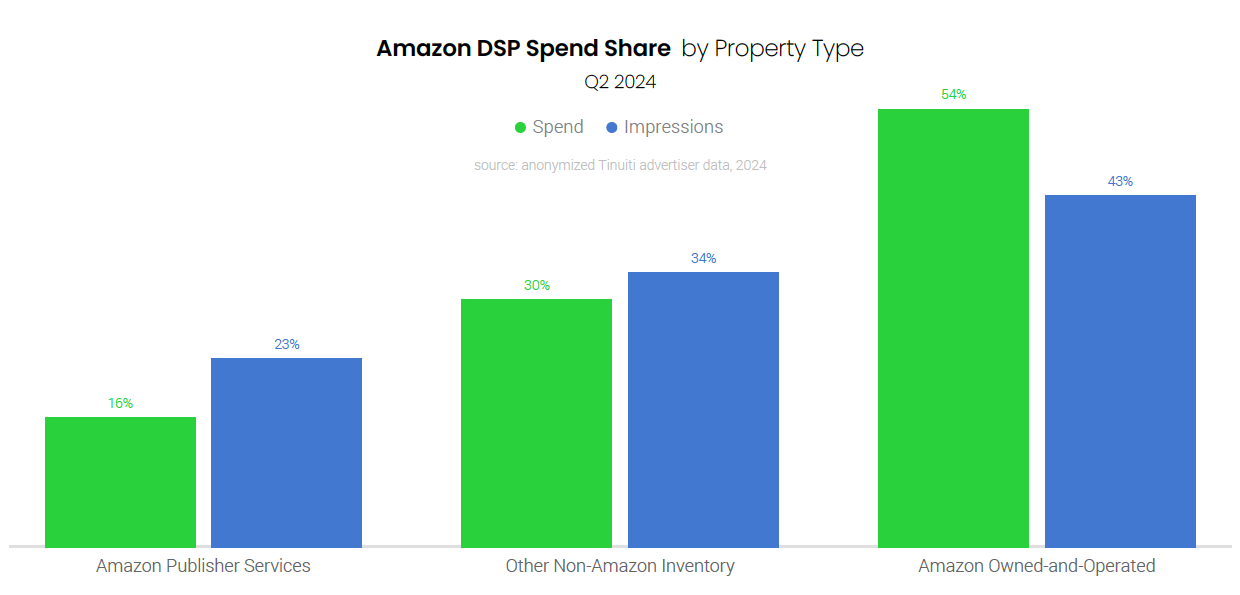
The share of total Amazon DSP investment going to Amazon owned-and-operated (O&O) properties was 54% in Q2, up from a 48% share in Q1 and more closely aligned with the 53% observed in Q4 2023. O&O spend share continues to outpace the share of impressions attributed to these properties, as this inventory comes at a premium CPM compared to other placements targetable through the Amazon DSP.
Check out our most recent Digital Ads Benchmark Report for more exclusive insights.
