
Amazon Brand Analytics (formerly known as Amazon Retail Analytics, or ARA) is one of the most powerful tools available to vendors who want to better understand and improve their operational performance.
Unfortunately, the challenge is interpreting Amazon Brand Analytics (specifically Premium reports) and utilizing the data to make actionable changes.
Simply put, all vendors focused on growing their partnership with Amazon need to be invested in an ongoing, data-driven process to manage their Amazon operations.
The good news is – we’re here to help.
In the following guide, we deep dive into both programs (ARA Basic & Premium) to help vendors better understand the metrics, reports and tools available today.
FREE WEBINAR: “How to Improve Your Amazon Operations to Grow Purchase Orders & Profitability“

What is Amazon Brand Analytics Basic?
ARA Basic is a program automatically provided by Amazon to vendors.
Recently, there have been several enhancements to ARA Basic which allow vendors who choose not to have ARA Premium to get more specific data than in the past.
Pro-tip: While Amazon is currently in the process of transitioning ARA Basic to a format similar to the ARA Premium, the current version is still available and has valuable information. We will keep you updated in the future of the transition and changes to ARA Basic reports once they are finalized.
Currently ARA Basic provides:
- Fast Track Instock Report
- Sales and Inventory Monthly Summary Report
- Sales and Inventory Product Details
- Vendor Catalog Listing
- Demand Forecast
- Operational Metrics
- Lead Time Details
- Sale and Inventory Dashboard
Keep in mind, most of the reports available in ARA Basic (including Fast Track & Sales Inventory) can be filtered to include more detail based on:
- Brand
- Category
- Subcategory
- Product group
- Replenishment code
What does ARA Basic provide?
1) Fast Track Instock Report:
This is a key report that gives vendors information by ASIN of instock position and whether an ASIN is Fast Track/Prime eligible.
Why is this report valuable?
Having a product Prime eligible remains the most important metric when Amazon analyzes a vendor’s performance and ability to meet customer’s need.

It is also more important than in the past to analyze a vendor’s stock position as Amazon is now relying on the vendor to hold inventory for replenishment needs and writing fewer bulk purchase orders unless there is a price concession or a vendor can convince them there is inventory constraint.
There are several columns on this report which give a vendor the reason they are either in stock or not in stock.
Columns within the Fast Track Instock Report:
Fast Track Buy Box Rate – The percentage of customer glance views (hits/impressions) that had a Fast Track offer on the detail page and Amazon also won the Buy Box. To have a Fast Track offer, inventory must be at an Amazon Fulfillment Center and also be able to give a Fast Track delivery promise to the customer.
Replenishable Buy Box for Fast Track Rate – The percentage of glance views (hits/impressions) that have a Fast Track offer on the detail page where Amazon won the Buy Box and the ASIN is also listed as replenishable from you.
OOS Replenishable GV Percent – The percentage of glance views (hits/impressions) during which the ASIN was out of stock but replenishable. This is measured over the total number of customer glance views (hits) that the ASIN had.
Views on Unpublished Items Rate – The percentage of glance views (hits/impressions) on unpublished ASINS, measured over total customer glance views (hits) to your ASINS. This is also called glance views on unpublished ASINS percentages.
Views for Other Reasons Rate – The percentage of glance views (hits/impressions) on items that were in stock with a winning Amazon Retail offer that was not eligible for Fast Track or that did not have an offer from Amazon Retail, but a third-party merchant did have an offer.
LBB Rate – The percentage of customer glance views (hits/impressions) in which Amazon lost the Buy Box to a third party. This is measured over total customer glance views to your items.
LBB due to Price Rate – The percentage page views during which Amazon had the item in replenishable state and lost Buy Box to a third party merchant due to uncompetitive price. This excludes items that are not released yet.
Non-replenishable LBB due to Price Rate – The percentage page views during which Amazon had the item in non-replenishable state and lost Buy Box to a third party merchant due to uncompetitive price. This excludes items that are not released yet.
LBB due to OOS Rate – The percentage of glance views (hits/impressions) during which Amazon had the ASIN in a replenishable state and lost the Buy Box to a third-party merchant due to being out of stock (OOS).
Pro-Tip: A higher rate than non-replenishable LBB due to OOS is encouraged because more replenishable stock enables Amazon to win the Buy Box and provide more predictable delivery promise to customers. This excludes items that aren’t released yet.
Non-replenishable LBB due to OOS Rate – The percentage of glance views (hits/impressions) during which Amazon had the ASIN in a non-replenishable state and lost the Buy Box to a third-party merchant due to being out of stock (OOS).
Pro-Tip: A rate lower than LBB due to OOS is encouraged because it enables Amazon to win the Buy Box and provide more predictable delivery to customers. This excludes items that aren’t released yet.
2) Sales and Inventory Monthly Summary Report:
Shows Shipped COGS and Sellable Inventory on hand for the time a vendor has been engaged with Amazon.
Why is this report valuable?
The primary use for this report is to analyze the return rate (which will need to be calculated) and how it relates to the damage allowance you are giving AMZ.
Pro-Tip: If the return rate is higher than the damage allowance a vendor should expect pushback for a higher allowance. This report also has unsellable units on hand at AMZ FC. This should be looked as well as if the number is high it means a vendor may have product that have excessive damage probability. It also includes any product that is subject to recall or you have agreed to take back.
3) Sales and Inventory Product Details
Works in conjunction with the Sales by Inventory Monthly Report to give details at the ASIN level. It should be imported (Shipped COGS and Replenishment Code) into the Fast Track Metric Report for a detailed snapshot of ASIN with either a high return rate or unsellable inventory.
4) Vendor Catalog Listing
Gives details for the core data needed to be in the Amazon Catalog. It also includes the Brand which product is displayed under and the Page View Rank within the total vendor listing.
Along with being able to sort each column there are specific sort categories at the top of page requiring action.
- Product Missing Images – Even though a vendor is the main supplier of a product, if they did not submit images but allow 3rd party images to populate the detail page, the ASIN will be listed as missing images.
- Product with Data Quality Issues – Gives details of where data is missing which when supplied will enhance detail pages.
- Out of Stock – Top OOS ASINs along with Page View Rank. Filtering this report would be important to first analyze replenishable items which require action but also to look at obsolete ASINs to determine whether a redirect to new ASIN is needed.
- Items Needing Prep – This option allows a vendor see ASINs requiring prep and what exactly is needed. This list is not all inclusive and a vendor should pay particular attention to ASINs that have different color variations and similarly packaged ASINs and adjust accordingly. While the chargebacks to handle this in the Amazon FC are small at the ASIN level, they can add up over time if not addressed. Also by not sending items in properly prepped causes a delay in making the product sellable on the site as it moves out of the automated receipt process to a manual one.
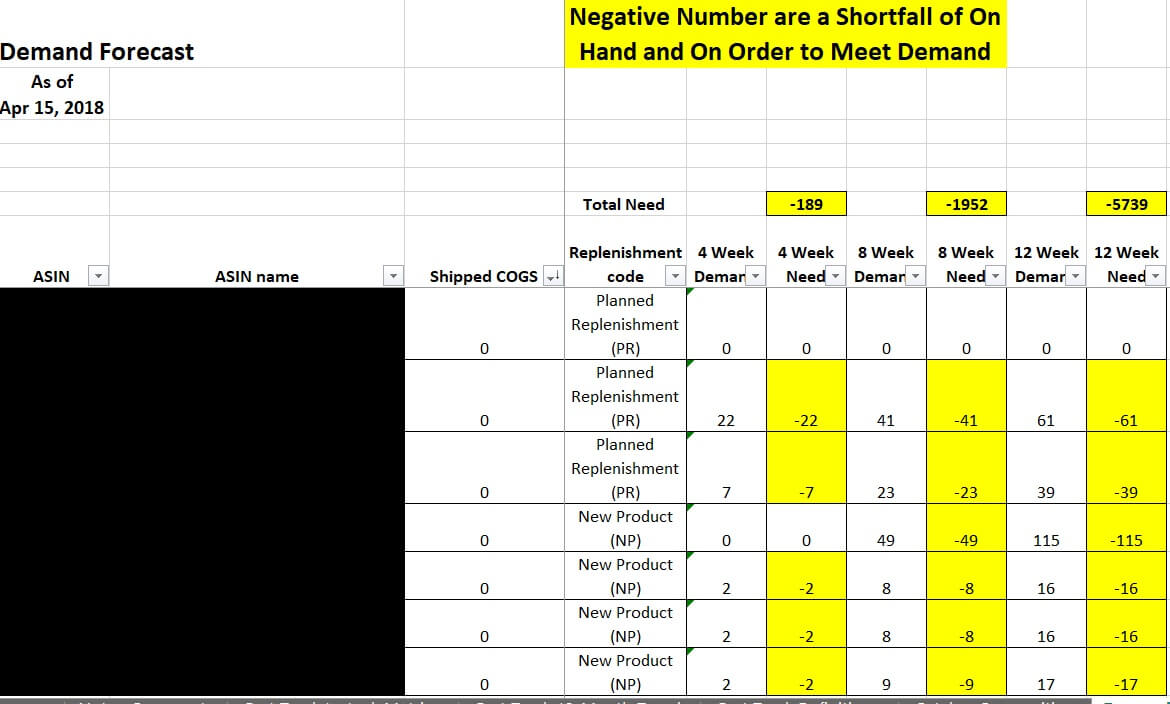
5) Demand Forecast
Used to project inventory need for the next 26 weeks. It does require calculations for specific time increments (4, 8, and 12 weeks, etc.). It does not include the Shipped COGS for ASINs which must be imported (from Sales and Inventory Product Detail) to make sure the stock position is correct for top performers.
Why is this report valuable?
The report is the key guideline for a vendor having inventory when Amazon needs it as Amazon is now relying on the vendor to hold inventory for replenishment needs and writing fewer bulk purchase orders unless there is a price concession or a vendor can convince them there is inventory constraint.
It is also important a vendor not blindly accept the Amazon demand indicated as there may be reasons that purchase orders are not being generated. These usually fall into two categories: FC capacity constraint or the vendor is the vendor of record however orders are going to another vendor (usually a distributor) due to availability, price or profitability.
Unless an agreement is in place that all purchase orders will come to a specific vendor (rare), Amazon will send purchase orders to the vendor the best price and profitability calculation.
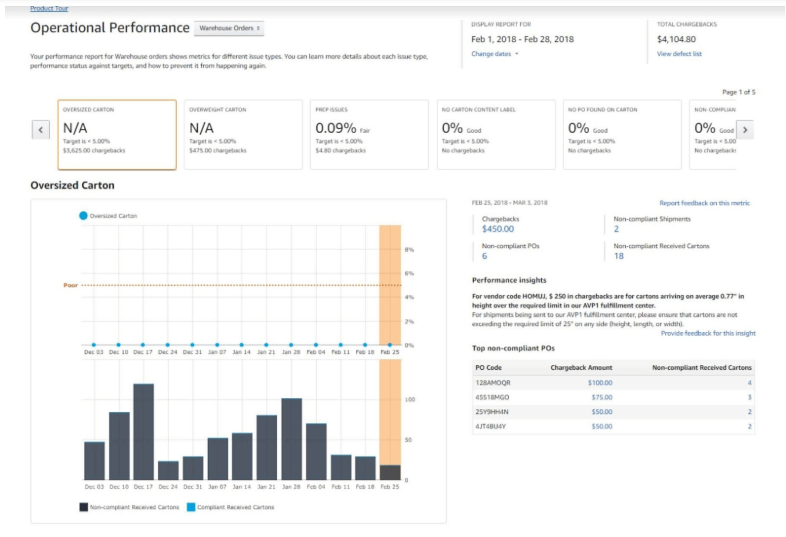
6) Operational Metrics
Shows performance metrics on a monthly basis. While it shows data for Fast Track calculation this also appears in the Fast Track Instock Metric Report.
The more important segment of this report would be the Vendor Lead Time (VLT) and the components that are used to calculate it. Amazon relies on vendor to have product and ship it quickly and efficiently. Metrics are given for each step of the process to calculate VLT.

Metrics are:
- PO Submit to Confirm (time to confirm submitted PO)
- Prep Time (time to get product ready to ship from receipt of PO)
- Transit Time (time from vendor’s facility to Amazon FC)
- Delivery to Receipt Time (time it takes for product to be received into the system at Amazon FC)
Each vendor has an overall VLT goal which is monitored by FC operations. While Amazon will not allow excessive VLT it does create this goal by analyzing vendor performance over the previous 12 months.
7) Lead Time Details
Gives the Vendor Lead Time (VLT) at the purchase order level from the issuing of a purchase order to arrival in the Amazon FC. This metric is used if a product is available from two different vendors. Usually the vendor with the shortest lead-time will receive the purchases orders assuming pricing and profitability are relatively the same.
8) Sale and Inventory Dashboard
Quick snapshot of Shipped COGS and Units available in the Amazon FC. Dollar metric are given on weekly, monthly, quarterly and year to date timeframes.
What is Amazon Brand Analytics Premium?
For an additional fee, Vendors can apply for access to Amazon Brand Analytics Premium, an add-on suite of additional reports which Vendors have access to through Vendor Central.
ARA Premium can be found within Vendor Central under Reports -> Amazon Brand Analytics Premium.
Pro-Tip: If you do not see this option, it is because the Vendor does not have access to the reports.
According to our experts, in comparison to ARA Basic, the new ARA Premium program supplies more actionable data and more sorting options allowing for more detailed analyzation.
“A vendor needs and strong understanding of not only revenue but also what is driving it. ARA provides insights on where revenue is generated, competition, customers’ behavior, and most importantly ASIN level performance metrics,” Eric Kauss, Manager, Vendor Operations – Amazon at CPC Strategy said.

What does ARA Premium provide?
All of ARA Basic reporting (listed above), plus:
1) Snapshot:
This is the quickest way for a vendor see how it is performing in what Amazon considers six key metrics and top 10 ASINs within each metric. Metrics are: Ordered Revenue, Ordered Units, Replenishable Out of Stock (OOS), Net Pure Profit Margin (PPM), Lost Buy Box (LBB), and Buy Box (top ASINs winning the Buy Box).
If you click on Details next to the Metrics name it will give the information for the entire catalog and by ASIN. It can be filtered by Ordered Revenue, Shipped Revenue, or Shipped COGS as well as on a weekly or monthly basis.
2) Sales Diagnostic:
Currently this is the most holistic report for including most metrics. It identifies opportunities by determining what is contributing to sales performance within traffic, glance views, price, or out of stock. It includes a total recap of the timeframe selected as well detail at the ASIN level for the complete catalog.
Detailed can be sorted at various levels:
- Ordered Revenue, Ordered Units, or Shipped COGS
- Weekly or Monthly
- Category or Subcategory
- Brand
The information at the ASIN level includes more detail including the 6 key metrics from the snapshot as well as the ability to be filtered by other data points particularly the parent ASIN level.
Columns Data can be sorted and includes:
- Ordered Revenue rank and Ordered Units rank for the timeframe
- Percentage of above to the timeframe performance
- Percentage +/- to the prior period
- Percentage +/- to prior year
- Subcategory Sales Rank – Performance within subcategory classification within Amazon
- Subcategory (Better/Worse) – Compares revenue growth rate to Amazon subcategory growth rate. Shows result as a percentage.
- Average Sales Price and +/- to prior period
- Glance View Changes to the prior period and YOY. Defined as: Percent change in Glance Views to Prior Period. The formula is ((Current Period – Prior Period)/Prior Period) x 100.
- REP Out of Stock (OOS) – percentage OOS for the timeframe
- Percentage to the Total OOS
- Percentage +/- to the prior period
- Lost Buy Box (LBB) – due to price
If there is a need for a total picture of all relevant metrics it is suggested you import the following from the reports below:
- Net PPM
- Conversion Data from either Sales Performance Trend or Traffic Diagnostics
- Unique Visitor Data from Traffic Diagnostics
- Customer Reviews
3) Sales Performance Trend:
Gives an overview at the vendor level by either week or month of key metrics and compares it to the prior period. Metrics included are:
- Ordered Revenue
- Ordered Units
- Average Sales Price
- Glance Views
- Conversion
4) Net PPM:
Identifies what products are contributing to profitability by viewing: Net PPM, percentage of total, percentage of prior period and percentage of previous year. Calculation for Net PPM is:
(Product Revenue – COGS) + Vendor CO-OP Funds/Product Revenue
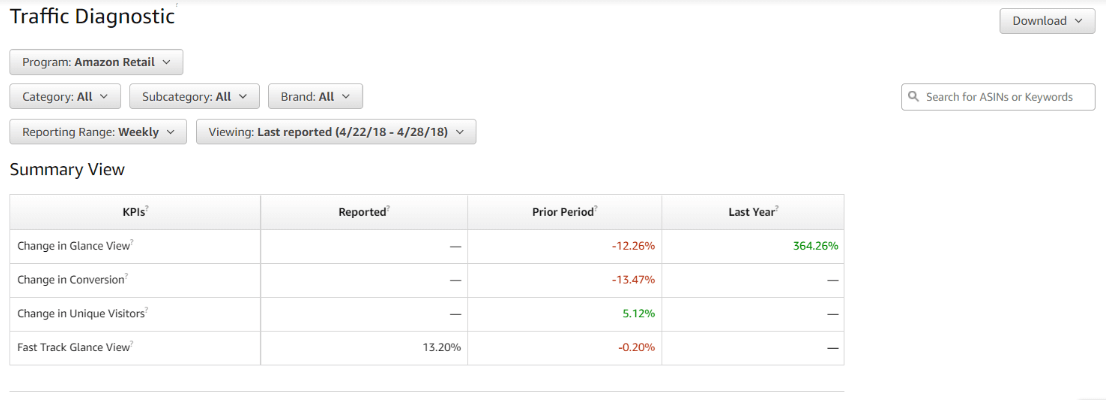
5) Traffic Diagnostic:
Identifies changes in:
- Glance Views
- Conversion
- Unique Visitors
- Fast Track Glance views (by prior period or previous year)
Fast Track Glance Views are a key metric to drive overall performance in order to calculate instock position for viewed products.
Amazon defines Fast Track Glance View as: Percentage of glance views when the buy-box winning offer is Fast Track in comparison to the total number of glance views.
6) Forecast and Inventory Planning:
This is the new Demand Forecast which shows need for 1, 4 or 12 week periods. It also includes other data that is not in the Demand Forest in ARA Basic: OOS, Fill Rate, and Vendor Lead Time (VLT).
It does NOT rank this product by revenue so if you want to view the data by top revenue performance you will need to import it from the Sales Diagnostic section.
- The inclusion of the OOS is new and allows analysis at the ASIN level.
- The Fill Rate is also new and is defined as the rate at which a vendor fills orders relative to what is confirmed.
If a vendor does not fill what they confirm there will be chargebacks. VLT is used if a product is available from two different vendors. Usually the vendor with the shortest lead-time will receive the purchases orders assuming pricing and profitability are relatively the same.
The report is the key guideline for a vendor having inventory when Amazon needs it as Amazon is now relying on the vendor to hold inventory for replenishment needs and writing fewer bulk purchase orders unless there is a price concession or a vendor can convince them there is inventory constraint.
It is also important a vendor not blindly accept the Amazon demand indicated as there may be reasons that purchase orders are not being generated.
These usually fall into two categories:
FC capacity constraint or the vendor is the vendor of record however orders are going to another vendor (usually a distributor) due to availability, price, or profitability. Unless an agreement is in place that all purchase orders will come to a specific vendor (rare), Amazon will send purchase orders to the vendor the best price, profitability, and VLT calculation.
7) Inventory Health:
Monitors the health of the inventory through weekly updates; quickly identify and respond to unfavorable trends. This report looks at sell-through based on 30 and 90 day timeframes and calculates the potential excess that may be in an FC.
This information can be used for two potential actions:
- Vendor promotions either in a lightning deal or best deal
- AMS Campaigns.
Vendors also need to be aware of large amounts of any specific ASIN as it may trigger a request of a return to vendor or promotional funds to liquidate particularly for the 90 day window.
8) Amazon Search Terms:
Discover what products are winning the most clicks and conversions on strategic search terms and assess the impact of your marketing campaigns by monitoring trends. The primary mechanism in order to use this data is to analyze the search frequency and which ASIN was viewed because of that search.
Proper use of this report will help target keyword search terms and competitive ASIN for AMS campaigns. Information is either at the overall search level or by department. You can analyze either by search term or by ASIN.
9) Repeat Purchase Behavior:
Shows ASIN which had a repeat purchase a specific customer and the percentage of time this occurred. The benefit of this report is limited to the type of product offered and whether it is applicable to a repeat purchase. It does help better strategize and assess your marketing campaigns to drive repeat purchases and acquire new customers.

Market Basket Analysis – Identify cross-selling and bundling opportunities by gaining insight on products that are being purchased together by your customers. The advantages of selling bundles/packaged sets are:
- You control the pricing both a cost and retail which can enhance your profitability.
- Since you are the only one creating the set there should not be 3rd Party Marketplace competition.
- If costing is handled correctly sets can be strong lightning deals.
- If there is success during normal selling/promoting, the item could be considered for a Deal of the Day if enough units can be made available. Vendor Manager would need to be involved in that process.
10) Item Comparison and Alternate Purchase Behavior:
These reports appear on the same link however they supply distinctly different metrics. The Item Comparison gives detail on what ASIN a customer views in addition to the vendor’s and at what rate.
The Alternative Purchase gives what items were actually purchased instead of the vendor’s product. Can also be used for both Packaged Set opportunities and competitive AMS campaigns on ASIN not supplied by the vendor.
11) Customer Reviews:
One of the key metrics that customers look for when reviewing a detail page. Report gives the average over the lifetime of the aASINsin as well the number of reviews segmented by how they were reviewed (star rating). Any ASIN with less than a 4 star review should be analyzed as to reason and potential fix of data.
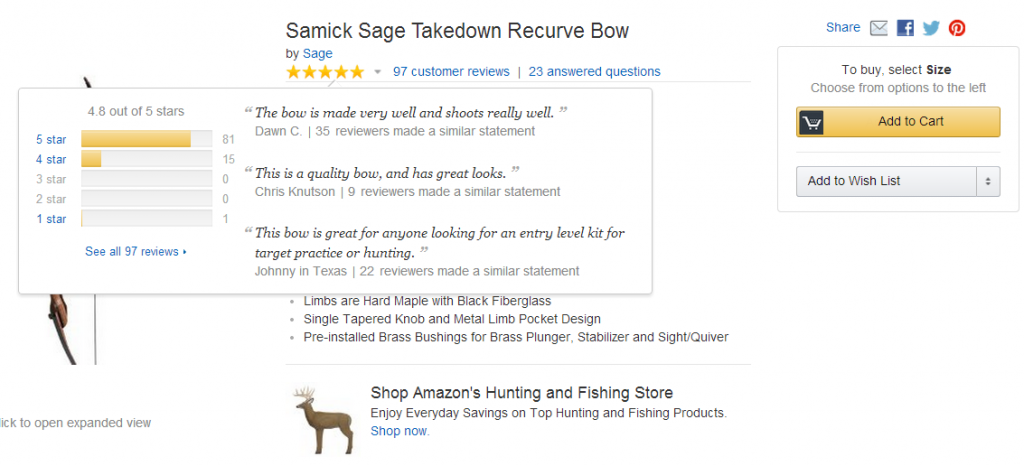
This should be sorted at the parent ASINs level as reviews are consistent through all child ASINs. It may also allow targeting of ASIN that do not have reviews for the Vine program. This report also is important to import to the Sales Diagnostic for the more comprehensive view of an ASINs performance.
12) Additional Reports
The following reports supply data that, will informative, are only for informational purposes at this time. Once Amazon gives a clear picture of the overall use of this information we will update in future postings.
Geographic Sales Insights – Shows Sales information by state, city, or zip code.
- Real Time Sales – Shows sales for an ASIN on an hourly basis. Could potentially be used to target a specific time frame for a Lightning Deal.
- Demographics – Shows sales data by age, household income, education, gender, and marital status. This information is only for Prime transactions for which the customer has supplied to Amazon.
Using ARA Basic & Premium Data To Your Benefit:
One of the key benefits to ARA Basic or Premium is the ability to leverage this data to inform your advertising efforts. CPC Strategy recently introduced our Amazon Vendors Operations Program to assist vendors in this process and better inform their marketing efforts on- and off-Amazon.

So, how do you determine whether there may be a need for operational consulting?
Kauss recommends taking a closer look at Vendor Central, Reports, ARA Basic, and reviewing your Replenishable Fast Track Buy Box Rate or Fast Track Glance View Rate.
“If it’s below 75% there may be operational factors impacting your ability to maximize sales. Target should be 90% or above,” Kauss said.
“It doesn’t matter if you are using ARA Basics or Premium, if you need assistance in some form – that is something we can provide.”
“That being said, the premium module is significantly more sophisticated and requires much more of an analytical deep dive.”
How Vendors Benefit from Amazon Vendor Operations Consulting
By leveraging data within ARA Basic and ARA Premium, vendors can:
- Better refine targeting efforts across other Amazon advertising platforms including Amazon Marketing Services and Amazon Media Group.
- Use this operation data to inform your marketing efforts across other channels (example, social) to drive traffic back to Amazon.
To learn more, check out “What You Should Know About CPC Strategy’s Amazon Vendor Operations Program” or email [email protected].
You Might Be Interested In