The Skinny: Video streaming is rapidly becoming the dominant medium for TV consumption, with over 90% of US households now utilizing streaming services and more than half of the population expected to use ad-supported tiers by 2026. This shift is driven by “subscription fatigue,” leading consumers to trade ad-free experiences for lower costs, while advertisers benefit from declining CPMs and the migration of high-value content like live sports to digital platforms.
Streaming video is gradually overtaking broadcast TV as the media of choice for many viewers, and for good reason. It’s convenient and offers much higher levels of interaction and engagement than TV or the theater.
With that in mind, it’s no wonder that marketers are investing more budget into video streaming services. They provide an increasingly popular and effective way of reaching modern viewers and are the ideal choice for brands that want to target potential customers with laser precision.
To help support your own streaming initiatives, we’ve compiled just over 100 streaming video statistics that you can use to develop your business strategy.
Highlighted Video Streaming Statistics
If you just want the best streaming statistics quickly, we have you covered. Here are the five streaming statistics that we think every marketer should know about in 2024 and beyond:
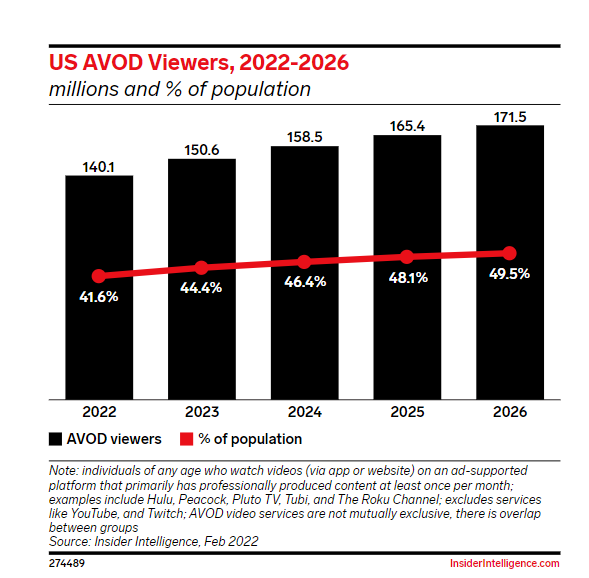
Over half of the U.S. population will be watching content from at least one ad-supported streaming service monthly by 2026 and more than half of all U.S. internet users (55.8%) will be watching content via AVOD services by 2026
Half of new subscribers to Disney+ opt to use the ad-supported tier
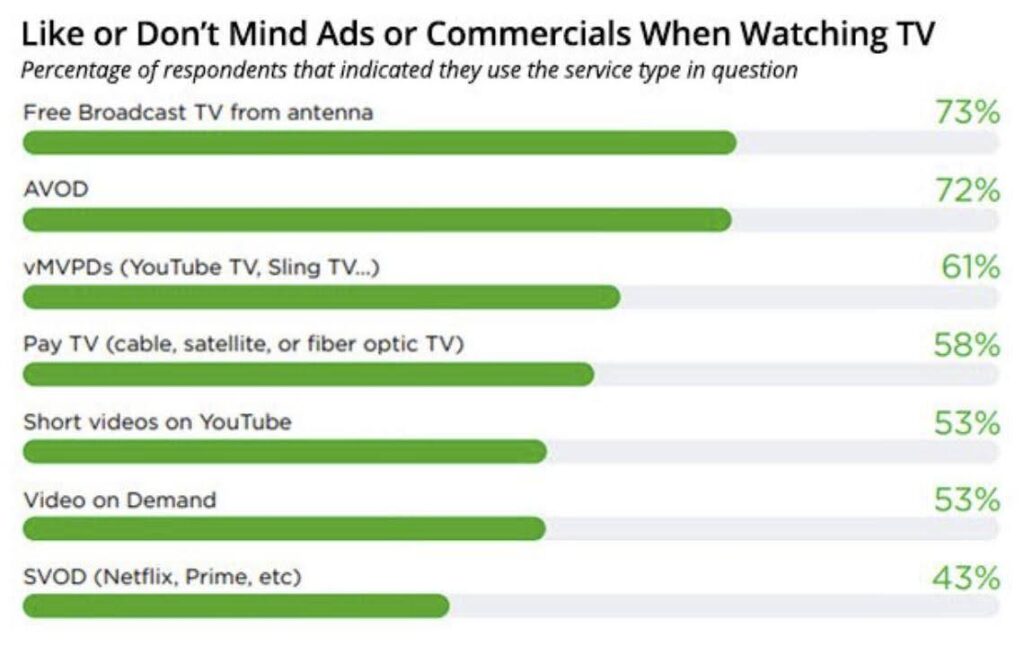
60% of viewers using pay-TV services like or don’t even mind ads being part of their viewing experience
54% of US internet users subscribe to four or more over-the-top (OTT) video services, while 20% subscribing to 8 or more services. [16]
In 2024, brands spent $30.10 billion on streaming advertisements, compared to $60.56 billion on traditional TV ads
Your 2026 Blueprint for TV, Audio, and Display
Learn how to measure cross-channel incremental gains and create a strategy that fuels growth and reduces waste.
Experts are noticing a variety of trends in the streaming space. Here are the key takeaways that will help guide your marketing strategy:
Streaming is a rapidly growing industry, no matter how you slice it. More streaming services are entering the game each year, more marketers are investing more budget in streaming TV, and subscribers are on the climb globally. Consider that CTV ad spend is projected to grow by more than 20 percent in 2024 while nearly twice as many consumers watch CTV as opposed to traditional TV.
Advertising costs on streaming services are trending downward. Much to the relief of marketers trying to keep their budgets under control, streaming CPMs have declined approximately 60 percent between Q4 2022 and 2023. This is due to consumers spending 9.3 percent more time watching CTV services in that time frame, while ad loads have increased by as much as 67 percent.
Privacy is becoming a prominent concern. Due to cookie deprecation and other privacy-first measures, marketers are having a difficult time reaching the right audiences and optimizing their ad spend on all platforms – including CTV. Marketers will likely need to depend on data clean rooms or agencies with established network relationships to access the data they need.
Streaming services are poaching offerings previously found exclusively on linear TV. Live sports used to be a buoy for the linear TV industry – but with the emergence of platforms like ESPN+ and new partnerships like Thursday Night Football on Twitch.tv, these views are also moving to streaming platforms. Additionally, platforms like SlingTV are beginning to offer a small selection of cable channels at a budget price point.
Programmatic advertising is on the rise. Programmatic ad buys are commonplace and respected within the display advertising space, and this form of media buy is becoming more popular in the streaming space. CTV programmatic ad spend is expected to reach $24 billion in 2024, an increase of 23.3% compared to 2023.
“We still believe consumer attention is massively focused on search, social and marketplaces or retail media, but the biggest place that consumer attention has gone is obviously OTT and connected television.”
– Zach Morrison, CEO, Tinuiti
General Video Streaming Statistics
About 60% of young adults in the US primarily use online streaming to watch TV [1]
The number of Americans who watch television via cable or satellite has plummeted from 76% in 2015 to 56% in 2021 [2]
U.S. adults now spend nearly 6 hours per day watching video. The span (5:57) represents an 11-minute increase in video consumption, with 6 of those 11 minutes from TV-connected devices [3]
83% of US households in 2023 used a paid subscription video service like Netflix or Hulu [4]
As of 2024, 50% of consumers who watch online video use a free or paid ad-supported streaming service [5]
Millennials remain the largest segment of CTV users (62 million), while Gen Z trails closely behind (52.8 million). Additionally, 51.6 million Gen X and 35.8 million Baby Boomers use CTV. [6]
Consumers are 39% more likely to share content if it’s delivered through video [7]
While video can help convert customers already on a path to purchase, it also enables a retailer’s existing customers to bring friends and family into the fold — 48% of consumers have shared a brand video on their social media profile [7]
Nearly 80% of marketers recognize video (including TV, digital video, social video, and OTT video) as an increasingly important medium [8]
Video could make up as much as 90% of all 5G traffic [9]
29% of consumers would pay a premium if 5G provided “better quality video” on mobile devices and “decreased buffering while streaming video” [10]
Interactive video ads encourage consumers to spend 47% more time engaging with an ad on average and make the ad 32% more memorable [11]
Consumers have a low tolerance for a bad stream. For many, 90 seconds is the most a viewer will tolerate a spotty stream [12]
Streaming accounts for 26% of all time spent on TV [13]
Annual CTV ad spend in the US is expected to reach $36 billion in 2026. [14]
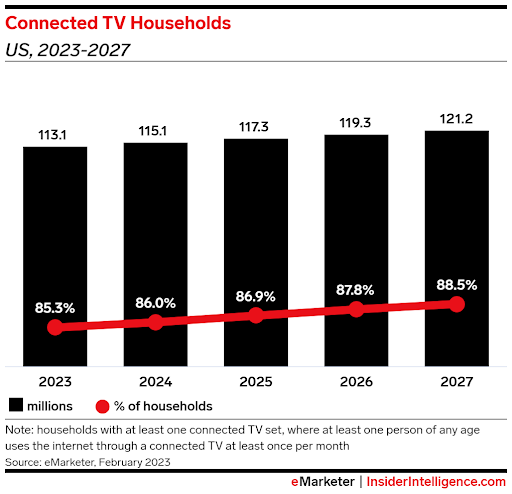
68% of the US population (233 million people) uses a connected TV [15]
54% of US internet users subscribe to four or more over-the-top (OTT) video services, while 20% subscribing to 8 or more services. [16]
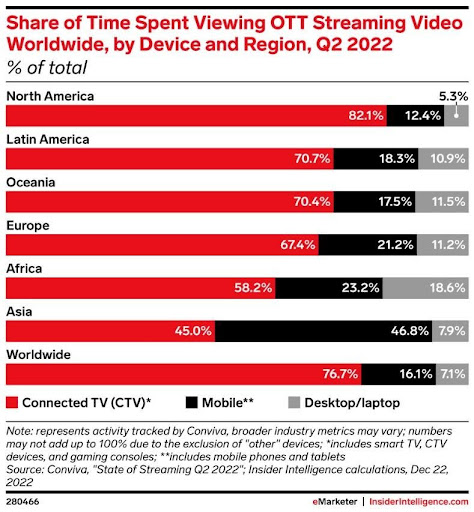
In Q4 2023, TVs accounted for 58% of spending for streaming video ad inventory purchased through traditional buys. Phones and tablets account for another 32% of spending, while desktops and laptops accounted for the remaining 10% [17]
Ad spend for streaming platforms like Hulu, Netflix, and Max rose by 10% year over year in Q4 2023. [17]
For streaming ad inventory purchased through real-time bidding, mobile devices accounted for a majority of spending in Q4 2023, while television accounting for 27% and computers accounting for 22% [17]
In 2024, brands spent $30.10 billion on streaming advertisements, compared to $60.56 billion on traditional TV ads [18]
There are approximately 115 million CTV households in the United States [19]
Global Streaming Statistics
Globally, 44.9% of internet users subscribe to a paid OTT service, including Netflix and YouTube. North America is the largest market region, accounting for 73.6% of subscribers [20]
Outside of North America, 56.1% of internet users in Western Europe use paid OTT services, followed by 47.7% of Asia-Pacific and 41.% of Latin America [20]
The least popular regions for paid OTT viewership have been Central and Eastern Europe (27.6%) and Middle East/Africa (20.6%) [20]
Although the Middle East and Africa currently have low adoption rates of OTT, the OTT market in Middle East/Aftrica is expected to grow by 14.2% in 2024. [21]
Half of the world’s internet users (2.44 billion people) will watch YouTube in 2024 [20]
Approximately 750 million people will subscribe to OTT services in China in 2024. However, they will primarily use platforms like iQiyi, Tencent Video, and Youku [20]
China’s live-streaming industry has more than 425 million users [30]
India has 13% of worldwide OTT subscribers [20]
Netflix reports having 15 million global monthly active Basic With Ads users worldwide [22]
3.78 billion people around the world watch digital video at least once a month, and 57.4% of that population will pay for subscription OTT services. [23]
Statistics About Video Streaming Viewers
Among viewers aged 18-24, 87% choose to access TV content through the internet [24]
Over 65% of cord-cutters want free or reduced cost ad-supported services [25]
Current estimates indicate that approximately 85% of households utilize at least one streaming service [26]
60% of viewers using pay-TV services like or don’t even mind ads being part of their viewing experience. [27]
Livestreaming Statistics
Live content earns 27% more minutes of watch time per viewing, nearly 6 more minutes, at 24.41 minutes on average, for live video versus video on demand (slightly fewer than 18 minutes) [28]
Users watch live video 10 to 20 times longer than on-demand content, making live streaming a powerful way to deliver interactive content [29]
44% of live streaming video viewers said they watch less live TV as a result of live streaming [31]
Live commerce initiated sales could account for as much as 10 to 20 percent of all e-commerce by 2026 [32]
Social commerce sales will reach $107.17 billion by 2025 [33]
41.2% of consumers said they tune in to livestreams focused on home products, and 37.5% said they watch live shopping events for electronics [34]
52% of live video viewers stream content through social media [35]
105.3 million Americans used digital mediums to watch live sports in 2024, an increase of 30.8% year over year [37]
OTT & Streaming Platform Stats
For the first time, a higher percentage of US households subscribed to a streaming service (69%) than to traditional pay TV (65%) in 2021 [38]
Consumers struggle with finding video content: only 12% say they are able to find content on streaming platforms easily [39]
Over half of the U.S. population will be watching content from at least one ad-supported streaming service monthly by 2026 and more than half of all U.S. internet users (55.8%) will be watching content via AVOD services by 2026 [40]
According to an eMarketer forecast, nearly a third of the U.S. population will be free ad-supported streaming TV (FAST) viewers by 2027, accounting for a total of 114.5 million viewers [41]
Music Streaming Statistics
Spotify is the world’s most popular audio streaming subscription service with 615 million users, including 239 million subscribers in more than 180 markets [42]
In the audio ad space, Spotify and Pandora were two of the most commonly adopted platforms by advertisers in both Q2 2021 and Q2 2022 [43]
Podcast Streaming Statistics
By 2025, more than 40% of people in the US will be listening to podcasts at least once per month [44]
About 23% of U.S. adults say they get news, at least sometimes, from podcasts [45]
Gaming & eSports Streaming Statistics
31.6 million people in the United States watch eSports at least once per month [50]
Deloitte projected the video game and eSports industry would generate an estimated $184 billion in 2024, and $211 billion by 2025 [51]
Users streamed an average of 411 million hours worth of content on Facebook Gaming each month in 2022, an increase of more than 37% compared to 2020 [52]
Streaming Statistics by Service
Next, let’s break down some of the most recent statistics for the top streaming services — like Netflix, Disney+, and Tubi.
Stay in the Know
Subscribe to our Paid Media Newsletter for weekly updates on media and advertising.
Netflix had nearly 269 million paid subscribers worldwide as of the fourth quarter of 2022 [55]
Nearly one in three U.S. Netflix users said they would not drop the streaming service during the password sharing debacle of 2023 [53]
In 2022, 8% of U.S. adults stated that they would consider subscribing to an ad-supported version of Netflix if it came at a lower price [54]
In line with the previous statistic, Netflix had 23 million active subscribers to their ad-supported tier in January 2024 – which is 8.5% of all subscribers. [56]
The typical Netflix advertiser paid a little over three times the CPM for Netflix impressions as they did for other non-real time bidding streaming video inventory [17]
YouTube Statistics
YouTube has over 2 billion logged-in monthly users and more than 500 hours of video uploaded every minute [57]
As of January 2023, India was the country with the largest YouTube audience, with 467 million users engaging with the video platform [58]
YouTube advertisers that were active on the platform in both Q4 2021 and Q4 2022 increased their spending by 3% YoY in Q4 2022 [59]
YouTube is the most popular place to watch live content, with 52% of social video viewers in the United States tuning in frequently [60]
Globally, YouTube Shorts gets an average of 70 billion views per day [61]
TV screens are the fastest growing device segment for YouTube Ads, with spending up 44% year over year [17]
Disney+ Statistics
Disney+ had 149.6 million subscribers at the beginning of 2024 [62]
After increasing the price of the ad-free offering by 27% in 2023, Disney+ lost a net 1.3 million subscribers [63]
Half of new subscribers to Disney+ opt to use the ad-supported tier [64]
Disney’s content spending in 2022 was estimated to be 33 billion U.S. dollars, an eight billion dollar increase, while that of Netflix was projected to be 17 billion, the same as its content spending in the previous year [65]
Nearly one in five (18%) of US Gen Z adults indicate that they don’t currently subscribe to Disney+ but would subscribe if it were offered at a lower price with ads [66]
Disney+ CPMs are about 1.5x more expensive than typical streaming ads [17]
Twitch Streaming Statistics
Over 70% of Twitch users are between the ages of 18 and 34 [67]
Spanish-language livestreams on Twitch saw a six-fold gain in audience between 2019 and 2022 [68]
Twitch has approximately 7 million active streamers and 35 million daily visitors [67]
Tubi Statistics
Tubi has over 78 million monthly active users as of March 2024 [69]
Tubi now accounts for 1.5% of all TV and Streaming consumption, making Tubi the most-watched free TV and movie streaming service in the United States [70]
The average Tubi streamer is 37 years old [71]
54% of Tubi viewers are female [72]
42% of Tubi users identify as multicultural [72]
75% of Tubi users live in households that don’t use cable television [72]
85% of users watch Tubi on a TV screen instead of their computer or mobile phone [72]
Hulu Statistics
Hulu currently has more than 49.7 million subscribers across their SVOD (ad-free subscription video on demand) and AVOD (advertising-based video on demand) plans [46]
Industry experts estimate 90% of total Hulu subscribers use an ad-supported plan [73]
However, only about 58% of new Hulu subscribers sign up for the ad-supported plan [74]
Roku Statistics
As of 2024, Roku has a total of 83.4 million monthly active users in the United States [47]
Roku’s worldwide ad revenue hit 2.61 billion in 2024, an increase of 13.1% compared to 2023 [48]
Roku is the top free ad-supported streaming TV provider, followed closely by Tubi [49]
TikTok Live Statistics
50% of TikTok users have bought something after watching a stream on TikTok Live [80]
About 1 in 5 live streaming users also tune into TikTok Live [80]
Facebook Live Statistics
Facebook has paid out over $50 million to publishers and celebrities to use Facebook Live [75]
Daily watch time for Facebook Live broadcasts grew four times over the course of a year [76]
Instagram Reels & Stories Statistics
Digital marketers expect to invest most in creating Instagram Stories (66%) and news feed videos (62%). B2B marketers prioritized newsfeed videos while B2C marketers emphasized Instagram stories [77]
In Q3 2022, Reels accounted for 4.7% and 1.9% of ad impressions on Instagram and Facebook [78]
Brands earn nearly 40% more engagement with Reels compared to other Instagram content formats [79]
See the Latest Data
Download our Digital Ads Benchmark Report for a deep-dive on data across Google, Meta, Amazon, and more.