2017 Internet Trends Report: The Recap For Ecommerce Businesses

For more than 20 years, Mary Meeker an American venture capitalist and former Wall Street securities analyst has presented the Internet Trends Report, a high level annual covering of consumer and business internet trends.
If you don’t have time to watch the 33 minute presentation or flip through all 379 slides, we’ve pulled the most relevant highlights for the ecommerce & advertising market.
So, this one is pretty much a no brainer – internet usage among adults in the U.S. is increasing.
In 2016, adults in the U.S. spent an average of 5.6 hours per day on connected devices including desktops, laptops, tablets, or mobile.
What’s interesting is adults are now spending more than 3 hours each day on mobile alone.
This shift is pretty significant if you compare it to 2008, when mobile internet usage accounted for less than 30 minutes each day.

Although Internet users are spending the majority of their time on mobile, ironically mobile ad spend is under allocated.
As seen in the data below, there is currently a 16 billion opportunity to increase mobile ad spend in the U.S.

Mobile is huge – especially for Google and continues to be the search engine’s biggest driver of growth.
Data indicates that over half of Google’s searches now come from mobile and according to our own research based on client data, from 2014 – 2016 (Q1 2014 – Q1 2016), clicks for Google PLAs on mobile devices with full browsers increased by 389.7%.
Want to learn more about mobile performance on Shopping, check out our study below:
Global internet ad spend surpassed global TV ad spend in 2016.
Although we know advertisers are forfeiting traditional ad formats for digital, it is surprising how quickly the shift has accelerated in the past couple years.
By the end of 2016, US digital ad spending reached $72.09 billion and now represents 36.8% of US total media ad spending.

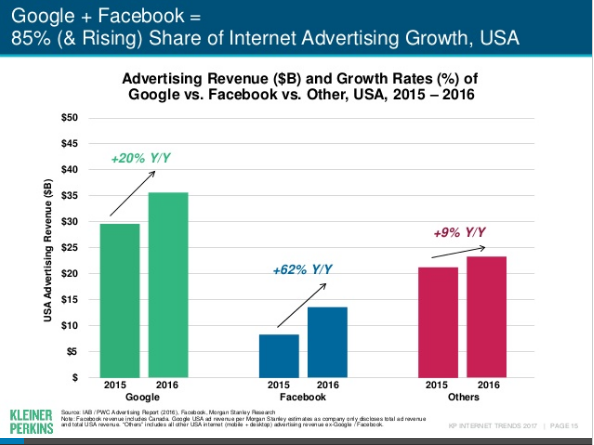
Google and Facebook are responsible for 85% of advertising dollars spent online.
Facebook and Google are predicted to make $106 billion from advertising in 2017, almost half of world’s digital ad spend.

Approximately 18% of U.S. web users leverage ad blocking on desktop, but only 1% on mobile.
As you can see in the data below, there is drastic difference in the mobile ad blocking rate in countries such as Indonesia, India and China vs. the U.S.

So, why are countries outside of the U.S. blocking mobile adds more often?
According to an article by AdExchanger, “The reason many people block ads in APAC markets is not annoyance or poor user experience, which were the principle factors in the rise of desktop ad blocking in the US and Europe. It’s just data costs.”
“One thing you see if you’re in Asia traveling around these markets is that people are on a limited mobile plan, so they’ll do anything to minimize the use of their data,” said Andy Fan, founder and CEO of the Shanghai-based digital ad analytics company RTB Asia said in the article.
Google Product List Ads (PLAs) are now responsible for over 50% of the paid traffic going to retail websites.

Although there are still many companies running rudimentary Shopping campaigns, more and more are understanding how important Google Shopping is to their business and their overall success with traffic generation in 2017.
Want to learn how you can improve your Google Shopping efforts to drive conversions? Check out the guide below:
Although retail store closings are expected to hit a 20 year record high, Amazon shows no signs of slowing down.

According to Scott Galloway, Clinical Professor of Marketing at the New York University Stern School of Business, Amazon is dismantling retail and brands are experiencing an incredibly challenging environment.
“It feels like the reckoning is finally here,” he said at L2’s Amazon Clinic in May.
In Q1, 9 retail bankruptcies were reported (more than all of 2016 combine). Additionally, malls are crumbling (from 2010 to 2013 mall visits declined 50%).
Although there are some companies holding strong like Starbucks, Walmart, & Sephora, there’s still a lot more that are closing.
In contrast, Amazon hit 64 billion in growth since 2010 and now, 52% households have Amazon Prime.
“Today, more people now have Amazon Prime than have a landline phone, just to give you a sense of how much technology has shifted in America,” Galloway said.
To learn more about the 2017 Internet Trends Report, email tara@cpcstrategy.
